


Abstract
Serum carcinoembryonic antigen-related cell adhesion molecule 1 (CEACAM1) is dysregulated in various malignant tumors and has been associated with tumor progression. However, the expression and regulatory mechanisms of serum CEACAM1 in gastrointestinal cancer are still unclear. The expression ratio of the CEACAM1-L and CEACAM1-S isoforms has seldom been investigated in gastrointestinal cancer. In this study, we intended to explore the expression and diagnostic value of CEACAM1 in gastrointestinal cancer. Serum CEACAM1 levels were measured by enzyme-linked immunosorbent assay. The protein expression and distribution of CEACAM1 in tumors were examined by immunohistochemical staining. The expression patterns and ratio of CEACAM1-L/S were analyzed by reverse transcription-polymerase chain reaction. The results showed that serum CEACAM1 levels were significantly higher in cancer patients than in healthy controls. CEACAM1 was found in secreted forms within the neoplastic glands, and its expression was more intense at the tumor invasion front. The CEACAM1-L/S (L:S) ratios were up-regulated during tumorigenesis. Our data suggest that the serum level of CEACAM1 may be used to discriminate gastrointestinal cancer patients from health controls.
Introduction
Carcinoembryonic antigen-related cell adhesion molecule 1 (CEACAM1), a single-pass transmembrane type I glycoproteinand protein, belongs to the immunoglobulin (Ig) superfamily. This widely expressed protein affects both normal and pathogenic processes associated with cellular growth and differentiation [1,2].
Recent studies have demonstrated that the serum CEACAM1 level is increased in patients with pancreatic adenocarcinoma [3], lung cancer [4] and melanoma [5,6]. This increase is further correlated with cancer progression, providing evidence for the potential value of circulation CEACAM1 as a tumor marker [7]. In gastrointestinal cancer, accumulating immunohistochemical and in vitro evidence indicated that epithelial CEACAM1 expression is associated with tumor metastasis and progression [8–18]. However, little information is available concerning the serum CEACAM1, especially in gastrointestinal cancer, one of the leading causes of cancer-related deaths [19]. It is therefore necessary to evaluate changes in serum CEACAM1 in the context of gastrointestinal cancer.
In humans, CEACAM1 exists in 12 known isoforms resulting from differential splicing and proteolytic processing [20,21]. CEACAM1 isoforms differ with respect to the number of extracellular Ig-like domains, membrane anchorage, and the length of their cytoplasmic tails. There are two major kinds of CEACAM1 splice isoforms, i.e. CEACAM1-L and CEACAM1-S, which differ in their cytoplasmic domains [22]. The CEACAM1-L isoform, with the long cytoplasmic domain, contains two immunoreceptor tyrosine-based inhibitory motifs (ITIMs) which generally transmit inhibitory signals [12,23]. The S isoform lacks the ITIM motifs but contain sequences that can bind with calmodulin, tropomyosin, and globular actin, which transduce stimulating signals and regulate interactions with the cytoskeleton [24]. As such, the CEACAM1-L isoform is functionally inhibitory and the most commonly reported isoform [25]. In most cell types and tissues, CEACAM1-L and CEACAM1-S are expressed together, but at characteristically different ratios [26,27]. However, very little information is available concerning the CEACAM1 isoform expression patterns in cancer. Such information would be valuable, as it has been demonstrated that these two isoforms can mutually regulate the activity of each other [28,29].
To determine whether CEACAM1 could be used to discriminate cancer patients from health controls, in this study, we compared the serum levels of CEACAM1 in gastrointestinal cancer patients with benign disease and in healthy controls followed the recommendation by Obuchowski et al. [30] as an exploratory phase (phase I) study. The distribution of CEACAM1 in primary cancer tissues was analyzed by immunohistochemical staining. Additionally, the expression patterns of CEACAM1-L/S isoform were verified by reverse transcription-polymerase chain reaction (RT-PCR).
Materials and Methods
Patients and samples
A total of 113 serum samples were incorporated in this research, including samples that were obtained from 26 upper (25 gastric cancer and 1 duodenal carcinoma, average age: 65 years, range: 30–84 years) and 27 lower (21 colon cancer and 6 rectal cancer, average age: 59 years, range: 28–84 years) gastrointestinal cancer patients. Patients with disease outside the gastrointestinal tract were excluded. About 26 patients with benign gastrointestinal disease and 34 samples collected from sex- and age-matched healthy volunteers were included as controls. Informed consent was collected from all patients who participated in the study which was conducted with the approval of the Ethics Committee of the Scientific and Ethical Committee of Shanghai Jiao Tong University in accordance with the Helsinki Declaration of 1975 (as revised in 1983). Patients received no chemotherapy or radiation therapy before sample collection. The serum was collected, divided into aliquots and frozen at −80°C until analysis. Tissue samples were also collected in parallel from the same cancer patients mentioned above. During surgery, both a cancer section and an adjacent normal mucosa section were collected following pathological confirmation. Tissues were flash frozen in liquid nitrogen.
Enzyme-linked immunosorbent assay
Serum CEACAM1 were measured by commercial enzyme-linked immunosorbent assay (ELISA) kits (RayBiotech, Atlanta, USA) according to the manufacturer's instructions as previously described [31,32]. The anti-human CEACAM1 antibody recognizes the extracellular domain (a.a. 35–428) of human CEACAM1 (accession number P13688).
Immunohistochemistry staining
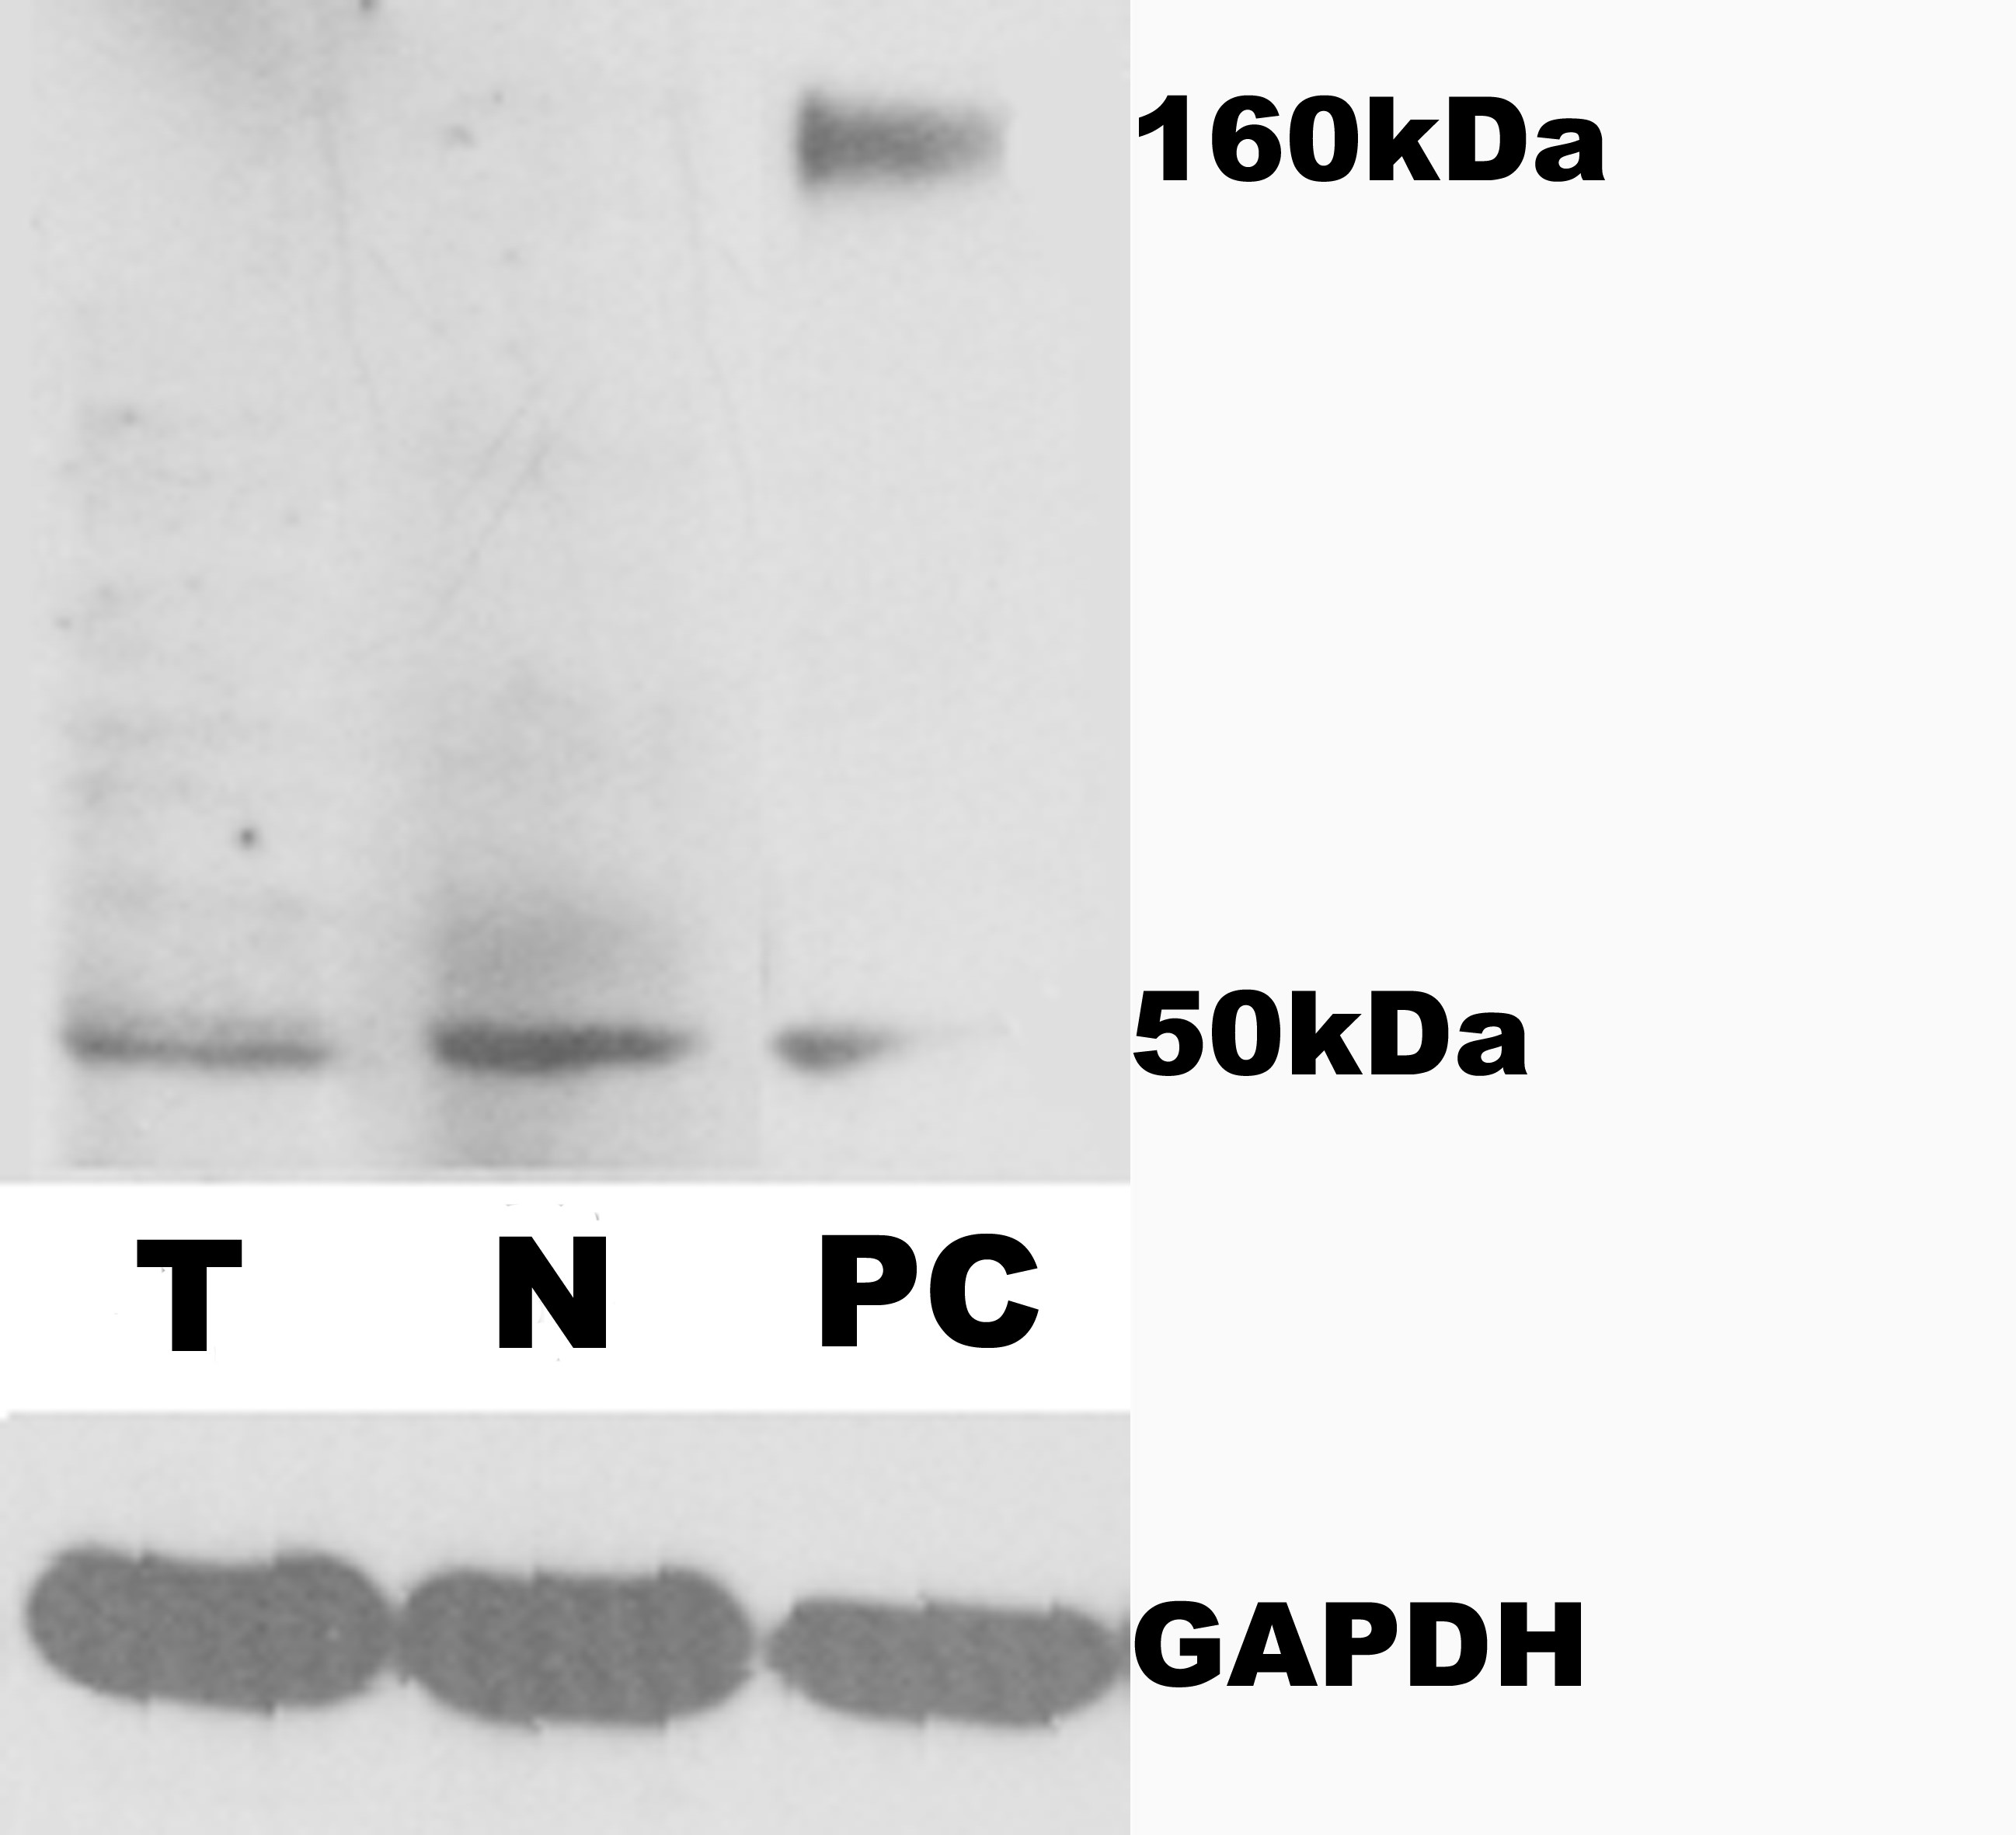
To determine the expression and localization of CEACAM1, immunohistochemistry was performed on paraffin-embedded specimens with mouse monoclonal anti-CEACAM1 antibody (clone 29H2, dilution: 1:75; Abcam, Cambridge, UK) as previously described [31,33]. The specificity of anti-CEACAM1 antibody was tested by western blot analysis (Supplementary Fig. S1). Briefly, sections were dewaxed, and endogenous peroxidase was blocked by incubation in a hydrogen peroxide solution (3%) for 10 min, followed by antigen retrieval. After being washed 3 times in phosphate-buffered saline (PBS, pH 7.4) for 5 min, the sections were incubated with primary antibodies in a humidity chamber overnight at 4°C. Thereafter, the sections were rinsed with PBS and incubated with the biotinylated secondary antibody (DAKO, Glostrup, Denmark) in a humidified chamber for 40 min at 37°C. After being washed, the streptavidin-peroxidase complex reagent (StrepABComplex/HRP Duet, DAKO, Glostrup, Denmark) was added and incubated for 45 min at room temperature. Finally, the sections were incubated with 3-amino-9-ethylcarbozole solution for 15 min, and then immersed in running tap water, counterstained with haematoxylin for 1 min, rinsed with tap water, and then immersed in a series of alcohol baths with increasing concentrations. Finally, slides were covered with coverslips and examined under a microscope. The primary antibody was omited for negative controls.
Reverse transcription-polymerase chain reaction
The RT-PCR primers (F: 5′-GGTTGCTCTGATAGCAGTAG-3′ and R: 5′-AGCCTGGAGATGCCTATTAG-3′), as reported by Wang et al. [34] and Gaur et al. [35], were designed to distinguish the 408-bp (CEACAM1-L) and 355-bp (CEACAM1-S) CEACAM1 isoforms simultaneously. ‘GAPDH’ was used as an internal control for each sample (F: 5′-GGGAAGGTGAAGGTCGGAGTC-3′ and R: 5′-AGGGGCCATCCACAGTCTTCT-3′). The PCR was performed using the PrimeScript™ RT reagent Kit (Takara Bio Inc., Shiga, Japan) following the manufacturer's protocol as described previously [31]. After pre-denaturation at 94°C for 5 min, the main operation system was 30 cycles of 94°C for 1 min, 60°C for 30 s, and 72°C for 30 s. The final products were subject to 2% agarose gel electrophoresis.
Statistical analysis
The results are expressed as the median and range because most of the data were not normally distributed. Mann–Whitney and Kruskal–Wallis tests were employed to determine the significance of two independent groups and various groups, respectively. Nonparametric receiver operating characteristic (ROC) curves was used to evaluate the diagnostic accuracy of serum CEACAM1. CEACAM1-L and CEACAM1-S levels were represented as integral optical density (IOD) values with Image Pro Plus V6.0 for Windows (Media Cybernetics, Inc., Rockville, USA). Briefly, after intensity rectification, IODs were obtained as the ratio of the sum optical density (OD) to the sum area, which is proportional to the quantity of RNA. Statistical significance was set at P < 0.05, and all reported P values were 2-sided. All analyses were performed with SPSS v.16 for Windows (SPSS Inc., Chicago, USA) or SigmaPlot V. 12 for Windows (Systat Software Inc., San Jose, USA).
Results
Serum CEACAM1 is up-regulated in cancer patients
The clinical and pathological characteristics of the patients are shown in Table 1. The median serum CEACAM1 levels from patients with cancer and benign disease were significantly higher than those from healthy controls (P < 0.05; Fig. 1). However, no significant differences in CEACAM1 levels were found between cancer patients and those with benign disease (P > 0.05; Fig. 1).
Relationship between CEACAM1 serum expression and clinical parameters
| Classification | No. | Gastrointestinal cancer | ||
|---|---|---|---|---|
| Median (P50) | Range | P | ||
| Age | ||||
| <60 | 18 | 556.14 | 492.18–631.79 | 0.107 |
| ≥60 | 35 | 473.99 | 438.30–545.86 | |
| Gender | ||||
| Male | 31 | 485.58 | 453.97–570.04 | 0.685 |
| Female | 22 | 501.63 | 454.57–587.83 | |
| Lymph node involvement | ||||
| pN0 | 21 | 522.96 | 470.33–621.52 | 0.296 |
| pN1-pN3 | 32 | 477.15 | 444.13–548.00 | |
| Tumor extension | ||||
| pT1-pT2 | 19 | 586.49 | 492.76–658.34 | 0.038* |
| pT3-pT4 | 34 | 460.96 | 435.80–529.08 | |
| Staginga | ||||
| Early | 28 | 490.35 | 454.55–581.72 | 0.986 |
| Advanced | 25 | 478.20 | 453.66–572.81 | |
| Lymphatic invasion | ||||
| Negative | 13 | 551.20 | 475.32–704.90 | 0.044* |
| Positive | 40 | 477.15 | 448.89–534.47 | |
| Vascular invasion | ||||
| Negative | 39 | 522.96 | 472.18–578.48 | 0.474 |
| Positive | 14 | 460.96 | 419.25–559.43 | |
| Perineural invasion | ||||
| Negative | 10 | 568.85 | 463.59–665.21 | 0.165 |
| Positive | 43 | 478.20 | 456.60–552.45 | |
*P < 0.05.
a7th edition of the TNM classification of gastrointestinal cancer from the American Joint Committee on Cancer (AJCC).
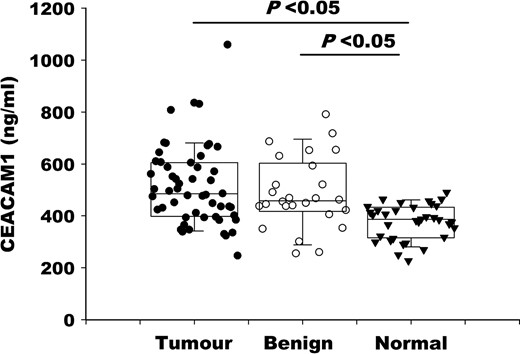
Individual CEACAM1 serum levels in patients with gastrointestinal cancer (tumor), benign gastrointestinal disease (benign) and healthy controls (normal)
To identify whether serum CEACAM1 levels were associated with clinical and pathological parameters, the Mann–Whitney test was performed (Table 1). Among the cancer patients, the serum levels of CEACAM1 did not simply elevate with tumor progression; however, this level was increased more significantly in early than in advanced disease stages. Notably, the difference reached the level of significance when cancer patients were categorized by tumor extension and lymphatic invasion (P < 0.05). This dramatic elevation of CEACAM1 during the early period of cancer development highlights the potential use of serum CEACAM1 as an early tumor screening marker.
In multivariable logistic regression analysis, the CEACAM1 levels could be used to predict cancer versus healthy controls after being adjusted for age and gender effects. According to the odds ratio (OR) value, the CEACAM1 level is better for lower gastrointestinal cancer than for upper gastrointestinal cancer (Table 2). The diagnostic value of serum CEACAM1 was also analyzed by nonparametric ROC curve. Because the serum levels of CEACAM1 in benign disease patients were also increased, it is not surprising that the diagnostic value of CEACAM1 in distinguishing cancer patients from healthy controls was better than that in distinguishing benign disease patients from healthy controls according to the AUC values which were 0.80 (95% CI: 0.71–0.89; P < 0.001) and 0.69 (95% CI: 0.60–0.78; P < 0.001), respectively (Fig. 2A,B). The AUC value for serum CEACAM1 to distinguish lower gastrointestinal cancer patients from healthy controls reached 0.85 (95% CI: 0.75–0.96; P < 0.001) which was higher than that (0.74; 95% CI: 0.61–0.87; P < 0.001) observed for the upper gastrointestinal cancer group (Fig. 2C,D). Based on the cut-off value calculated according to the Youden index, other indicators of diagnostic accuracy are summarized in Fig. 2E. The use of serum CEACAM1 to distinguish lower gastrointestinal cancer patients from healthy controls and other groups has the highest indicator value, including AUC, sensitivity, positive predictive value, and positive likelihood ratio. In addition, the relatively low sensitivity and high specificity of CEACAM1 indicated that serum CEACAM1 may better be used in combination with other markers.
Logistic regression analyses to predict gastrointestinal cancer patients versus healthy controls
| Groups | P | OR | 95% CI OR |
|---|---|---|---|
| Gastrointestinal cancer | <0.0001* | 1.013 | 1.006–1.020 |
| Upper | 0.028 | 1.010 | 1.001–1.019 |
| Lower | 0.002* | 1.023 | 1.008–1.038 |
| Groups | P | OR | 95% CI OR |
|---|---|---|---|
| Gastrointestinal cancer | <0.0001* | 1.013 | 1.006–1.020 |
| Upper | 0.028 | 1.010 | 1.001–1.019 |
| Lower | 0.002* | 1.023 | 1.008–1.038 |
*P < 0.05.
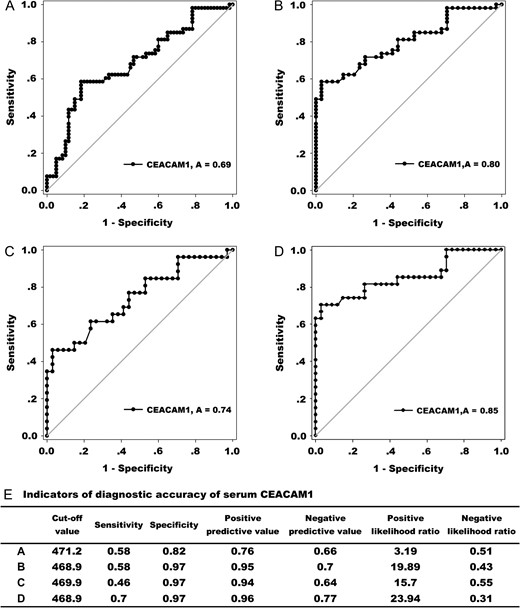
The diagnostic value of serum CEACAM1 (A) ROC curves comparing gastrointestinal cancer patients to benign disease patients and healthy controls (AUC = 0.69). (B) ROC curves comparing gastrointestinal cancer patients to healthy controls (AUC = 0.80). (C) ROC curves comparing upper gastrointestinal cancer patients to healthy controls (AUC = 0.74). (D) ROC curves comparing lower gastrointestinal cancer patients to healthy controls (AUC = 0.85). (E) Indicators of diagnostic accuracy of serum CEACAM1 (ng/ml). The data of A, B, C, and D correspond to panels A, B, C, and D mentioned above, respectively.
CEACAM1 is in secreted form and more intense at the invasive front in cancer tissues
Notable changes in CEACAM1 expression were found in cancer tissues compared to adjacent normal tissues. Our immunohistochemical study revealed little to no CEACAM1 expression in normal tissues adjacent to the cancer (Fig. 3A,C). However, in cancer tissue, CEACAM1 protein was detected mostly in secreted form within neoplastic glands (Fig. 3B,D). Furthermore, in cancer tissues, CEACAM1 expression was more intense at the invasive front than the luminal surface in some cases (Fig. 3D), suggesting that CEACAM1 expression may be involved in tumor invasion, which is in accordance with previous report [12] and our serum data showing the association between CEACAM1 levels and tumor extension (Table 1).
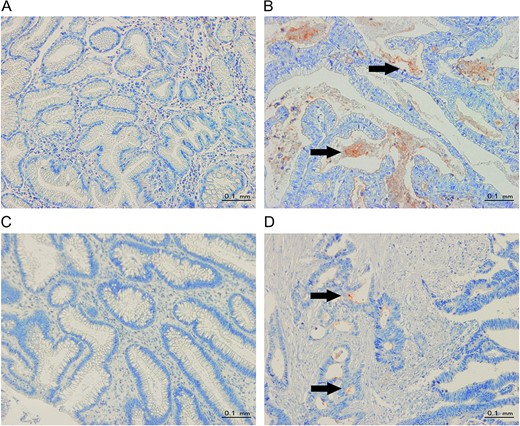
Representative images of CEACAM1 staining (A) Little to no CEACAM1 staining in upper normal gastrointestinal tissues. (B) CEACAM1 staining mainly in secreted forms (from upper gastrointestinal cancer tissues). (C) Little to no CEACAM1 staining in lower normal gastrointestinal tissues. (D) CEACAM1 staining is more intense at the invasion front than at the luminal surface (from lower gastrointestinal cancer tissues). The arrows indicate positive staining for CEACAM1 (red color, 200 × microscopic field).
CEACAM1-L/CEACAM1-S (L:S) ratios are up-regulated during tumorigenesis
To determine whether the expression patterns of CEACAM1-L and CEACAM1-S were altered in primary gastrointestinal cancer, 28 pairs of primary cancer and normal tissue samples (11 upper and 17 lower) were analyzed using the same PCR primers reported by Gaur et al. [35] and Wang et al. [34]. Figure 4 shows the representative RT-PCR data. The forward primer is located in exon 6, and the reverse primer is located within the 3′ untranslated region. Thus, the primers could amplify a 408 bp fragment (CEACAM1-L) or a 355 bp fragment (CEACAM1-S) simultaneously based on the inclusion or exclusion of exon 7. As shown in Table 3, the CEACAM1-L/CEACAM1-S (L:S) ratios were significantly higher in cancer tissues than in adjacent normal tissues (P < 0.05). The radical down-regulation of CEACAM1-S in malignant tissues was mainly responsible for this result, with the expression of CEACAM1-L basically unchanged (Table 3). These findings demonstrate that the CEACAM1-L/S isoform ratios are up-regulated during tumorigenesis and raise the possibility that the role of CEACAM1 in gastrointestinal cancer may depend on which isoform is dominant.
CEACAM1-L and S isoforms expression patterns in gastrointestinal cancer
| CEACAM1 mRNA | |||
|---|---|---|---|
| Median | 95% CI | P | |
| Cancer L-form(IOD) | 18.04 | 14.52–23.14 | 0.323 |
| Normal L-form(IOD) | 17.23 | 12.94–33.53 | |
| Cancer S-form(IOD) | 21.51 | 19.80–36.54 | 0.034* |
| Normal S-form(IOD) | 33.46 | 29.5–62.07 | |
| Cancer (L:S) ratio | 0.79 | 0.50–0.84 | 0.014* |
| Normal (L:S) ratio | 0.55 | 0.38–0.59 | |
*P < 0.05.
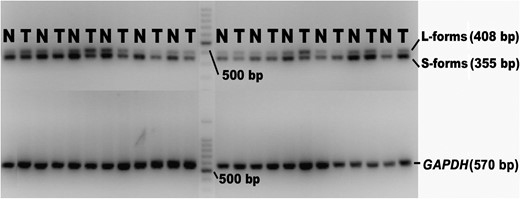
Representative RT-PCR data for the CEACAM1-L-form and S-form in gastrointestinal cancer tissues T = cancer tissues, N = adjacent normal tissues.
Discussion
In this study, we first aimed to determine whether CEACAM1 could discriminate gastrointestinal cancer patients from healthy controls at the protein level. By ELISA analysis, we demonstrated that the serum protein level of CEACAM1 was associated with an increased risk of gastrointestinal cancer (Fig. 1), which was in accordance with previous observations of CEACAM1 expression in breast cancer [32], lung cancer [31], and prostate cancer [3]. In addition, the AUC for CEACAM1 in ROC analysis remarkably exceeded 0.5 (Fig. 2) in gastrointestinal cancer compared either to healthy controls or to mixed participants (benign disease and healthy groups), with the latter situation more accurately representing clinical practice. Moreover, the CEACAM1 expression in early stage disease was much higher than that in the advanced stages (Table 1), suggesting that CEACAM1 levels increase at an early stage and thus may serve as screening indictor for cancer. However, it should be noted that because easy-to-diagnose patients were enrolled, as in most phase I studies, our results may overestimate the accuracy of this marker [30]. Additionally, we designed our sample size according to our goal of determining whether serum CEACAM1 has any ability to discriminate cancer from non-cancer patients. As a result, future larger prospective studies are needed to validate the prognostic value of serum CEACAM1.
Second, we also explored the source and biological function of soluble CEACAM1. According to previous studies, besides naturally occurring differential splicing and proteolytic processing [36], circulating CEACAM1 can be produced by tumor cells and endothelial cells through secretion or cleavage of membrane-bound CEACAM1 [37]. Our immunohistochemical results (Fig. 3B,D) showed that CEACAM1 is in secreted form within cancer tissues, which is consistent with previous reports [8,9,11]. Furthermore, CEACAM1 showed higher intensity at the invasion front of cancer tissues (Fig. 3D), which is in accordance with the previous study [12]. In addition, the transformation of CEACAM1 from the luminal surface to the invasion front could partly explain the relative decrease in serum CEACAM1 observed in patients with advanced stages of cancer (Table 1).
Huang YH and colleagues [38] found that by forming a heterodimeric interaction in ‘cis’ or ‘trans’, CEACAM1 serves as a heterophilic ligand for TIM-3. Indeed, co-blockade of CEACAM1 and TIM-3 leads to enhanced anti-tumor immune responses in mouse colorectal cancer models. Because circulating CEACAM1 was reported to act as a blocking antibody to modulate or block the signal transmitted through membrane-anchored CEACAM1 [39], it is reasonable to speculate that the interaction between CEACAM1 and immune cells may explain how circulating CEACAM1 is involved in cancer progression. We suspect that similar mechanisms are involved in gastrointestinal carcinoma. The L:S ratio of CEACAM1 in cancer was higher than that in adjacent normal tissues, and decreased expression of CEACAM1-S was mainly responsible for this phenomenon (Table 3 and Fig. 4). Previous studies have also demonstrated that the CEACAM1-S isoform may possess co-stimulatory functions, through either homophilic and heterophilic interactions, or changes between dimeric and monomeric states [40,41]. Therefore, these isoforms are capable of modifying the inhibitory signals provided by CEACAM1-L when expressed together [28,38,42–44]. The equilibrium of the CEACAM1-L/CEACAM1-S (L:S) ratio in our study undoubtedly affected cellular responses to CEACAM1 downstream signaling molecules such as SHP1 binding and SRC-family kinases. Together, our results indicate that an up-regulated CEACAM1-L/CEACAM1-S (L:S) ratio is associated with tumorigenesis in gastrointestinal cancer.
In summary, our data demonstrated that CEACAM1 protein levels were up-regulated in the serum of gastrointestinal cancer patients. Moreover, CEACAM1-S mRNA levels were decreased in cancer tissues, while the levels of CEACAM1-L remained generally unchanged, suggesting that the general CEACAM1 expression level is linked to oncogenesis. Moreover, our immunohistochemistry results showed that CEACAM1 was altered in location and expressed along with tumor development and progression, indicating the involvement of CEACAM1 in tumor invasion and metastasis. This result is consistent with previous reports [8,10–12]. Although the exact mechanisms remain to be elucidated in more detail, our investigations provide further evidence for the complexity of the role played by CEACAM1 in cancer.
In conclusion, our study strongly suggests the potential use of serum CEACAM1 as an indicator for cancer diagnosis. However, the involvement of CEACAM1 in cancer is complex, and further studies are required to better understand the mechanisms that underlie our observations, which will help to develop diagnostic and therapeutic strategies targeting CEACAM1.
Supplementary Data
Supplementary data is available at Acta Biochimica et Biophysica Sinica online.
Funding
This work was supported by the Yuyan Program of Shanghai Jiao Tong University Affiliated Sixth People's Hospital (No. LYZY-0080).
References
Author notes
These authors contributed equally to this work.
