


Abstract
Experimental studies have shown that just 1 night of sleep loss impairs next-day performance, mood, and energy. Yet, little is known about the effects of consecutive sleep loss on daily well-being in participants’ own settings.
This study examined whether and how naturally occurring consecutive sleep loss is associated with day-to-day trajectories of affective and physical well-being.
Participants were adults (N = 1,958) from the Midlife in the United States Study who provided daily diary data for eight consecutive days. Consecutive sleep loss was operationalized as the within-person number of consecutive nights with <6 hr of sleep. Multilevel models evaluated the linear, quadratic, and cubic effects of consecutive sleep loss on daily well-being, after controlling for sociodemographic, health, and daily covariates.
Daily negative affect increased and positive affect decreased in curvilinear fashion as the number of consecutive sleep loss increased. For example, daily negative affect increased (linear), but the rate of increase decelerated as the number of consecutive sleep loss increased (quadratic). Results were consistent for the number and severity of physical symptoms. For negative affect and the severity of physical symptoms, cubic effect was also significant such that the rate of increase accelerated again in the days most distal to baseline (no sleep loss).
Consecutive sleep loss was associated with degraded trajectories of daily affective and physical well-being. Making efforts to break the vicious cycle of sleep loss may protect daily well-being in adults whose sleep time is often compromised.
Introduction
Habitual sleep loss, defined as having less than the recommended minimum of 6 hr of sleep per night [1, 2], is negatively associated with psychological well-being, cognitive plasticity, and mental and physical health [3–6]. However, sleep loss is common among U.S. adults with approximately one-third reporting sleeping less than 6 hr per night [7, 8]. Experimental studies show the causal effect of total sleep deprivation (e.g., no sleep for 1 night) on next-day performance [9–11]. Yet, we know little about whether and how naturally occurring consecutive sleep loss is associated with day-to-day trajectories of well-being in adults.
Sleep loss negatively impacts daily well-being. For example, daily diary studies show that shorter sleep duration than the person’s own average in middle-aged adults is associated with higher negative affect, lower positive affect, more psychosocial stressors, more cognitive interference (e.g., ruminative thoughts), and lower mindfulness the following day [12–15]. In a study using smartphone-accelerometer-measured sleep duration, shorter sleep duration in college students is associated with worse daily mood and lower perceived energy [16]. Shorter actigraphy-measured sleep duration is also associated with higher next-morning pain intensity in youth with musculoskeletal pain [17]. These studies show that sleep loss has negative associations with daily affective and physical well-being.
The literature, however, does not portray a comprehensive picture to understand the effects of consecutive sleep loss on daily affective and physical well-being. In the literature, the term “sleep debt” has been widely used to describe the effects of cumulative sleep loss [18, 19]. Sleep debt refers to the increased pressure for sleep and is often assessed by increases in the propensity for sleep (e.g., sleep latency tests), increases in subjective sleepiness, or weekend/non-workday catchup sleep [8, 20, 21]. Another related concept, additional wakefulness, has been studied by manipulating nocturnal sleep periods and not allowing any other sleep [22]. Additional wakefulness is typically operationalized as the sum of consecutive hours of wakefulness over multiple days of sleep manipulation. While both concepts are concerned about the effects of sleep loss by capturing each specific aspect (i.e., increased sleep pressure or consecutive wakefulness), the current study focuses on the number of consecutive sleep loss nights that may occur in everyday life. This approach has been rarely done in prior research but may be important in terms of daily well-being.
Evidence from experimental studies suggest that consecutive sleep loss may have cumulative costs on daily well-being. For example, in a randomized experiment with different sleep dose conditions (e.g., 0-, 4-, 6-, or 8-hr time in bed) [22], being randomized to 6 or 4 hr of time in bed for 14 consecutive days results in cumulative, dose-response deficits in cognitive performance that are similar to those observed after 2 nights without sleep. Results of this study motivate to examine whether and how naturally occurring consecutive sleep loss within an individual may impact his/her trajectories of daily well-being. Such a within-person approach has advantages in understanding the effects of consecutive sleep loss on changes in daily well-being, because it allows to have each individual data as their own control (i.e., baseline well-being on days following no sleep loss) and rule out potential between-person differences. An additional advantage is that the association between consecutive sleep loss and daily well-being may have ecological validity [23]. While there may be individual differences in the amount of needed sleep, this study uses the criterion of a minimum sleep duration suggested as inappropriate for most adults by several sleep expert panels. According to the consensus statements by the American Academy of Sleep Medicine, Sleep Research Society, and National Sleep Foundation, sleep duration that is less than 6 hr per night is inappropriate to support optimal functioning and health for an average adult [1, 8, 24]. Specifically, the sleep time recommendations for general adult populations (26–64 years of age) are divided into three categories: recommended (7–9 hr), may be appropriate for some adults (6 hr or 10 hr), and not appropriate for anyone (less than 6 hr or more than 10 hr) [2]. Following these criteria, this study operationalizes <6 hr of sleep as sleep loss. The number of consecutive nights of <6 hr of sleep may represent consecutive sleep loss. As chronic sleep loss can lead to allostatic load or wear and tear of the body system [25], an increasing number of consecutive sleep loss may be associated with degraded trajectories of daily well-being.
Although there is a lack of studies specifically testing how consecutive sleep loss is associated with daily well-being, there is evidence that more nights with sleep loss predict adverse well-being. In a diary study that asked participants to sleep 2 hr less than their usual for three nights, this mild sleep loss predicts linear decreases in positive affect and cognitive performance and a linear increase in impulsivity [26]. Laboratory-based partial sleep deprivation (4 hr of sleep for 12 consecutive days) is also associated with 15% decrease in daily affect and 3% increase in bodily discomfort across days of the partial sleep deprivation [27]. Previous studies have mostly focused on linear changes in daily well-being, yet changes in daily well-being by consecutive sleep loss may be curvilinear. Specifically, having more nights of consecutive sleep loss may be associated with degraded trajectories of daily well-being due to no opportunity to fully recover to baseline. However, it is also possible that response to sleep loss may become blunted as sleep loss is repeated over time [28]. These conflictual scenarios suggest the need to explore potential curvilinear patters of change in daily well-being as a function of consecutive sleep loss. A related example can be found in stress pileup [29, 30], where individuals may exhibit a significant increase in stress response following the first stressor (i.e., reactivity), followed by a decrease in stress response when the stressor is gone (i.e., recovery) and a prolonged response when stressors are repeated (i.e., pileup). In the context of this study, daily well-being may decrease, and the rate of decrease may be decelerated as sleep loss occurs more consecutive times. Furthermore, if sleep loss becomes chronic (e.g., it occurs during a whole week), daily well-being may be even more degraded in line with the stress pileup and allostatic load literature [25, 29–31]. Examining both the direction and rate of change are important, because continuously degraded well-being, such as lingering negative affect, predicts future adverse health outcomes [32].
The present study examined the trajectories of daily affective and physical well-being in relations to naturally occurring consecutive sleep loss. To better understand daily impact of consecutive sleep loss by specific aspects of well-being, four measures of daily well-being (i.e., negative affect, positive affect, and the number and severity of physical symptoms) were assessed. It was hypothesized that daily negative affect would increase (H1), positive affect would decrease (H2), the number of physical symptoms would increase (H3), and the severity of physical symptoms would increase (H4) in curvilinear patterns (e.g., linear, quadratic, cubic) as the number of consecutive sleep loss increased. These hypotheses were tested after controlling for sociodemographic, health, and daily covariates.
Method
Participants and Procedure
Data for the current study were drawn from the Midlife in the United States Survey (MIDUS). Comprehensive details of the design and sample can be found in previous research [33]. During MIDUS II phase (2004–2006), 5,555 individuals participated in the main survey (including n = 592 Milwaukee African American sub-sample) and 2,022 individuals were invited to participate in the National Study of Daily Experiences (NSDE) II, an 8-day daily diary. Those who responded to both the main survey and daily diary (n = 2,022) were older, more likely to be female and white, more educated, and healthier than those who responded only to the main survey (n = 3,533). These characteristics reflect positive selection often observed in a sample collected from longitudinal methods [34]. Of the 2,022 individuals, four individuals did not provide education covariate data and 60 individuals did not provide at least four diary phone interviews. After excluding them, 1,958 individuals were the final analytic sample of this study. This sample size was much larger than the minimum sample size of 50 required for multilevel modeling to avoid biased level-2 standard errors [35]. Eighty-nine percent of the sample provided 7 to 8 valid diary days (Mdays = 7.55, SD = 0.84).
The larger MIDUS study protocol was approved by the University of Wisconsin-Madison Institutional Review Board (IRB). Written informed consent was received for all MIDUS participants. The current study was exempt from an IRB review because it used secondary, de-identifiable data.
Measures
During each end-of-day interview in NSDE, participants responded to a series of questions related to previous night’s sleep time (to construct consecutive sleep loss) and daily well-being. To assess daily affective well-being, two specific measures on daily positive and negative affect were selected. To assess daily physical well-being, two specific measures on the number and severity of physical symptoms were selected.
Consecutive sleep loss.
Participants reported previous night’s sleep time, answering, “How much time did you spend sleeping last night?” Responses were coded as hours and minutes and daily sleep duration was calculated as decimal hours (e.g., 7 hr and 30 min to 7.5 hr). Figure 1 shows an example of data structure that depicts within-person consecutive sleep loss. Several data management steps were taken. First, daily sleep hours were converted to a binary variable (sleep loss or <6 hr of sleep = 1 vs. baseline or ≥6 hr of sleep = 0). Second, a one-day lag of this binary variable was created to gauge whether sleep loss occurred on prior day (d-1) or not. Third, where day d had sleep loss and day d-1 did not have sleep loss, the number of consecutive sleep loss variable was set to 1 and subsequent days with sleep loss were successively numbered. For example, as shown in Fig. 1, ID_1 had sleep loss on days 2, 4, 5, and 6; thus, consecutive sleep loss was observed on days 4–6. When sleep hours were missing on a day, consecutive sleep loss variable was coded as missing on that day. If the following day (after the day with missing data) had sleep loss, the day was coded as the first day of consecutive sleep loss (e.g., ID_3, Day 3 in Fig. 1).
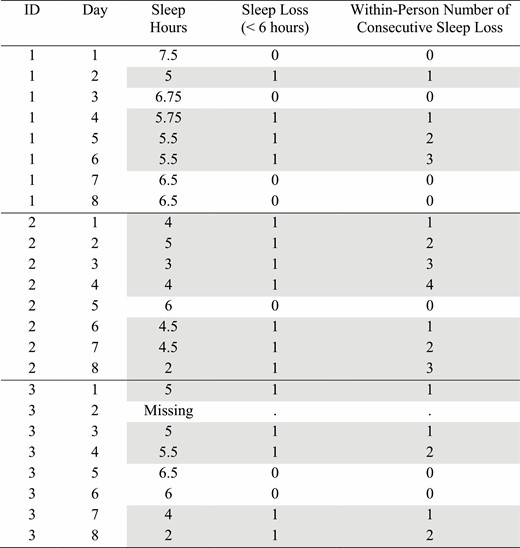
Example of data structure that depicts within-person consecutive sleep loss. Note. Hypothetical data to show how consecutive sleep loss was constructed. Sleep loss nights (sleep duration <6 hr/night) are gray highlighted.
Daily affective well-being
Each day, participants rated (0 = none of the time, 4 = all of the time) their negative affect (restless or fidgety, nervous, worthless, so sad nothing could cheer you up, everything was an effort, hopeless, lonely, afraid, jittery, irritable, ashamed, upset, angry, frustrated) and positive affect (in good spirits, cheerful, extremely happy, calm and peaceful, satisfied, full of life, close to others, like you belong, enthusiastic, attentive, proud, active, confident). The average rating across all 14 negative affect items was used as the negative affect score. Similarly, the average rating across all 13 positive affect items was used as the positive affect score. These scales were assessed separately based on the Watson and colleagues’ theory that negative affect and positive affect represent distinct dimensions [36]. Cronbach’s alphas were adequate for negative affect (person-level α = .92; day-level α = . 86) and for positive affect (person-level α = .97; day-level α = .94).
Daily physical well-being.
Daily number of physical symptoms was measured using a modified version of Larsen and Kasimatis’s [37] physical symptom checklist [38]. Participants were asked to report the occurrence of 28 physical symptoms including upper respiratory symptoms (e.g., sore throat, runny nose), aches (e.g., headache, muscle soreness, backache), gastrointestinal symptoms (e.g., stomach problems, diarrhea), and any other symptoms not included in the list. On days when participants experienced any physical symptoms, they also reported severity of the symptoms on a scale from 1 = very mild to 10 = very severe. Daily average of physical symptom severity was used.
Covariates.
Several standard sociodemographic covariates known to be related to sleep and daily well-being [15, 39, 40] were included as covariates. They included age (in years), biological sex (0 = female, 1 = male), race (0 = non-White, 1 = White), education (1 = no school/some grade school to 12 = PhD or other professional degree), and work status (0 = non-workers, 1 = workers). Additionally, self-reported physical health (1 = poor to 5 = excellent) was used as covariates because they may influence the extent of daily well-being and sleep duration. Moreover, weekend (Saturday/Sunday vs. weekdays) was controlled to account for its effects on sleep duration and well-being in general adult populations [41]. To examine the effect of consecutive sleep loss on the next-day well-being and rule out alternative hypothesis, previous day’s level of well-being outcome as well as between-person level sleep duration were included in the models. Finally, to account for potential differences due to missing some dairy interviews, the number of missed diary days (Range = 0–4; all participants provided at least 4 diary days) was controlled for. Continuous covariates were centered at the sample means.
Statistical Analysis
This study used multilevel modeling in SAS 9.4 to take into account the clustered data structure: total 15,664 daily observations clustered within 1,958 persons [42]. The first day’s reports are missing in a lagged design, resulting in 13,706 daily observations included in the analyses. There were missingness in daily well-being outcomes; after excluding missing observations, 12,242 daily observations were used in the models for daily negative and positive affect and 12,246 daily observations were used in the model for daily number of physical symptoms. In the model for physical symptom severity, 6,776 daily observations from 1,825 participants who had any physical symptoms during the study week were used.
Each daily well-being outcome was separately modeled. Proc Mixed was used for negative affect, positive affect, physical symptom severity. Proc Glimmix with Poisson distribution was used for the number of physical symptoms given that this variable was a non-normal count variable. To ensure that the model including linear, quadratic, and cubic effects of consecutive sleep loss fits the data well, a −2 Log Likelihood test was conducted using Maximum Likelihood estimation. Across all the four daily well-being outcomes, the cubic model was the best model that significantly differed from the prior linear or quadratic models (results not shown, but available upon request).
Variances for measures were decomposed to within-person (level-1) and between-person (level-2) levels. Within-person variables were prior day’s well-being, weekend (vs. weekdays), and linear, quadratic, and cubic terms of consecutive sleep loss. Between-person variables were average sleep duration across the study week and sociodemographic and health covariates. For example, the model for daily negative affect was specified as:
Because sleep hours reported on a given day were about last night’s sleep, the day of consecutive sleep loss was d-1 in relation to daily well-being variables. Here, β0i represents person i’s intercept, which is the function of the sample mean (γ 00, intercept) and random deviations of person i’s mean from the sample mean (μ 0i). β1 represents whether the prior day’s negative affect (i.e., a 1-day lag) predicts negative affect on the following day. β2 to β4 represent main effects of interest. β2 indicates the linear effect of consecutive sleep loss, whether negative affect on day d increases following consecutive sleep loss as of day d-1. β3 indicates the quadratic effect, whether the initial linear slope deflects downward or upward. Β4 indicates the cubic effect, whether the quadratic deflection intensifies or decelerates over time. These effects were examined adjusting for weekend (β5), between-person level sleep duration (β6), as well as sociodemographic and health covariates (β7 to β13). Residual error, edi, denotes random variation of person i on the dth day from person i’s mean.
To further compare estimated means of daily well-being at each number of consecutive sleep loss, post-hoc tests were conducted by treating consecutive sleep loss as a categorical variable. To adjust for multiple statistical tests, the Benjamini–Hochberg procedure was used [43]. Using a false discovery rate of 0.20, a critical p-value was computed. Thus, associations with p ≤ .042 were considered statistically significant.
Results
Descriptive Statistics
Participants (N = 1,958; 43% men) ranged in age from 33 to 84 (M = 56.40, SD = 12.15). The majority were non-Hispanic White (83%), 11% were non-Hispanic Black or African American, 3% were Hispanic/Latina, and the rest 3% were native American, Asian, or other race. On average, participants had three or more years of college education (M = 7.28 on a 12-level scale, SD = 2.52), and “very good” physical health (M = 3.56, SD = 1.01). Sixty-two percent were workers. Mean sleep duration per night across the diary days was 7 hr and 7 min (M = 7.12, SD = 1.00, Range = 2.83–11.70). On average, 42% of the sample had at least 1 sleep loss (<6 hr) across days and the average number of their consecutive sleep loss was 0.50 (SD = 1.06). Total 588 days (5% of the total diary days, 5% of the total sample) were characterized as 2 or more consecutive sleep loss days (M = 2.96, SD = 1.38). Twenty-one percent of consecutive sleep loss days were weekends, while 28% of the total diary days were weekends.
On a 0–4 scale, mean negative affect was 0.19 (SD = 0.24) and mean positive affect was 2.74 (SD = 0.70). On average, participants reported experiencing 1.86 numbers of physical symptoms across days (SD = 1.86). Mean level of physical symptom severity was 3.53 (SD = 1.52, on a 1–10 scale). The intraclass correlation coefficient (ICC) for negative affect was .51, which indicated that 51% of the variance were due to between-person differences and the remaining 49% of the variance were due to within-person fluctuations. The ICCs for positive affect, number of physical symptoms, and physical symptom severity were .75, .53, and .60, respectively. At daily level, negative affect was negatively correlated with positive affect (r = −.49, p < .001), and positively corelated with the number of physical symptoms (r = .40, p < .001) and severity of physical symptoms (r = .19, p < .001). Positive affect was negatively correlated with the number of physical symptoms (r = −.31, p < .001) and severity of physical symptoms (r = −.12, p < .001). The number and severity of physical symptoms were positively associated with each other (r = .20, p < .001).
Associations Between Consecutive Sleep Loss and Daily Affective and Physical Well-Being
The results of analyses examining the trajectories of daily negative and positive affect associated with consecutive sleep loss are presented in Table 1. The results examining the trajectories of daily number and severity of physical symptoms associated with consecutive sleep loss are presented in Table 2. Main results are illustrated in Fig. 2.
Results of Multilevel Models Examining the Trajectories of Daily Affective Well-Being Associated with Consecutive Sleep Loss (<6 hr)
| Negative affect | Positive affect | |||||||
|---|---|---|---|---|---|---|---|---|
| B | SE | p-value | 95% CI | B | SE | p-value | 95% CI | |
| Fixed effects | ||||||||
| Intercept | 0.18 | 0.01 | <.001 | [0.15, 0.20] | 2.87 | 0.04 | <.001 | [2.79, 2.96] |
| Within-person level | ||||||||
| Prior day’s affect (negative or positive) | 0.03 | 0.01 | 0.001 | [0.01, 0.05] | 0.01 | 0.01 | 0.194 | [−0.01, 0.03] |
| Consecutive sleep loss (linear) | 0.08 | 0.01 | <.001 | [0.06, 0.10] | −0.11 | 0.02 | <.001 | [−0.15, −0.07] |
| Consecutive sleep loss2(quadratic) | −0.03 | 0.01 | <.001 | [−0.04, −0.02] | 0.03 | 0.01 | 0.009 | [0.01, 0.05] |
| Consecutive sleep loss3(cubic) | 0.002 | 0.001 | <.001 | [0.001, 0.003] | −0.002 | 0.001 | 0.060 | [−0.004, 0.0001] |
| Weekend (vs. weekdays) | −0.03 | 0.004 | <.001 | [−0.04, −0.02] | 0.04 | 0.01 | <.001 | [0.03, 0.06] |
| Between-person level | ||||||||
| Average sleep duration | 0.00 | 0.01 | 0.448 | [−0.01, 0.01] | 0.01 | 0.02 | 0.506 | [−0.02, 0.04] |
| Age | −0.003 | 0.0004 | <.001 | [−0.003, −0.002] | 0.01 | 0.001 | <.001 | [0.01, 0.01] |
| Male (vs. female) | −0.03 | 0.01 | 0.001 | [−0.05, −0.01] | 0.02 | 0.03 | 0.584 | [−0.04, 0.08] |
| White (vs. non-White) | 0.01 | 0.01 | 0.656 | [−0.02, 0.04] | −0.15 | 0.04 | <.001 | [−0.23, −0.06] |
| Education | 0.00 | 0.002 | 0.041 | [0.0002, 0.01] | −0.03 | 0.01 | <.001 | [−0.04, −0.02] |
| Workers (vs. non-workers) | 0.11 | 0.01 | <.001 | [0.09, 0.12] | −0.10 | 0.02 | <.001 | [−0.13, −0.07] |
| Physical health | −0.06 | 0.01 | <.001 | [−0.07, −0.05] | 0.21 | 0.02 | <.001 | [0.18, 0.24] |
| Number of missed diary days | 0.01 | 0.01 | 0.028 | [0.002, 0.03] | 0.00 | 0.02 | 0.791 | [−0.03, 0.04] |
| Random effects | ||||||||
| Person level variance | 0.04 | 0.002 | <.001 | 0.42 | 0.01 | <.001 | ||
| Residual variance | 0.04 | 0.001 | <.001 | 0.14 | 0.00 | <.001 | ||
Note. N = 1,958. 12,242 daily observations. The main variables of interest are grey highlighted. Significant associations (at adjusted p ≤ 0.0417) are bolded.
Results of Multilevel Models Examining the Trajectories of Daily Physical Well-Being Associated with Consecutive Sleep Loss (<6 hr)
| Number of physical symptoms | Severity of physical symptoms | |||||||
|---|---|---|---|---|---|---|---|---|
| B | SE | p-value | 95% CI | B | SE | p-value | 95% CI | |
| Fixed effects | ||||||||
| Intercept | 0.08 | 0.07 | 0.267 | [−0.06, 0.22] | 4.05 | 0.11 | <.001 | [3.84, 4.26] |
| Within-person level | ||||||||
| Prior day’s physical symptoms (number or severity) | 0.04 | 0.00 | <.001 | [0.03, 0.05] | 0.01 | 0.01 | 0.479 | [−0.02, 0.03] |
| Consecutive sleep loss (linear) | 0.17 | 0.03 | <.001 | [0.106, 0.23] | 0.32 | 0.07 | <.001 | [0.17, 0.46] |
| Consecutive sleep loss2(quadratic) | −0.04 | 0.01 | 0.003 | [−0.07, −0.02] | −0.11 | 0.04 | 0.003 | [−0.18, −0.04] |
| Consecutive sleep loss3(cubic) | 0.003 | 0.002 | 0.062 | [−0.0002, 0.01] | 0.01 | 0.004 | 0.017 | [0.002, 0.02] |
| Weekend (vs. weekdays) | −0.07 | 0.01 | <.001 | [−0.097, −0.04] | −0.06 | 0.03 | 0.040 | [−0.12, −0.003] |
| Between-person level | ||||||||
| Average sleep duration | −0.01 | 0.03 | 0.580 | [−0.06, 0.04] | −0.08 | 0.04 | 0.031 | [−0.159, −0.01] |
| Age | −0.001 | 0.002 | 0.607 | [−0.01, 0.003] | 0.003 | 0.003 | 0.423 | [−0.004, 0.01] |
| Male (vs. female) | −0.40 | 0.05 | <.001 | [−0.50, −0.30] | −0.51 | 0.08 | <.001 | [−0.66, −0.36] |
| White (vs. non-White) | 0.16 | 0.07 | 0.025 | [0.02, 0.3] | −0.45 | 0.11 | <.001 | [−0.66, −0.23] |
| Education | 0.001 | 0.01 | 0.957 | [−0.02, 0.02] | −0.04 | 0.02 | 0.007 | [-0.07, −0.01] |
| Workers (vs. non-workers) | 0.08 | 0.03 | 0.003 | [0.03, 0.13] | 0.07 | 0.06 | 0.220 | [−0.04, 0.19] |
| Physical health | −0.39 | 0.03 | <.001 | [−0.44, −0.34] | −0.38 | 0.04 | <.001 | [−0.45, −0.30] |
| Number of missed diary days | 0.02 | 0.03 | 0.502 | [−0.04, 0.08] | 0.14 | 0.05 | 0.004 | [0.05, 0.24] |
| Random effects | ||||||||
| Person level variance | 1.02 | 0.04 | <.001 | 1.84 | 0.08 | <.001 | ||
| Residual variance | 0.74 | 0.01 | <.001 | 1.08 | 0.02 | <.001 | ||
Note. N = 1,958, 1,825; 12,246, 6,776 daily observations, for number of physical symptoms and severity of physical symptoms, respectively. The main variables of interest are grey highlighted. Significant associations (at adjusted p ≤ 0.0417) are bolded.
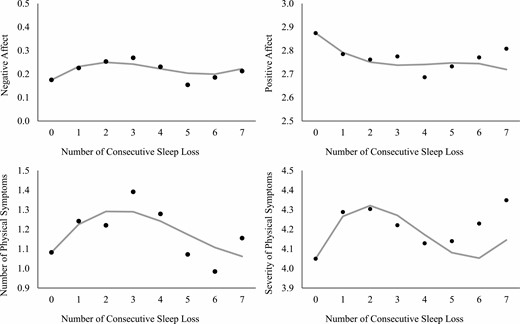
Predicted trajectories of daily affective and physical well-being by consecutive sleep loss. Note. Sleep loss represents <6 hr of sleep/night. In each panel, gray line represents an estimated trajectory of well-being based on the linear, quadratic, and cubic effects; black dots represent estimated means of well-being when consecutive sleep loss was treated as a categorical variable. Models adjusted for all covariates.
Negative affect.
Negative affect increased in a curvilinear fashion following consecutive sleep loss. The linear, quadratic, and cubic effects of consecutive sleep loss were all significant at the adjusted p ≤ .042. That is, negative affect increased (linear estimate = 0.08, SE = 0.01, p < .001), however, the rate of increase decelerated as the number of consecutive sleep loss increased (quadratic estimate = −0.03, SE = 0.01, p < .001). In the days most distal to baseline (no sleep loss), the rate of increase in negative affect accelerated again (cubic estimate = 0.002, SE = 0.001, p < .001). These associations were found after controlling for previous day’s negative affect, weekend, between-person level sleep duration, age, sex, race, education, work status, physical health, and the number of missed diary days.
Positive affect.
In a fully adjusted model, positive affect decreased in a curvilinear fashion following consecutive sleep loss. The linear effect indicated that positive affect decreased (linear estimate = −0.11, SE = 0.02, p < .001), however, the rate of decrease decelerated as the number of consecutive sleep loss increased (quadratic estimate = 0.03, SE = 0.01, p = .009). The cubic effect was not significant.
Number of physical symptoms.
The number of physical symptoms increased in a curvilinear fashion following consecutive sleep loss. The linear and quadratic effects (but not the cubic effect) of consecutive sleep loss were significant. Specifically, the number of physical symptoms increased by 18% (Exp (0.17), SE = 0.03, p < .001), however, the rate of increase decelerated as the number of consecutive sleep loss increased (quadratic estimate = −0.04, SE = 0.01, p = .003). In Fig. 2, the panel for the number of physical symptoms shows exponentiated estimates predicted by the number of consecutive sleep loss. These effects were estimated after controlling for previous day’s number of physical symptoms and all other covariates.
Severity of physical symptoms.
Consecutive sleep loss was also associated with the trajectory of severity of physical symptoms in a curvilinear fashion. The linear, quadratic, and cubic effects were all significant. Adjusting for all covariates, the severity of physical symptoms increased (linear estimate = 0.32, SE = 0.07, p < .001). However, the rate of increase decelerated as the number of consecutive sleep loss increased (quadratic estimate = −0.11, SE = 0.04, p = .003). In the days most distal to baseline, the rate of increase in the severity of physical symptoms accelerated (cubic estimate = 0.01, SE = 0.004, p = .017).
Therefore, hypotheses 1 and 2 that consecutive sleep loss would be associated with increases in negative affect and decreases in positive affect in curvilinear patterns were fully supported. Hypotheses 3 and 4 that consecutive sleep loss would be associated with increases in the number and severity of physical symptoms in curvilinear patterns were also supported.
Supplemental Analyses
Post-hoc tests compared estimated means of daily well-being at each number of consecutive sleep loss (see black dots in Fig. 2). The levels of well-being were continuously degraded after 2–7 consecutive sleep loss. Especially, negative affect and the number of physical symptoms tended to be the highest after 3 consecutive sleep loss. With respect to negative affect, while there was a significant increase after 1 sleep loss compared to the baseline (i.e., reactivity, p < .001), negative affect tended to be even more elevated than the initial reactivity when sleep loss was repeated for 3 consecutive days (p = .050), followed by a decrease after 5 consecutive sleep loss days (p = .015). Similarly, the number of physical symptoms after 3 consecutive sleep loss was significantly higher (p = .038), compared to the initial reactivity. This heightened number of physical symptoms decreased again after 5 consecutive sleep loss days (p = .015). Results on positive affect and physical symptom severity showed continuously degraded levels after 2 to 7 consecutive days of sleep loss without significant differences to the initial reactivity after 1 sleep loss.
Next, to determine whether <6 hr of sleep represents a significant sleep loss for the study participants, within-person changes in sleep duration (that deviates from the person’s own average across the study days) were examined. The mean of within-person sleep duration on days with <6 hr of sleep was −1.46 (SD = 1.43), which indicated losing approximately 1 hr and 30 min from their habitual sleep duration on average. Of 1,958 participants, only 79 (4%) were chronic short sleepers who had positive values of within-person level sleep duration on days with <6 hr of sleep.
Finally, analyses were repeated using the cutoff of ≤6 hr of sleep (instead of <6 hr of sleep). Linear, quadratic, and cubic effects of consecutive sleep loss were all significant for positive affect and the number and severity of physical symptoms. For negative affect, previously significant cubic effect became non-significant at the adjusted p ≤ .042 (Appendix 1).
Discussion
This study provides the first evidence that consecutive sleep loss predicts degraded trajectories of daily affective and physical well-being in a sample of U.S. adults. Building on the sleep literature [1, 2, 8, 24], this study conceptualized consecutive sleep loss—the within-person number of consecutive nights with <6 hr/night. As expected, consecutive sleep loss was associated with increases in negative affect, decreases in positive affect, and increases in the number and severity of physical symptoms in curvilinear patterns. Results suggest that, not only having just 1 night of sleep loss or more nights of sleep loss on average, but also having consecutive nights of sleep loss in a row has negative consequences on daily affective and physical well-being.
Prior experimental studies have shown that total sleep deprivation impairs next-day psychological well-being and cognitive performance [9–11]. Previous diary studies have also shown that sleeping less than the participant’s own average can adversely impact next-day affect, perceived stressors, mindfulness, and cognitive functioning [12–15]. The current study extends this line of work by demonstrating a novel association between naturally occurring consecutive sleep loss and the trajectories of daily affective and physical well-being. In this study, increasing number of consecutive sleep loss (that was less than the minimum recommended amount) was associated with degraded trajectories of daily affective and physical well-being within individuals, exhibiting continuously lower than their baseline levels of well-being (on days after no sleep loss).
Consecutive sleep loss may be related to continuously degraded daily well-being due to psycho-physiological load of limited recovery and accompanying wear and tear on the body systems. Sleep has important homeostatic functioning and chronic sleep loss can lead to allostatic load [25]. Sleeping <6 hr/night does not support homeostatic functioning and efficient management of the body systems [1, 8, 24]. Thus, each consecutive night of sleep <6 hr may add burden on the body and interfere with optimal functioning and well-being [31, 44]. Some research has suggested that regularity of sleep timing and daily events is important for daily well-being [45]. However, findings from this study show that such benefit of regular sleep does not apply to the matter of consecutive sleep loss.
Notably, there were linear, quadratic, and cubic relationships between consecutive sleep loss and daily negative affect and physical symptom severity. For example, as the number of consecutive sleep loss increased, daily negative affect increased, decelerated the rate of increase, and then the rate of increase accelerated again (Fig. 2). While the linear effect of partial sleep deprivation (e.g., losing 2 hr of sleep for 3 nights) on daily affect has been reported in some previous studies [26, 27], the quadratic and cubic effects are novel. The quadratic effect may mean that negative affect response to sleep loss becomes blunted as sleep loss is consecutively repeated [28]. The cubic effect, however, may mean that negative affect response becomes accelerated again because of the accumulation of incomplete recovery [25, 31]. These effects are similar to affective responses to stress pileup, such that individuals report increases in negative affect during stressor moments (i.e., reactivity), followed by decreases in negative affect following stress moments (i.e., recovery), and accumulation of stress responses over time (i.e., pileup) [29, 30].
Unlike negative affect and physical symptom severity, cubic effect was not significant for positive affect and the number of physical symptoms. However, there were significant linear and quadratic effects, such that daily positive affect and the number of physical symptoms degraded but the rate of change decelerated as the number of consecutive sleep loss increased (Fig. 2). Although the rate of change decelerated, the levels of positive affect and physical symptoms were significantly higher than baseline, maintaining similar levels to the heightened reactivity after 1 sleep loss. This means that there is no chance for recovery when consecutive sleep loss occurs, which results in cumulative costs on daily well-being. Continuously degraded well-being by consecutive sleep loss raises a concern because lingering or prolonged response may predict adverse health outcomes [31, 32].
This study rules out the possibility that the associations between consecutive sleep loss and daily well-being may be due to differences in sociodemographic and health characteristics. The daily effects of consecutive sleep loss were also independent of between-person differences in sleep duration overall. Furthermore, the models controlled for prior day’s levels of well-being and weekend, which were strong predictors of next-day well-being. All these indicate that the negative effects of consecutive sleep loss on daily well-being may exist regardless of individual and day-level characteristics.
This study has several strengths. The new measure of consecutive sleep loss allows for specific inference about how each consecutive night of sleep loss is additively associated with poorer daily well-being within individuals. Although it was found that more nights with sleep loss predicted adverse well-being [26, 27], most of the studies did not consider natural accumulation of sleep loss and its impact on day-to-day changes in well-being in participants’ own environment. Thus, the findings have ecological validity [23]. The comprehensive assessment of daily well-being with four different measures is another strength of this study. By doing so, this study reveals that consecutive sleep loss has curvilinear relationships with daily affective and physical well-being. Overall, this study advances our understanding about the risk of consecutive sleep loss for daily well-being in adulthood.
There are limitations in this study. The proportion of sleep loss was small in this study, meaning that most of the sample were healthy sleepers. Although the MIDUS data offer a rare opportunity to examine the relationship between consecutive sleep loss and daily well-being in a large sample of adults, the relatively healthy nature of the sample might have contributed to underestimating the hypothesized effects. Related to this issue, there have been significant drops in sleep duration over the last decade associated with increases in electronic device and social media use [46], which might have not captured in the MIDUS II data (collected between 2004 and 2006). Future research may need to replicate findings from this study in more recent cohort samples that may have shorter sleep duration on average. It is also important to note that the majority of the sample were white and had higher education, limiting our ability to compare results by race/ethnicity or by socioeconomic level. Given that racial/ethnic minorities and those with lower education have shorter sleep duration [47], future research needs to replicate the findings among more racially and socioeconomically diverse samples. Moreover, in NSDE II, sleep quality or sleep timing variables were not available; only sleep hour variable was available. Future studies may need to test whether the associations between consecutive sleep loss and daily well-being hold after controlling for sleep quality and/or regularity of sleep timing. Lastly, this study operationalized consecutive sleep loss based on self-reported sleep duration. Future research could operationalize this construct using objective sleep duration and test its effects on daily well-being. In MIDUS, the data collection period of actigraphy sleep study did not overlap with the data collection period of daily diary study, thus it was impossible to associate actigraphy sleep variables with daily well-being outcomes used in the current study. Assessing actigraphy sleep and daily well-being during the same study period may allow to examine whether the effect of consecutive sleep loss on daily well-being is similar or different when sleep duration is assessed by self-report or by actigraphy.
This study contributes to the literature on behavioral research by showing that consecutive sleep loss—a novel concept assessing the within-person number of consecutive <6 hr of sleep in naturalistic settings—is associated with degraded trajectories of daily affective and physical well-being in a non-clinical sample of adults. As the number of consecutive sleep loss increased, daily negative affect and physical symptoms increased, and daily positive affect decreased. The pattern of results was curvilinear, and the levels of well-being during consecutive sleep loss were continuously lower than baseline. Sleep is often not prioritized in adult daily lives, and many adults have insufficient sleep duration. A brief behavioral intervention can be effective to extend sleep duration [48, 49]. At the very least, making efforts not to have consecutive nights of sleep loss may protect daily well-being.
Acknowledgements
Since 1995 the Midlife in the United States Study has also been funded by the following. John D. and Catherine T. MacArthur Foundation Research Network National Institute on Aging (P01-AG020166) National institute on Aging (U19-AG051426).
Data and documentation for all MIDUS projects are available to other researchers at the Inter-university Consortium for Political and Social Research (ICPSR). In addition to the publicly available data at ICPSR, a MIDUS-Colectica Portal (midus.colectica.org) contains rich searchable metadata, links to helpful documentation, and the ability to download customized datasets. Analytic methods specific to the current study are available upon request from the corresponding author. The current study was not preregistered with an analysis plan in an independent, institutional registry.
Funding This study was supported by the grant from National Institute on Aging (PI: Lee, Grant No. 1R56AG065251-01A1).
Compliance with Ethical Standards
Authors’ Statement of Conflict of Interest and Adherence to Ethical Standards SL declares that she has no conflict of interest.
Authors’ Contributions SL developed the study concept, analyzed the data, and drafted the manuscript. SL provided critical revisions to the document for submission.
Ethical Approval All procedures followed were in accordance with the American Psychological Association ethical standards and with the Helsinki Declaration. The larger MIDUS study protocol was approved by the University of Wisconsin-Madison Institutional Review Board (IRB). The current study was exempt from an IRB review because it used publicly available, de-identifiable data.
Informed Consent All MIDUS study participants provided written informed consent.
Appendix 1. Results of Multilevel Models Examining the Trajectories of Daily Well-Being Associated with Consecutive Sleep Loss (≤6 hr)
| Negative affect | Positive affect | |||||||
|---|---|---|---|---|---|---|---|---|
| B | SE | p-value | 95% CI | B | SE | p-value | 95% CI | |
| Fixed effects | ||||||||
| Consecutive sleep loss (linear) | 0.04 | 0.01 | <.001 | [0.03, 0.06] | −0.07 | 0.01 | <.0001 | [−0.1, −0.05] |
| Consecutive sleep loss 2 (quadratic) | −0.01 | 0.00 | <.001 | [−0.02, −0.005] | 0.02 | 0.01 | <.0001 | [0.01, 0.03] |
| Consecutive sleep loss 3 (cubic) | 0.001 | 0.0003 | 0.049 | [0, 0.001] | −0.002 | 0.001 | 0.008 | [−0.003, −0.0004] |
| Number of physical symptoms | Severity of physical symptoms | |||||||
| B | SE | p-value | 95% CI | B | SE | p-value | 95% CI | |
| Fixed effects | ||||||||
| Consecutive sleep loss (linear) | 0.12 | 0.02 | <.001 | [0.07, 0.17] | 0.25 | 0.05 | <.001 | [0.14, 0.35] |
| Consecutive sleep loss 2 (quadratic) | −0.04 | 0.01 | <.001 | [−0.06, −0.02] | −0.09 | 0.02 | <.001 | [−0.14, −0.05] |
| Consecutive sleep loss 3 (cubic) | 0.003 | 0.001 | 0.006 | [0.001, 0.004] | 0.01 | 0.00 | <.001 | [0.004, 0.013] |
Note. N = 1,958. 12,242 daily observations were used for the models predicting negative affect and positive affect. 12,246 daily observations were used for the model predicting the number of physical symptoms. 6,776 daily observations from n = 1,825 were used for the model predicting the severity of physical symptoms. Models adjusted for previous day’s well-being outcome, weekend, between-person level sleep duration, age, sex, race, education, work status, physical health, and number of missed diary days. Significant associations (at adjusted p ≤ 0.0417) are bolded.
| Negative affect | Positive affect | |||||||
|---|---|---|---|---|---|---|---|---|
| B | SE | p-value | 95% CI | B | SE | p-value | 95% CI | |
| Fixed effects | ||||||||
| Consecutive sleep loss (linear) | 0.04 | 0.01 | <.001 | [0.03, 0.06] | −0.07 | 0.01 | <.0001 | [−0.1, −0.05] |
| Consecutive sleep loss 2 (quadratic) | −0.01 | 0.00 | <.001 | [−0.02, −0.005] | 0.02 | 0.01 | <.0001 | [0.01, 0.03] |
| Consecutive sleep loss 3 (cubic) | 0.001 | 0.0003 | 0.049 | [0, 0.001] | −0.002 | 0.001 | 0.008 | [−0.003, −0.0004] |
| Number of physical symptoms | Severity of physical symptoms | |||||||
| B | SE | p-value | 95% CI | B | SE | p-value | 95% CI | |
| Fixed effects | ||||||||
| Consecutive sleep loss (linear) | 0.12 | 0.02 | <.001 | [0.07, 0.17] | 0.25 | 0.05 | <.001 | [0.14, 0.35] |
| Consecutive sleep loss 2 (quadratic) | −0.04 | 0.01 | <.001 | [−0.06, −0.02] | −0.09 | 0.02 | <.001 | [−0.14, −0.05] |
| Consecutive sleep loss 3 (cubic) | 0.003 | 0.001 | 0.006 | [0.001, 0.004] | 0.01 | 0.00 | <.001 | [0.004, 0.013] |
Note. N = 1,958. 12,242 daily observations were used for the models predicting negative affect and positive affect. 12,246 daily observations were used for the model predicting the number of physical symptoms. 6,776 daily observations from n = 1,825 were used for the model predicting the severity of physical symptoms. Models adjusted for previous day’s well-being outcome, weekend, between-person level sleep duration, age, sex, race, education, work status, physical health, and number of missed diary days. Significant associations (at adjusted p ≤ 0.0417) are bolded.
References
