


Abstract
Blood pressure (BP) management in frail older people is challenging. An randomised controlled trial of largely non-frail older people found cardiovascular and mortality benefit with systolic (S) BP target <120 mmHg. However, all-cause mortality by attained BP in routine care in frail adults aged above 75 is unclear.
To estimate observational associations between baseline BP and mortality/cardiovascular outcomes in a primary-care population aged above 75, stratified by frailty.
Prospective observational analysis using electronic health records (clinical practice research datalink, n = 415,980). We tested BP associations with cardiovascular events and mortality using competing and Cox proportional-hazards models respectively (follow-up ≤10 years), stratified by baseline electronic frailty index (eFI: fit (non-frail), mild, moderate, severe frailty), with sensitivity analyses on co-morbidity, cardiovascular risk and BP trajectory.
Risks of cardiovascular outcomes increased with SBPs >150 mmHg. Associations with mortality varied between non-frail <85 and frail 75–84-year-olds and all above 85 years. SBPs above the 130–139-mmHg reference were associated with lower mortality risk, particularly in moderate to severe frailty or above 85 years (e.g. 75–84 years: 150–159 mmHg Hazard Ratio (HR) mortality compared to 130–139: non-frail HR = 0.94, 0.92–0.97; moderate/severe frailty HR = 0.84, 0.77–0.92). SBP <130 mmHg and Diastolic(D)BP <80 mmHg were consistently associated with excess mortality, independent of BP trajectory toward the end of life.
In representative primary-care patients aged ≥75, BP <130/80 was associated with excess mortality. Hypertension was not associated with increased mortality at ages above 85 or at ages 75–84 with moderate/severe frailty, perhaps due to complexities of co-existing morbidities. The priority given to aggressive BP reduction in frail older people requires further evaluation.
Key Points
Large prospective observational study of 415,980 people above 75 years, inclusive of those often excluded from studies.
The lowest mortality risk in adults above 75 years was at systolic BP 140–160 mmHg and diastolic of 80–90 mmHg.
There was excess mortality in adults above 75 years with systolic BP <130 mmHg irrespective of baseline frailty.
Further work is required to evaluate the safety and benefit of BP reduction in frail older people.
In adults above 75 years with moderate to severe frailty and all above 85 years, there was no increased mortality risk with hypertension.
Introduction
Management of blood pressure (BP) in older people is challenging, particularly with increasing frailty. Hypertension is the commonest chronic disease in older adults, prevalent in over 75% above 80 years [1]. Prognosis according to BP, including high BP, in older age remains uncertain [2] compared to populations aged below 70. Caution should be applied when extrapolating randomised controlled trial (RCT) results, as frail older adults are under-represented in clinical trials due to limited life expectancy, co-morbidities, polypharmacy and cognition [3].
RCTs targeting BP in older adults have drawn contrasting conclusions on BP prognosis to observational studies. BP guidelines reflect uncertainty in RCT translation to clinical practice, with BP targets for older adults ranging from ≤130/80 [4] to ≤150/90 mmHg [5] internationally. Systolic BP Intervention Trial (SPRINT) [6] found that in largely non-frail older adults eligible to participate, a tight systolic (S) BP target <120 mmHg reduced mortality and cardiovascular events compared with that of <140, albeit with higher rates of kidney injury and syncope [6,7]. However, SPRINT excluded dementia, significant frailty and nursing home residents. Observational analyses of representative older populations have shown excess mortality with low SBPs [8–10]. In our study of adults above 80 years with hypertension [9], we found SBP <135 mmHg was associated with raised mortality risk, despite increased incident cardiovascular events at SBP ≥155 mmHg. A recent meta-analysis of observational studies found no mortality difference in frail older adults with SBP <140 mmHg compared to >140 mmHg, in contrast to reduced mortality in non-frail <140 mmHg [11]. A previous analysis on SBP trajectory and frailty status postulated that raised mortality at lower SBPs could be attributed to BP decline in 48 months prior to death, demonstrating reverse causation [10]; we have previously shown pre-terminal BP declines for 14–18 years, which were particularly marked in those with hypertension, dementia, heart failure and late-life weight loss [12].
In the UK, the electronic frailty index (eFI) [13] is predominantly used for frailty screening in primary care. The eFI is a cumulative deficit model in electronic health records, derived from the Rockwood approach [14]. This tool classifies 3% of adults above 65 years as severely frail and 12% as moderately frail [13].
Overall, observational studies have shown excess mortality at SBP <130 mmHg in older adults and evidence on BP interventions in frail older people for BPs >140/90 mmHg is limited. Improved understanding of BP prognosis according to frailty could be essential in moving towards safer, personalised BP management in older adults [15,16]. Previous studies have investigated BP effect on mortality outcomes alone, without cardiovascular outcomes and with broad BP categories [11,17].
This study tested associations between baseline BP including hypertension, all-cause mortality and incident cardiovascular outcomes in a large, representative primary-care cohort aged 75 and above, stratified by eFI frailty, with up to 10 years of follow-up. Additional analyses examined the effect of end-of-life BP declines on outcomes.
Methods
Data source
Primary-care data from the clinical practice research datalink (CPRD) were analysed, matched at source to hospital episode statistics [18]. CPRD has been found to be representative for age, sex and ethnicity [18].
Ethical approval was granted by the Independent Scientific Advisory Committee for UK Medicines and Healthcare Products Regulatory Agency database research.
Study design
This prospective analysis used CPRD data between 1 January 2000 and 14 November 2014. The study start date (index date) was the point of eligibility, requiring age 75 years and at least three BP measures in the previous 3 years (Supplementary data Appendix 1). There were no further exclusion criteria, to keep the study inclusive of representative older adults and translatable to clinical practice.
Clinical measures
Blood Pressure (BP)
The median SBP and diastolic(D)BP from routine clinical BP measures over 3 years prior to index date represented the study exposure. Median was used to reduce the effect of extreme values during acute illness. The primary analysis was based on SBP due to superior prognostic value in adults above 50 years [19]. Values for SBP were assigned 10-mmHg categories to provide additional detail to previous prognosis studies while maintaining sufficient numbers (85–120 (‘<120 mmHg’), 120–129, 130–139, 140–149, 150–159, 160–169, 170–179, ≥180). The SBP reference group was 130–139 mmHg, in keeping with the majority of international guidelines for older adults [5,20,21]. DBP was divided into categories of mmHg: <80, 80–90 (reference category) and ≥90 for analysis.
Electronic frailty index (eFI)
The eFI was developed by Clegg et al. [13] according to the cumulative deficit method [14]. It assesses 36 deficits (clinical signs, symptoms, diseases, disabilities and impairments) in electronic records and categorises older adults into fit (non-frail), mild, moderate or severe frailty. The eFI at index date determined frailty category.
Covariates
Analyses were run in age categories 75–84 and ≥85 years and adjusted for sex, age at index and quintiles of the 2007 Index of Multiple Deprivation (IMD) [9,12].
Patient characteristics at baseline and prevalent and incident cardiovascular outcomes by electronic frailty status
| eFI category | |||||
|---|---|---|---|---|---|
| Total (n) | Non-frail | Mild frailty | Moderate frailty | Severe frailty | |
| Baseline eFI (%) | 415,980 | 260,159 (62.5%) | 137,772 (33.1%) | 17,032 (4.1%) | 1,017 (0.2%) |
| Mean (SD) age (years) | 79.5 (5.2) | 79.2 (4.8) | 80.0 (5.6) | 80.8 (6.2) | 80.9 (6.4) |
| Women (%) | 245,481 (59.0) | 149,371 (57.4) | 84,292 (61.1) | 11,116 (65.2) | 702 (69.0) |
| Number in most deprived quintile IMD (% in lowest quintile) | 48,525 (11.7) | 26,867 (10.3) | 18,612 (13.5) | 2,846 (16.7) | 200 (19.7) |
| Current or ex-smokers at baseline (%) | 206,640 (49.7) | 121,856 (46.8) | 74,227 (53.9) | 9,926 (58.2) | 631 (62.0) |
| Mean BMI at baseline | 26.3 | 26.1 | 26.7 | 27.1 | 27.7 |
| Mean cholesterol at baseline (mmol/L) | 5.5 | 5.6 | 5.4 | 5.1 | 5.0 |
| High cardiovascular risk (%) | 156,882 (37.7) | 95,498 (36.7) | 54,023 (39.2) | 6,925 (40.7) | 436 (42.9) |
| Median baseline systolic BP (mmHg) | 144 | 145 | 142 | 140 | 138 |
| Median baseline diastolic BP (mmHg) | 80 | 80 | 80 | 77 | 75 |
| Hypertension diagnosis at baseline (%) | 246,818 (59.3) | 143,264 (55.1) | 90,608 (65.8) | 12,177 (71.5) | 769 (75.6) |
| Prevalent myocardial infarction/procedure (%) | 27,579 (6.6) | 10,772 (4.1) | 13,619 (9.9) | 2,943 (17.3) | 245 (24.1) |
| Incident myocardial infarction/procedure (%) | 27,414 (6.6) | 15,313 (5.9) | 10,584 (7.7) | 1,444 (8.5) | 73 (7.1) |
| Prevalent heart failure (%) | 28,148 (6.8) | 7,519 (2.9) | 15,713 (11.4) | 4,501 (24.4) | 415 (40.8) |
| Incident heart failure (%) | 19,645 (4.7) | 10,879 (4.2) | 12,290 (8.9) | 1,460 (8.6) | 71 (7.0) |
| Prevalent stroke (%) | 52,320 (12.6) | 21,273 (8.2) | 25,249 (18.3) | 5,355 (31.4) | 443 (43.5) |
| Incident stroke (%) | 33,940 (8.2) | 20,875 (8.0) | 11,571 (8.4) | 1,416 (8.3) | 78 (7.7) |
| Prevalent dementia (%) | 14,647 (3.5) | 5,205 (2.0) | 7,537 (5.5) | 1,749 (10.3) | 156 (15.3) |
| Died within follow-up period (%) | 137,117 (33.0) | 74,731 (28.7) | 53,516 (38.8) | 8,302 (48.7) | 568 (55.9) |
Prevalent disease measured if date of first occurrence preceded index date. Incident disease if date of first occurrence on or after index date.
Outcomes
The primary outcome was all-cause mortality, obtained from the UK Office for National Statistics.
Secondary outcomes were incident cardiovascular events: stroke (ischaemic or intracerebral haemorrhage), myocardial infarction or cardiac revascularisation procedure (MIP) and heart failure. Diagnoses were based on ICD-10 classification for stroke and MI and quality of outcomes framework (QOF), used in UK primary care to generate databases for specific health conditions (Supplementary data Appendix 18) [22]. The coding system for surgical procedures [23] was used to capture coronary angioplasty and coronary artery bypass graft to increase the yield of clinically significant coronary artery disease.
Statistical analysis
Statistical analysis used Stata v 15.1. Participants were followed up for 10 years from index date, until death or study end date.
Associations between baseline BP and all-cause mortality were estimated using the Cox proportional-hazards models, stratified by the eFI frailty. Fine and Gray competing risk models [24] were used to estimate associations between BP and incident cardiovascular outcome (stroke, heart failure, MIP) within the category of eFI frailty, with mortality as the competing risk. Moderate to severe frailty categories were combined due to small numbers in the severe frailty category.
Sensitivity analyses
As the selection criteria were intentionally inclusive, we performed sensitivity analyses to estimate outcomes for specific groups.
A sensitivity analysis was performed adjusted by sex, IMD, age at index, cardiovascular risk and BP decline. Cardiovascular risk was estimated at index date as low (never smoker, cholesterol <5 mmol/L, body mass index (BMI) <25 kg/m2 or no recorded risk), intermediate (if one or more of: BMI 25 to <30 kg/m2, ex-smoker, cholesterol 5–6.5 mmol/L) or high (if one or more of: BMI ≥30 kg/m2, current smoker, cholesterol >6.5 mmol/L). BP decline was estimated by the difference in median SBP in the 2 years prior to index date and 3–5 years prior to index. If the difference was zero or greater than zero, it was assigned to the ‘no-decline’ BP group, while any decline was assigned to the ‘decline’ group.
Other sensitivity analyses were conducted using the 75–84 age group to provide sufficient numbers: excluding the 7,092 participants in the last 6 months of life to remove the potential effect of the terminal phase, according to prevalent hypertension, diabetes and heart failure at index date (established using QOF rules) and without prevalent cancer (based on prevalent primary-care diagnosis of cancer not isolated to skin).
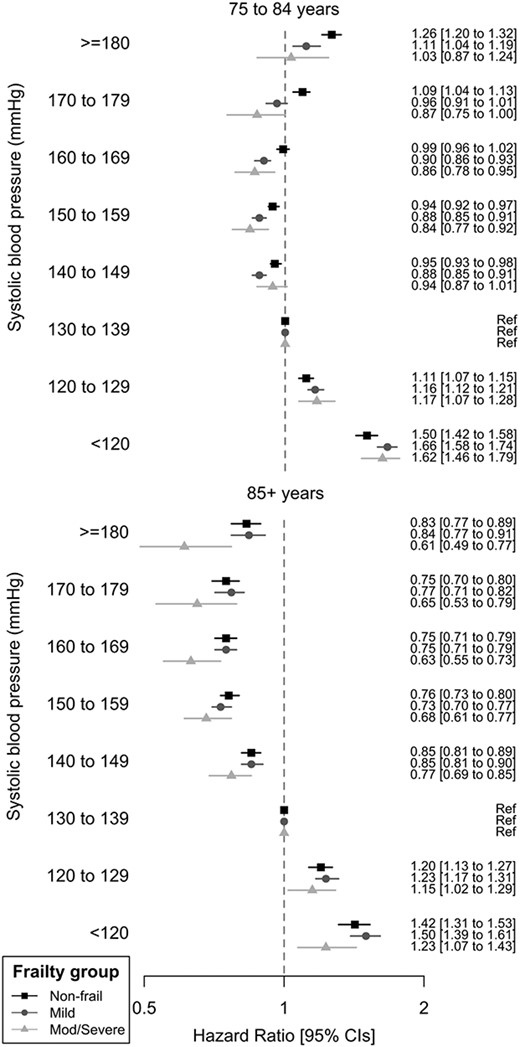
Hazard ratio of all-cause mortality by attained systolic BP, stratified by eFI frailty status. Adjusted by IMD, sex and age at index date.
Results
Analyses included 415,980 older adults, mean age 79.5 years old (range 75.0–109.5) and up to 10 years follow-up. Table 1 presents patient characteristics and outcomes by the eFI frailty. At analysis, baseline 55.1% non-frail had diagnosed hypertension compared to 75.6% severely frail. Paradoxically, the median SBP and DBP were lower with increased frailty (Table 1).
Mortality outcomes
All-cause mortality by SBP, stratified by the eFI category, is presented in Figure 1 and Supplementary data Appendix 2. The age category had a larger effect on all-cause mortality by SBP (HR 3.01 (3.01–3.08)) and DBP (HR 3.06 (3.02–3.10)) than the frailty category (SBP HR 1.55 (1.53–1.56), DBP HR 1.54 (1.54–1.57)). In adults above 85 years, there was no elevated mortality risk associated with high SBPs, even with ≥180 mmHg. Compared to 130–139 mmHg (reference category), older adults with SBPs of 140–149 (non-frail HR mortality 0.95, 0.93–0.98; mild frailty 0.88, 0.85–0.91;) or 150–159 mmHg (non-frail HR 0.94, 0.92–0.97; mild frailty 0.88, 0.85–0.91; moderate to severe frailty HR 0.84 (0.77–0.92)) had lower risk of all-cause mortality. Only those in the non-frail or mild frailty categories had excess mortality associated with high SBPs, which reached statistical significance at ≥170 mmHg in the non-frail (170–179 mmHg compared to 130–139 HR mortality 1.09, 1.04–1.13) and ≥180 mmHg with mild frailty (180–189 mmHg HR mortality 1.11 (1.04–1.19). Lower SBPs of 120–129, <120 mmHg and DBP <80 mmHg (Supplementary data Appendix 4) were associated with increased HR of mortality in all above 75 years, across frailty categories. Elevated DBP did not affect outcomes for those with established frailty aged 75–84 or those over 85, but DBP ≥90 mmHg was associated with raised mortality risk in non-frail and mildly frail adults <85 years old.
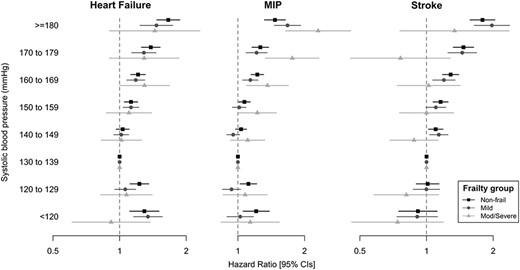
Hazard ratio of cardiovascular outcomes by attained systolic BP (mmHg) in 75–84 age group, stratified by eFI frailty status.
Cardiovascular outcomes
Associations between BP and cardiovascular outcomes showed similar trends between 75–84 and 85+ age categories (Figure 2 and Supplementary data Appendices 5–10), with increased risk associated with SBPs over 150 mmHg, which was less significant with increased frailty for heart failure and stroke.
Sensitivity analyses
Results of tested associations of SBP and outcomes by frailty status were consistent when adjusted by BP decline and cardiovascular risk (Supplementary data Appendices 3, 6, 8, 10), with and without diagnosed hypertension (Supplementary data Appendix 11), without heart failure (Supplementary data Appendix 12) and cancer (Supplementary data Appendix 13), with diabetes (Supplementary data Appendix 4), with stable or declining BP trajectory (Supplementary data Appendix 15), excluding the last 6 months of life (Supplementary data Appendix 16) and by smoking status (Supplementary data Appendix 17).
Discussion
In this large study of routine clinical data from 415,980 population-representative primary-care patients aged 75 years and above, we have shown that risks of cardiovascular outcomes increase with SBPs above 150 mmHg across categories of eFI frailty. However, this was not accompanied by raised all-cause mortality, particularly for those with established frailty or above 85 years old. Relative systolic hypertension (SBP 140–160 mmHg) was associated with the lowest all-cause mortality across all categories of frailty, with no increased mortality risk with hypertension in moderate to severe frailty. SBPs below 130 mmHg and DBPs below 80 mmHg were consistently associated with excess mortality risk, independent of SBP trajectory. This provides compelling evidence that this association is not solely an artefact of reverse causation associated with terminal BP decline.
The study was inclusive of multimorbidity, frailty, dementia and physical limitations that prevent recruitment to volunteer studies [3]. Exposure status—BP and frailty—were ascertained prior to incident outcomes, enabling a prospective analysis design. The mean follow-up was 4.46 years (up to 10 years), which is longer than existing RCTs. Clinical outcomes were from linked primary and secondary care CPRD data, which have high validity for cardiovascular outcomes [25], supported by robust national death certification mortality.
Limitations include the use of observational data, which cannot provide evidence of the causal effect of BP treatment, which would require an RCT. Ravindrarajah et al. [10] previously showed that associations between SBP and mortality were consistent whether on antihypertensive intervention or not. BP measurements were obtained under clinical conditions, which tend to result in higher BP measures, [26,27] than under controlled conditions used in RCTs. However, these represent BPs that clinicians use and may be more relevant to routine care. The study aimed to be representative of the older population, thus we had few exclusion criteria. We report a lower proportion of moderate and severe frailty than previously identified in CPRD using the eFI [15]. The most frail may be under-represented due to not achieving three BP measures in 3 years prior to index date. These data would be missing not at random: SBP declines with proximity to death may have resulted in SBP within normal range, therefore reducing necessity for monitoring or clinicians may have de-escalated monitoring due to frailty. These BP values are likely to be lower than the included measures but we cannot be sure. Sensitivity analyses investigated the effects of conditions and co-factors with potential to confound, with minimal change in results. Limited incident cardiovascular events in the absence of prevalent events led to wide confidence intervals (CI) for cardiovascular outcomes, particularly in those aged above 85.
Ravindrarajah et al. [10] previously published an analysis on BP trajectory, frailty and all-cause mortality using CPRD data. We found similar results for mortality outcomes by BP and have built on this work by analysing cardiovascular outcomes and diastolic BP, as well as by more discrete BP categories. Ravindrarajah et al. highlighted the declining trajectory in 48 months prior to death and postulated that associations between low SBP and increased mortality could be attributed to reverse causation. However, we have shown that associations between baseline BP and mortality status are consistent, independent of BP decline, for excess mortality at low SBPs and the lack of association between high SBP and mortality in above 85 years and in those with moderate to severe frailty age 75–84 years.
A recently published systematic review and meta-analysis investigated whether the association between BP and mortality varies according to frailty status [11]. It included nine studies with 21,906 participants above 65 years, with a mean follow-up of 6 years. It found that SBP <140 mmHg in non-frail individuals reduced the risk of all-cause mortality (HR 0.86, 95% CI 0.77–0.96), while in frail participants, there was no difference in mortality <140 compared to >140 mmHg (HR 1.02, 95% CI 0.90–1.16). The difference in our results for non-frail older adults may be partially explained by a lower age cut-off of 65 years in the meta-analysis: we have previously shown that adults above 80 years with diagnosed hypertension but with relatively low co-morbidity have higher mortality at lower SBPs [9]. We were able to include more frailty categories and categories of SBP, which may also account for non-frail differences. In addition, we have shown that cardiovascular outcomes are increased with elevated SBP. The review focussed on mortality and suggested more work is required on non-fatal outcomes.
BP management in frail older people requires balancing many, often competing, treatment objectives to obtain the best possible overall outcomes. The data presented confirm trial evidence from younger groups that SBPs >150 mmHg increase the risk of cardiovascular outcomes. However, the data also suggest that BP-attributable cardiovascular outcomes have limited impact on overall mortality in frail older people of 75–84 and all above 85 years. This may be due to complexities of co-existing morbidity. We have previously shown, for example, that chronic kidney disease is more strongly predictive of mortality than BP in adults above 70 years [28]. Serious non-cardiovascular conditions may be associated with lower BPs in frail groups. Our findings, therefore, imply that management of non-cardiovascular morbidities may be relatively more important for many older frail patients.
Conclusion
In a large representative sample in routine primary care, adults aged above 75 with BP <130/80 experienced higher mortality than those with SBP 130–139 mmHg and DBP 80–90. Hypertension was not associated with increased mortality at ages above 85 or 75–84 with moderate/severe frailty. The relative priority given to aggressive BP reduction in frail older people requires further evaluation.
Declaration of Conflict of Interest
None.
Declaration of Funding
J.M. is funded by a National Institute for Health Research (NIHR), Doctoral Research Fellowship DRF-2014-07-177 for this research project. This paper presents independent research funded by the National Institute for Health Research (NIHR). The views expressed are those of the authors and not necessarily those of the NHS, the NIHR or the Department of Health and Social Care.
Data access statement
CPRD data on which the analyses was based is held securely by University of Exeter Medical School under the CPRD data access licence (https://www.cprd.com/dataAccess/).

Comments
McEvoy et al.[2] reported from the ARIC trial that a diastolic pressure <60 mmHg with a pulse pressure >60 mmHg (DBP<60/PP>60) doubled subclinical myocardial ischemia, and Park and Ovbiagele [3]reported from the VISP database that such participants had a 5.85-fold increase in the risk of stroke.
Reasons for this include:
1. People with a wide pulse pressure have stiff arteries;
2. People with stiff arteries are more likely to have a large cuff artefact (i.e. the true intra-arterial pressure is much lower than the blood pressure measured by a cuff); [4]
3. Virtually all of coronary perfusion[2]* and most of cerebral perfusion[5] occurs during diastole
4. There is a large pressure gradient in the brain: when the blood pressure in the brachial artery is
117/75 mmHg, it is 113/73 mmHg in the lenticulostriate artery but only 59/39 mmHg in small branches in the posterior parietal subcortex.[6]
Thus, an old person with stiff arteries might have a blood pressure of 130/55 by cuff, with an even lower true diastolic pressure, at times below thresholds required to perfuse the heart and brain.
Osler wrote in 1892 about the hard radial artery that was still palpable after inflation of a blood pressure cuff. [7] I first described what I called “pseudohypertension”, better called Cuff Artefact, in 1978. [8] (At the time I was focusing on the indication for treatment of hypertension, which in those days was a diastolic pressure >90 mmHg). Messerli [7] and others commented on the issue in later years, but doctors seem to have forgotten that in old people with stiff arteries, the diastolic pressure measured by cuff may be much higher than the true intra-arterial pressure.
I hope that Masoli and colleagues will re-analyze their data through this lens.
*(A figure can be seen in a letter to the Editor: https://bit.ly/389yx7K)
1. Masoli JAH, Delgado J, Pilling L, Strain D, Melzer D. Blood pressure in frail older adults: associations with cardiovascular outcomes and all-cause mortality. Age and Ageing. 2020.
2. McEvoy JW, Chen Y, Rawlings A, Hoogeveen RC, Ballantyne CM, Blumenthal RS, et al. Diastolic Blood Pressure, Subclinical Myocardial Damage, and Cardiac Events: Implications for Blood Pressure Control. J Am Coll Cardiol. 2016;68(16):1713-22.
3. Park JH, Ovbiagele B. Post-stroke diastolic blood pressure and risk of recurrent vascular events. Eur J Neurol. 2017;24(11):1416-23.
4. Finnegan TP, Spence JD, Wong DG, Wells GA. Blood pressure measurement in the elderly: correlation of arterial stiffness with difference between intra-arterial and cuff pressures. J Hypertens. 1985;3(3):231-5.
5. Spence JD. Spectral analysis of carotid vs femoral Doppler velocity patterns: a clue to genesis of flow disturbances in cerebral arteries. Frontiers of Engineering in Health Care. 1981:0000-355.
6. Blanco PJ, Muller LO, Spence JD. Blood pressure gradients in cerebral arteries: a clue to pathogenesis of cerebral small vessel disease. Stroke Vasc Neurol. 2017;2(3):108-17.
7. Messerli FH, Ventura HO, Amodeo C. Osler's maneuver and pseudohypertension. N Engl J Med. 1985;312(24):1548-51.
8. Spence JD, Sibbald WJ, Cape RD. Pseudohypertension in the elderly. Clin Sci Mol Med. 1978;55((Suppl. 4)):399s-402s.