


Abstract
Frailty, increased vulnerability to physiological stressors, is associated with adverse outcomes. COVID-19 exhibits a more severe disease course in older, comorbid adults. Awareness of atypical presentations is critical to facilitate early identification.
To assess how frailty affects presenting COVID-19 symptoms in older adults.
Observational cohort study of hospitalised older patients and self-report data for community-based older adults.
Admissions to St Thomas’ Hospital, London with laboratory-confirmed COVID-19. Community-based data for older adults using the COVID Symptom Study mobile application.
Hospital cohort: patients aged 65 and over (n = 322); unscheduled hospital admission between 1 March 2020 and 5 May 2020; COVID-19 confirmed by RT-PCR of nasopharyngeal swab. Community-based cohort: participants aged 65 and over enrolled in the COVID Symptom Study (n = 535); reported test-positive for COVID-19 from 24 March (application launch) to 8 May 2020.
Multivariable logistic regression analysis performed on age-matched samples from hospital and community-based cohorts to ascertain association of frailty with symptoms of confirmed COVID-19.
Hospital cohort: significantly higher prevalence of probable delirium in the frail sample, with no difference in fever or cough. Community-based cohort: significantly higher prevalence of possible delirium in frailer, older adults and fatigue and shortness of breath.
This is the first study demonstrating higher prevalence of probable delirium as a COVID-19 symptom in older adults with frailty compared to other older adults. This emphasises need for systematic frailty assessment and screening for delirium in acutely ill older patients in hospital and community settings. Clinicians should suspect COVID-19 in frail adults with delirium.
Key points
Older adults with frailty hospitalised with COVID-19 were more likely to present with probable delirium than non-frail adults of the same age.
Possible delirium was also observed in a community cohort, in whom fatigue and breathlessness were also more common in frail than non-frail older adults.
Clinicians should suspect COVID-19 when assessing frail older adults with less typical symptoms of the disease, particularly delirium. A systematic evaluation of change in mental status needs to be included when assessing this population.
Early detection facilitates infection control measures to mitigate against catastrophic spread and preventable hospitalisations and deaths amongst frail, vulnerable older adults.
Background
COVID-19, caused by severe acute respiratory syndrome coronavirus 2 (SARS-CoV-2), poses a significant threat to the older population at increased risk from infection, hospitalisation and death [1, 2]. In a study from Wuhan, China, over 70% of 339 patients over 60 years of age with COVID-19 were classified as severe or critical, with a case-fatality rate of 19% [3]. In Italy, the highest case-fatality rate was observed among older, male and multi-comorbid patients [4] and in an American study, adults >65 years old represented 80% of fatalities [5]. This vulnerability might partially be explained by a greater number of chronic diseases [6] and immunosenescence [7,8]. It is imperative to rapidly identify and contain infection within this group.
Prevalent symptoms of confirmed COVID-19 infection from a variety of international settings are summarised in Table 1. It is well-documented that presenting symptoms vary with age for many diseases, including respiratory infections [9–11]. Symptoms including delirium, weakness, malaise, anorexia, headache, dizziness, falls and functional decline are more common in older people. Less typical presentations of COVID-19 in older adults, including weakness, headache, delirium and absence of fever or cough, have been documented in case reports and small cohort studies (n < 60) [12–14]. In work by our research group using point-of-care testing, hypothermia was noted to be an early clinical sign in a minority of older adults [15].
Selection of studies describing the frequency of symptoms in laboratory confirmed SARS-CoV-2. PubMed database was searched for relevant studies indexed before 25th May 2020; search terms COVID-19 OR SARS-CoV-2, symptom*; search results filtered for observational studies; only studies in adult patients reviewed and relevant studies selected
| Study | Participants | Study Methods | Symptoms reported (% of cases) |
|---|---|---|---|
| Guan et al. [30] China | 1099 patients with laboratory confirmed SARS-CoV-2 Median age 47 years 58.1% Male Severe disease n = 173 Non-severe disease n = 926 | 552 hospitals Retrospective observational study Data compared between severe and non-severe disease (severe = death or requirement for ICU admission/mechanical ventilation) | Fever (43.8% on admission, 88.7% during hospitalization) Cough (67.8%) Fatigue (38.1%) Sputum production (33.7%) Shortness of breath (18.7%) Myalgia or arthralgia (14.9%) Sore throat (13.9%) Headache (13.6%) Chills (11.5%) Nausea or vomiting (5.0%) Diarrhea (3.8%) |
| Wang et al. [55] China | 138 patients Median age 56 years 54.3% Male | Single site Retrospective observational study | Fever (98.6%) Cough (86.2%) Myalgia or fatigue (34.8%) Dyspnea (31.2%) Expectoration (26.8%) Sore throat (17.4%) Diarrhea (10.1%) Headache or dizziness (6.5%) Nausea and vomiting (3.6%) Other symptoms* (42.0%) * chillness; conjunctival congestion; anorexia; abdominal pain; constipation; heart palpitations |
| Du et al. [56] China | 85 patients with laboratory confirmed SARS-CoV-2 Median age 65.8 years 72.9% Male | 2 hospitals Retrospective observational study All cases fatal | Fever (91.8%) Dyspnea (70.6%) Shortness of breath (58.8%) Fatigue (58.8%) Anorexia (56.5%) Expectoration (37.6%) Dry cough (22.4%) Diarrhea (18.8%) Myalgia (16.5%) Headache (4.7%) Vomiting (4.7%) Abdominal pain (3.5%) Chest pain (2.4%) Pharyngalgia (2.4%) |
| Liu et al. [57] China | 32 patients with laboratory confirmed SARS-CoV-2 (25 adults) Mean age 44 years 48% Male | Single site Retrospective observational study | Fever (94%) Cough (76%) Myalgia or fatigue (52%) Shortness of breath (40%) Pharyngalgia (24%) Diarrhea or vomiting (8%) |
| Huang et al. [58] China | 32 patients with laboratory confirmed SARS-CoV-2 Median age 49 years 73% Male | Single site Retrospective and prospective observational study Data compared between cases requiring ICU care and no ICU care | Fever (98%) Cough (76%) Myalgia or fatigue (44%) Sputum production (28%) Headache (8%) Hemoptysis (5%) Diarrhea (3%) |
| Xu et al. [59] China | 62 patients with laboratory confirmed SARS-CoV-2 Median age 41 years 56% Male | Seven hospitals Retrospective case series | Cough (81%) Fever (77%) Expectoration (56%) Myalgia or fatigue (52%) Headache (34%) Diarrhea (8%) Hemoptysis (3%) Shortness of breath (3%) |
| SARS-CoV-2 Surveillance Group Istituto Superiore di Sanità [60] (23rApril 2020) Italy | 23,188 patients with PCR-confirmed SARS-CoV-2 Median age 81 years 63.3% Male | Patients dying in Italy: 19 regions and 2 autonomous provinces Retrospective data collection | Fever (75%) Dyspnea (72%) Cough (38%) Diarrhea (6%) Hemoptysis (1%) |
| Spiteri et al. [61] WHO European Region | 38 cases with laboratory-confirmed SARS-CoV-2 (31 with recorded symptoms) Median age 42 years 65.8% Male | Multiple centres Retrospective observational study | Fever (64.5%) Cough (45.2%) Weakness (25.8%) Headaches (19.4%) Sore throat (6.5%) Rhinorrhea (6.5%) Shortness of breath (6.5%) Asymptomatic (6.5%) |
| Zayet et al. [62] France | 62 patients Median age 56 years 39% Male | Single site Retrospective observational study | Fatigue (94%) Cough (81%) Headache (78%) Fever (76%) Myalgia (61%) Anosmia (52%) Dysgeusia (48%) Rhinorrhea (48%) Diarrhea (39%) Dyspnea (34%) |
| Docherty et al. [63] UK | 20133 patients with proven or likely SARS-CoV-2 Median age 73 years 59.9% Male | 208 acute hospitals Prospective observational cohort study | Fever (71.6%) Shortness of breath (71.2%) Cough (68.9%) Fatigue (45.5%) Confusion (26.7%) Muscle ache (20.6%) Diarrhoea (20.4%) Nausea/vomiting (19.8%) Chest pain (14.6%) Headache (12.5%) Wheeze (10.9%) Abdominal pain (10.2%) Sore throat (9.8%) |
Frailty, an increased vulnerability to physiological stressors [16], confers increased risk of adverse health outcomes including mortality, falls, fractures, hospitalisation and disability [16,17]. Frailty is associated with increased likelihood of hospital-acquired complications, including delirium, falls or deconditioning. National Institute for Health and Care Excellence (NICE) UK guidelines recommend that all adult patients over 65 years should be assessed for frailty on hospital admission to guide appropriate management and advanced care planning, using the Clinical Frailty Scale (CFS) [18]. In a large multi-site study, Hewitt et al. showed that outcomes from COVID-19, including mortality, were better predicted by frailty than age or comorbidity [19]. Interestingly, a pre-print study from a single London trust found no association between frailty and mortality rates after COVID-19 and suggested potentially different pathways to mortality in the two groups [20]. However, despite calls for data on the effects of frailty on COVID-19 presentation and management [21], a recent review retrieved very few studies: all observational, many in small, highly selected cohorts [22].
We use point-of-care data from patients admitted to a large UK hospital trust, supported by community-based COVID Symptom Study mobile application (‘app’) data, to assess how frailty affects presentation of confirmed COVID-19 infection in older adults.
Methods
Participants
This study uses two cohorts.
Hospital cohort
Point-of-care data were collected on all patients aged 65 years and above with unscheduled admission to St Thomas’ Hospital, London, between 1 March and 5 May 5 2020 with suspected or confirmed COVID-19. Local population: Southwark has a total population of 318,830, of which 49.9% male and 45.7% black and minority ethnic (BAME), with average age 34.4 years and Lambeth has a total population of 326,034, of which 50.3% male and 41.5% BAME, with average age 34.5 years [23]. Data were collected as part of the international COVIDCollab study, led by the Geriatric Medicine Research Collaborative [24]. Routinely collected data include age, sex, body mass index (BMI), comorbidities, CFS [25,26] and presenting symptoms. Presenting symptoms were documented in Emergency Department and/or medical admissions proformas. Data were manually extracted from electronic health record (EHR) software systems e-Noting and iSOFT Electronic Patient Record.
Only laboratory-confirmed cases of COVID-19 infection (RT-PCR of nasopharyngeal swab) were included. For patients readmitted during the study period, data from index admission were used.
Full data collection template available at https://www.gemresearchuk.com/covid-19.
Patient identifying details were stored on trust software, aligned with local Information Governance procedures; identifying details (patient number and date of birth) were removed prior to analysis and analysts were blinded to patient-identifying details.
Community-based cohort
This comprised community-dwelling older people who submitted data via the COVID Symptom Study app, developed by Zoe Global Limited, with scientific input from researchers and clinicians at King’s College London and Massachusetts General Hospital, Boston (https://covid.joinzoe.com/). The app was launched in the UK on 24 March and became available in the US on 29 March, 2020. It captures self-reported information on COVID-19 symptoms and healthcare visits. On accessing the app, users record location, age and health risk factors. Since CFS requires assessment by a healthcare professional, it was not feasible here. Users completed a PRISMA-7 questionnaire (a 7-item screening tool) [27] adapted for large-scale app usage, to assess level of frailty (Appendix A1). PRISMA-7 has been validated for use in older adults [28] and has good validity compared to the CFS [29]. The app was upgraded in April 2020 to allow family members or care-givers to submit data by-proxy, with consent. This has increased numbers of reporting older, frailer participants.
Consent to data analysis and sharing was obtained when individuals enrolled in the app. UK data up to 8 May 2020 were inspected and, as part of the quality control (QC) stage, invalid BMI (<15 and >55) and age entries (<18 years) removed. QC was performed by automated python script developed independent of data analysis. The total dataset comprised 2,848,396 individuals, 11,206 of whom reported a positive COVID-19 test. This was filtered to include those aged 65 years and above. All longitudinal entries were condensed per person to form a binary metric recording whether the person had experienced each of the 14 symptoms (below) during the study period. As such, there were no missing data points in the aggregated data.
Measurements
Probable delirium was diagnosed as a clinically documented delirium diagnosis on admission in the hospitalised cohort; use of the 4-AT screening tool for delirium detection is encouraged but not mandated. Possible delirium in the community-based cohort was classified as ‘Yes’ to question: ‘Do you have any of the following symptoms: confusion, disorientation or drowsiness?
Analyses
Descriptive statistics report demographic and key clinical characteristics of the study populations: overall and according to frailty. Frailty was classified as a binary variable: CFS ≥ 5 = frail; CFS < 5 = not frail for the hospital cohort; PRISMA7 ≥ 3 = frail; PRISMA7 < 3 = not frail in the community-based cohort. A binary temperature classification was used in the hospitalised cohort, based on a previous large observational cohort study [30]: ≥37.5°C = fever; 37.5 < afebrile.
Continuous variables were expressed as mean ± standard deviation (SD), and categorical variables as frequencies by absolute value and percentages (%). Differences in proportions and means of covariates between subjects with and without frailty were assessed using Wilcoxon’s test for continuous variables and Fisher’s exact test for categorical variables. Missing data were excluded from analysis.
Following age-matching by frailty status in the hospitalised cohort (n = 210), multivariable logistic regression analysis was performed to assess whether frailty predicts symptoms of confirmed COVID-19 infection on hospital admission, including fever, cough and probable delirium. BMI and sex were covariates.
Following age-matching by frailty status in the community-based cohort (n = 238), multivariable logistic regression analysis was performed to assess whether frailty predicts symptoms of reported confirmed COVID-19 infection. Symptoms analysed included possible delirium, fever, persistent cough, fatigue, myalgia, shortness of breath, diarrhoea, anorexia, abdominal pain, hoarse voice, anosmia/dysgeusia, headache, chest pain and pharyngodynia. BMI and sex were covariates.
Data analysis and graphics were performed in the R statistical environment (version 4.0) using the Tidyverse packages.
Results
Hospital cohort
Baseline characteristics of the unmatched hospital study cohort are summarised in Appendix A2. Mean age of 322 individuals with confirmed COVID-19 RT-PCR was 78.58 years (SD ± 7.93); 154 (48%) were females. One hundred and sixty-five (51%) patients were classified as frail. Twelve patients were excluded from final analysis due to missing clinical frailty score.
After age-matching, difference in mean age between the frail (77.92 ± SD 6.64 years) and non-frail group (77.85 ± SD 7.04 years) was non-significant (Wilcoxon’s P > 0.05). The proportion of females was 39% in both groups. BMI differences between the frail and non-frail groups were non-significant (Figure 1a–c and Table 2). Comorbidities of the matched study cohort according to frailty status are summarised in Table 2. There was a higher prevalence of respiratory disease and dementia in the frail compared to non-frail group, but no significant differences in cardiovascular disease, diabetes, psychiatric disease or cancer (Table 2).
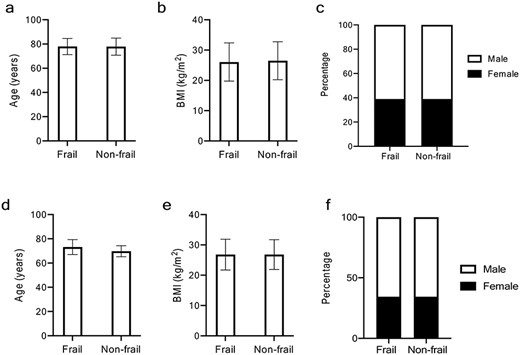
Baseline characteristics of study population according to frailty in hospitalised and in community-based cohorts (age-matched populations). For all graphs: F, frail subgroup; NF, non-frail subgroup. (a) Mean age (in years), (b) mean BMI (kg/m2) F and NF groups in both sexes combined, female and males, (c) percentage of females in F and NF groups in hospital cohort, (d) mean age (in years), (e) mean BMI (kg/m2) F and NF groups in both sexes combined, female and males, (f) percentage of females in F and NF groups in community-based cohort.
Characteristics and comorbidities of age-matched hospital and community-based cohorts, according to frailty status
| Hospital cohort | Community cohort | |||||||
|---|---|---|---|---|---|---|---|---|
| Total sample (n = 210) | Frail (n = 105) | Not frail (n = 105) | P-value | Total sample (n = 238) | Frail (n = 119) | Not frail (n = 119) | P-value | |
| Age | 77.9 (6.83) | 77.9 (6.64) | 77.9 (7.04) | 0.91 | 73.0 (5.86) | 72.8 (5.61) | 69.8 (4.61) | 0.63 |
| Number of females | 82 (39%) | 41 (39%) | 41 (39%) | 1.00 | 82 (34.4%) | 41 (34.4%) | 41 (34.4%) | 1.00 |
| BMI | 26.29 (6.28) | 26.06 (6.32) | 26.5 (6.28) | 0.82 | 26.8 (5.00) | 26.8 (5.09) | 26.8 (4.92) | 0.94 |
| Cardiovascular disease | 140 (66.0%) | 71 (67.0%) | 69 (65.0%) | 0.88 | 37 (15.5%) | 28 (23.5%) | 9 (7.6%) | 0.001 |
| Diabetes | 85 (40.4%) | 41 (39.0%) | 44 (42.0%) | 0.67 | 38 (16.0%) | 25 (21.0%) | 13 (10.9%) | 0.051 |
| Respiratory disease | 84 (40.0%) | 52 (49.0%) | 32 (30.0%) | 0.007 | 50 (21.0%) | 35 (29.4%) | 15 (12.6%) | 0.002 |
| Psychiatric condition | 23 (11.0%) | 15 (14.0%) | 8 (7.0%) | 0.18 | – | – | – | – |
| Dementia | 40 (19.0%) | 35 (33.0%) | 5 (4.7%) | 1.07 × 10⁻⁷ | – | – | – | – |
| Cancera | 39 (18.6%) | 19 (18.0%) | 20 (19.0%) | 0.86 | 27 (14.1%) | 25 (23.6%) | 2 (2.3%) | 1.61 × 10⁻⁷ |
| Kidney disease | – | – | – | – | 16 (6.7%) | 14 (11.7%) | 2 (2.3%) | 0.003 |
Binary variables are presented as count (%) and continuous variables as mean (standard deviation). Frail Hospital = CFS ≥ 5; Frail Community = PRISMA7 ≥ 3.
aCancer data only available for 192 individuals (106 frail and 86 not frail) in the cohort.
After age-matching, delirium was reported in 40 (38%) of frail and 13 (12%) of non-frail patients with COVID-19 (Table 3). Frailty was found to significantly predict delirium (P-value: 0.013; odds ratio (OR) (95% confidence interval (CI)) = 3.22 (1.44, 7.21)) after false discovery rate (FDR) correction for multiple testing (Table 3). There were no significant differences between frail and non-frail for other symptoms (fever (temperature ≥ 37.5°C) and cough). Of age-matched participants presenting with delirium, 10(18.9%) presented with delirium as the only symptom; 14(26.4%) presented with both delirium and fever, and 11(20.8%) with delirium and cough.
COVID-19 symptoms of age-matched hospital and community-based cohorts, according to frailty status
| Hospital cohort | Community cohort | |||||||||
|---|---|---|---|---|---|---|---|---|---|---|
| Total sample (n = 210) | Frail (n = 105) | Not frail (n = 105) | P-value | OR (95% CI) | Total sample (n = 238) | Frail (n = 119) | Not frail (n = 119) | P-value | OR (95% CI) | |
| Delirium† | 53 (25.2%) | 40 (38.1%) | 13 (12.4%) | 0.013* | 3.22 (1.44–7.21) | 84 (35.6%) | 53 (44.5%) | 31 (26.1%) | 0.038* | 2.29 (1.33–4.00) |
| Fever | 82 (39.0%) | 41 (39.0%) | 41 (39.0%) | 0.90 | 1.04 (0.55–1.97) | 60 (25.4%) | 36 (30.3%) | 24 (20.2%) | 0.174 | 1.72 (0.95–3.14) |
| Cough | 126 (60.0%) | 63 (60.0%) | 63 (60.0%) | 0.90 | 1.15 (0.60–2.20) | 69 (29.2%) | 42 (35.3%) | 27 (22.7%) | 0.095 | 1.88 (1.06–3.37) |
| Fatigue | – | – | – | – | – | 164 (69.5%) | 92 (77.3%) | 72 (60.5%) | 0.038* | 2.23 (1.27–3.96) |
| Shortness of Breath | – | – | – | – | – | 116 (49.2%) | 68 (57.1%) | 48 (40.3%) | 0.043* | 2.00 (1.19–3.39) |
Binary variables are presented as count (%) and continuous variables as mean (standard deviation). Frail hospital = CFS ≥ 5; Frail community-based = PRISMA7 ≥ 3; Fever in hospital data (≥37.5°C).
P-values are FDR adjusted at 5%.
*Donates significance.
†Probable (hospital) or possible (community).
Community-based cohort
The proportion of total COVID Symptom Study app users ≥65 years of age was 334,544/2,848,396 (11.7%). Baseline characteristics of the unmatched study population are summarised in Appendix A2. One hundred and ninety-two (36%) were classified as frail. Seventy-seven percent of frail participants with a reported positive COVID-19 test were reporting-by-proxy. In the frail group, delirium was present in 94/192 (49%) (self-reported 20/44 (45%); reported-by-proxy 74/148 (50%)). Baseline characteristics of the age-matched cohort are summarised in Figure 1(d–f) and Table 2. Comorbidities are summarised in Table 2.
After age-matching, frailty was found to significantly predict delirium (P-value 0.038; OR (95% CI) = 2.29 (1.33, 4.00)), after FDR correction for multiple testing (Table 3). Frailty also predicted fatigue (P-value: 0.038; OR = 2.23 (1.27, 3.96)) and shortness of breath (P-value: 0.043; OR = 2.00 (1.19, 3.39)). There were no significant differences between frail and not frail for the other 11 symptoms analysed (Table 3 and Appendix A3). In the age-matched participants reporting delirium, 28 (33%) did not report fever or cough. Thirty-seven (44%) reported both delirium and fever and 35(42%) reported both delirium and cough. Note this may not represent concurrent symptoms.
Discussion
This study demonstrates that prevalence of probable delirium is significantly higher in frail compared to non-frail older adults with COVID-19, highlighting both that a frailty assessment is fundamental and a systematic evaluation of change in mental status needs to be included when assessing this population. Delirium is associated with greater morbidity and mortality amongst older adults [31] and may be the only presenting symptom of COVID-19 in this vulnerable population [32].
COVID-19 disproportionately affects older adults, partly due to increased prevalence of frailty. Frail adults in residential settings may be at particular risk of transmission of respiratory illness. Case reports of COVID-19 outbreaks in nursing and residential homes have been published, highlighting the risks of infection and high case-fatality [33]. Many other frail older adults are dependent on home care packages, with movement of care workers between residences. Understanding differences in COVID-19 presentation resulting from frailty is imperative to prompt rapid diagnosis, isolation and contact-tracing, and to guide assessment and treatment. Our findings alert clinicians to the need to identify frailty and look for atypical COVID-19 presentations. We also identified self-reported fatigue and shortness of breath as more common amongst adults with frailty—consistent with a decrease in physiological reserve.
Early identification of frailty facilitates a differential, targeted clinical approach, focusing not only on ‘typical’ COVID-19 symptoms (e.g. fever and cough) but also on symptoms, such as delirium, demonstrated here to be more common in frail older adults. The importance of comprehensive frailty assessment in acute and community-based clinical settings is nationally recognised [34, 35]. Rapid NICE guidance produced in response to the COVID-19 pandemic outlines the importance of identifying those at increased risk of poor outcomes and less likely to benefit from critical care admission [18, 35]. Delirium is frequently under-recognised in hospitalised populations [31]. The prevalence of delirium in our hospitalised COVID-19 cohort was similar to that reported in a study from another London hospital (27% (19/71)); notably, this study estimated actual delirium prevalence at 42% following specialist re-assessment [36].
Delirium is a frequent complication of hospitalisation for older adults [37] and for patients admitted to critical care of all ages [38]. Although pathophysiology is not fully understood, neuroinflammation has been hypothesised to play a key role [38]. Few of the early descriptive studies of COVID-19 included delirium or new confusion [39], emphasising the importance of our finding. A recent case study described acute confusion in an older patient with no pre-existing cognitive impairment presenting with COVID-19 [14]. In a retrospective study of 214 patients from China, Mao et al. reported ‘impaired consciousness’ in 7.5% of patients, some of which may represent delirium. Other central nervous system (CNS) manifestations of COVID-19 infection reported were headache, dizziness, acute cerebrovascular disease, ataxia and seizures. These were significantly more common in severe infections and in older and comorbid patients [40]. In addition, non-neurological triggers may be important in delirium. Hypoxia, common in COVID-19 infections [41], is a well-recognised cause of delirium [42]. In addition, electrolyte disturbance, dehydration, and tachycardia may play a role. Some have suggested that reduced patient contact during the pandemic, for protection of staff and other patients and because of time taken to don personal protective equipment, may be contributing to missed or delayed diagnoses of fluctuant delirium and acute confusion and may cause or worsen delirium in these patients [43, 44].
A number of other coronaviruses have shown significant neurotropism in animal models [45, 46]; it is plausible that SARS-CoV-2 displays this property. Indeed, SARS-CoV-2 was found in cerebrospinal fluid of a reported case of COVID-19 encephalitis in Beijing [47]. Different mechanisms have been proposed to explain neurological involvement in COVID-19. The virus could reach the CNS via a compromised blood–brain barrier, or migrate via neuronal pathways, infecting peripheral sensory or motor nerve endings [48], leading to subsequent neurological damage and neuroinflammation. Some authors have proposed that angiotensin-converting enzyme 2 (ACE2), identified as the functional receptor for SARS-CoV-2 and expressed in the brain [49], could play a role in mediating the inflammatory response in COVID-19 infection [40, 50].
Limitations
There are several limitations to this study. For the hospital cohort, admissions data were collected retrospectively from EHRs. CFS was not always documented systematically and, in approximately one-third of cases, had to be retrospectively calculated using information from admission clerking. Delirium was a clinical diagnosis documented on admission; not all patients were systemically screened using 4AT. This may have led to under-detection of delirium [31].
In the community-based cohort, COVID-19 test result and symptoms were self-reported directly by participants or by-proxy. Since delirium may be missed without systematic screening, its overall prevalence may have been underestimated. The proportion of total app users ≥65 years of age is 11.7%, whereas only 4.8% of app users with a confirmed positive COVID-19 test were ≥ 65 years of age. Since 18.3% of the UK population are aged over 65[51], older adults, especially laboratory-tested for COVID-19, may be under-represented. Sampling using a mobile application is likely to under-represent individuals without mobile devices and those severely affected by disease. These biases may mean we underestimate differences in symptoms in frail people. Reassuringly, the most significant finding from the community-based sample was recapitulated in the hospital sample. Of app users aged ≥65 years, 16.4% were categorised as frail. This is a similar proportion to the 15–20% of older adults categorised as moderate or severely frail during validation of the electronic Frailty Index [52]. In the community cohort, older adults with pre-existing dementia, cognitive impairment or sensory impairment may be under-represented; since these are well-documented risk factors for delirium, this may have led to an underestimation of delirium prevalence. Furthermore, the longitudinal app data were aggregated for each participant to create a binary metric of whether they had ever reported experiencing each symptom; this does not capture whether symptoms were concurrent.
For community-based data, COVID-19 tests were not widely available in the UK at the time of study [53, 54]. Participants were likely tested because they displayed severe symptoms, were in contact with confirmed cases, were healthcare workers or had travelled abroad to a risk area early in the outbreak. Additionally, the app captures data on whether participants have ever been diagnosed with COVID-19; some may have previously tested positive but were no longer symptomatic on enrolment. Reassuringly, older people reporting delirium symptoms were more likely to be PCR-tested. However, this was not true across all ages; in the whole population, adjusting for other reported symptoms, reporting confusion, disorientation or drowsiness appeared to reduce the likelihood of getting a test (Appendix A4).
Conclusion
This is the first study reporting that frail patients with COVID-19 present with a significantly higher prevalence of probable delirium than non-frail patients, using hospital and community-based cohorts. Our data emphasise the need for systematic assessment of frailty and delirium when assessing acutely ill patients in both hospital and community settings. Clinicians should suspect COVID-19 in frail patients presenting with delirium. This is important in care homes and long-term care facilities, where resident populations are vulnerable to respiratory disease outbreaks. Early detection facilitates implementation of infection control measures and appropriate personal protective equipment to avoid catastrophic spread and reduce mortality amongst frail older adults.
Declaration of Sources of Funding
Support for this study was provided by the NIHR-funded Biomedical Research Centre based at GSTT NHS Foundation Trust. Investigators also received support from the Wellcome Trust, the MRC, BHF, EU, NIHR, CDRF, the Alzheimer’s Society and the NIHR-funded BioResource, Clinical Research Facility and BRC based at GSTT NHS Foundation Trust in partnership with KCL. This work was supported by the UK Research and Innovation London Medical Imaging & Artificial Intelligence Centre for Value Based Healthcare. K.S.S. receives support from MRC grants MR/R023131/1 and MR/M004422/1. MNL is funded by an NIHR Doctoral Fellowship (Grant code RE160685).
Declaration of Conflicts of Interest
The app was developed by Zoe Global Limited with input from King’s College London and Massachusetts General Hospital.
References
Author notes
Maria Beatrice Zazzara, Rose S. Penfold and Amy L. Roberts share first authorship of this paper.
Claire J. Steves and Mary Ni Lochlainn share joint senior (last) authorship of this paper.

Comments