


Abstract
The European Working Group on Sarcopenia in Older People (EWGSOP) developed a practical clinical definition and consensus diagnostic criteria for age-related sarcopenia. EWGSOP included representatives from four participant organisations, i.e. the European Geriatric Medicine Society, the European Society for Clinical Nutrition and Metabolism, the International Association of Gerontology and Geriatrics—European Region and the International Association of Nutrition and Aging. These organisations endorsed the findings in the final document.
The group met and addressed the following questions, using the medical literature to build evidence-based answers: (i) What is sarcopenia? (ii) What parameters define sarcopenia? (iii) What variables reflect these parameters, and what measurement tools and cut-off points can be used? (iv) How does sarcopenia relate to cachexia, frailty and sarcopenic obesity?
For the diagnosis of sarcopenia, EWGSOP recommends using the presence of both low muscle mass + low muscle function (strength or performance). EWGSOP variously applies these characteristics to further define conceptual stages as ‘presarcopenia’, ‘sarcopenia’ and ‘severe sarcopenia’. EWGSOP reviewed a wide range of tools that can be used to measure the specific variables of muscle mass, muscle strength and physical performance. Our paper summarises currently available data defining sarcopenia cut-off points by age and gender; suggests an algorithm for sarcopenia case finding in older individuals based on measurements of gait speed, grip strength and muscle mass; and presents a list of suggested primary and secondary outcome domains for research.
Once an operational definition of sarcopenia is adopted and included in the mainstream of comprehensive geriatric assessment, the next steps are to define the natural course of sarcopenia and to develop and define effective treatment.
Sarcopenia as a geriatric syndrome
A grave change associated with human ageing is progressive decline in skeletal muscle mass, a downward spiral that may lead to decreased strength and functionality. In 1989, Irwin Rosenberg proposed the term ‘sarcopenia’ (Greek ‘sarx’ or flesh + ‘penia’ or loss) to describe this age-related decrease of muscle mass [1, 2]. Sarcopenia has since been defined as the loss of skeletal muscle mass and strength that occurs with advancing age [3]. However, a widely accepted definition of sarcopenia suitable for use in research and clinical practice is still lacking.
Geriatric syndromes are common, complex and costly states of impaired health in older individuals. Geriatric syndromes result from incompletely understood interactions of disease and age on multiple systems, producing a constellation of signs and symptoms. Delirium, falls and incontinence are examples of geriatric syndromes [4]. We suggest it may be likewise helpful to recognise sarcopenia as a geriatric syndrome because this view promotes its identification and treatment even when the exact causes remain unknown [5, 6].
What is the evidence that age-related sarcopenia fits the current definition of a geriatric syndrome? Sarcopenia is prevalent in older populations [7, 8]. Sarcopenia has multiple contributing factors—the ageing process over the life course, early life developmental influences, less-than-optimal diet, bed rest or sedentary lifestyle, chronic diseases and certain drug treatments [9–11]. Sarcopenia represents an impaired state of health with a high personal toll—mobility disorders, increased risk of falls and fractures, impaired ability to perform activities of daily living, disabilities, loss of independence and increased risk of death [12–16].
European Working Group on Sarcopenia in Older People
Rationale and methods
While age-related sarcopenia is common and has huge personal and financial costs, sarcopenia still has no broadly accepted clinical definition, consensus diagnostic criteria, International Classification of Diseases 9th Revision (ICD-9) codes or treatment guidelines. To address these shortfalls, the European Union Geriatric Medicine Society (EUGMS) decided in 2009 to create a Sarcopenia Working Group that would develop operational definitions and diagnostic criteria for sarcopenia to be used in clinical practice as well as in research studies. Other European scientific organisations (the European Society of Clinical Nutrition and Metabolism [ESPEN], the International Academy of Nutrition and Aging [IANA] and the International Association of Gerontology and Geriatrics—European Region [IAGG-ER]) were invited to join this group, accepted the request and nominated representatives who became members of the Sarcopenia Working Group.
The European Working Group on Sarcopenia in Older People (EWGSOP, the Sarcopenia Working Group) first met in January 2009, followed by two additional meetings during the year and by extensive email contacts. Literature reviews and discussions were guided by the following questions:
What is sarcopenia?
What parameters define sarcopenia?
What variables will measure them, and what measurement tools and cut-off points will be used?
How does sarcopenia relate to other diseases/conditions?
The document developed by the Sarcopenia Working Group was circulated to the Boards of the four participant organisations (EUGMS, ESPEN, IAGG-ER, IANA) for input, and then revised in accord with review comments, and sent back to the organisations for final endorsement.
What is sarcopenia?
Working definition
Sarcopenia is a syndrome characterised by progressive and generalised loss of skeletal muscle mass and strength with a risk of adverse outcomes such as physical disability, poor quality of life and death [17, 18]. The EWGSOP recommends using the presence of both low muscle mass and low muscle function (strength or performance) for the diagnosis of sarcopenia. Thus, diagnosis requires documentation of criterion 1 plus documentation of either criterion 2 or criterion 3 (Table 1).
Criteria for the diagnosis of sarcopenia
| Diagnosis is based on documentation of criterion 1 plus (criterion 2 or criterion 3) |
|---|
| 1. Low muscle mass |
| 2. Low muscle strength |
| 3. Low physical performance |
| Diagnosis is based on documentation of criterion 1 plus (criterion 2 or criterion 3) |
|---|
| 1. Low muscle mass |
| 2. Low muscle strength |
| 3. Low physical performance |
The rationale for use of two criteria is: muscle strength does not depend solely on muscle mass, and the relationship between strength and mass is not linear [18, 19]. Thus, defining sarcopenia only in terms of muscle mass is too narrow and may be of limited clinical value. Some have argued that the term dynapenia is better suited to describe age-associated loss of muscle strength and function [20]. However, sarcopenia is already a widely recognised term, so replacing it might lead to further confusion.
Mechanisms of sarcopenia
There are several mechanisms that may be involved in the onset and progression of sarcopenia (Figure 1). These mechanisms involve, among others, protein synthesis, proteolysis, neuromuscular integrity and muscle fat content. In an individual with sarcopenia, several mechanisms may be involved, and relative contributions may vary over time. Recognising these mechanisms and their underlying causes is expected to facilitate design of intervention trials that target one or more underlying mechanisms.
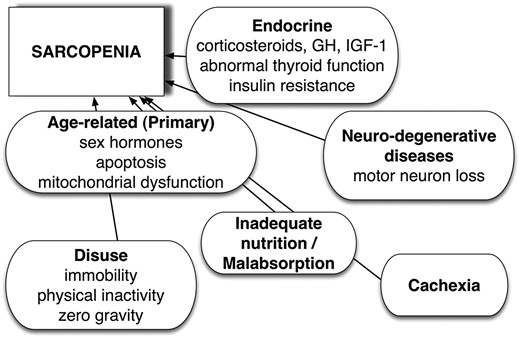
Mechanisms of sarcopenia.
Sarcopenia categories and stages
Sarcopenia is a condition with many causes and varying outcomes. While sarcopenia is mainly observed in older people, it can also develop in younger adults, as is likewise the case for dementia and osteoporosis. In some individuals, a clear and single cause of sarcopenia can be identified. In other cases, no evident cause can be isolated. Thus, the categories of primary sarcopenia and secondary sarcopenia may be useful in clinical practice. Sarcopenia can be considered ‘primary’ (or age-related) when no other cause is evident but ageing itself, while sarcopenia can be considered ‘secondary’ when one or more other causes are evident (Table 2). In many older people, the aetiology of sarcopenia is multi-factorial so that it may not be possible to characterise each individual as having a primary or secondary condition. This situation is consistent with recognising sarcopenia as a multi-faceted geriatric syndrome.
Sarcopenia categories by cause
| Examples | |
|---|---|
| Primary sarcopenia | |
| Age-related sarcopenia | No other cause evident except ageing |
| Secondary sarcopenia | |
| Activity-related sarcopenia | Can result from bed rest, sedentary lifestyle, deconditioning or zero-gravity conditions |
| Disease-related sarcopenia | Associated with advanced organ failure (heart, lung, liver, kidney, brain), inflammatory disease, malignancy or endocrine disease |
| Nutrition-related sarcopenia | Results from inadequate dietary intake of energy and/or protein, as with malabsorption, gastrointestinal disorders or use of medications that cause anorexia |
Sarcopenia staging, which reflects the severity of the condition, is a concept that can help guide clinical management of the condition. EWGSOP suggests a conceptual staging as ‘presarcopenia’, ‘sarcopenia’ and ‘severe sarcopenia’ (Table 3). The ‘presarcopenia’ stage is characterised by low muscle mass without impact on muscle strength or physical performance. This stage can only be identified by techniques that measure muscle mass accurately and in reference to standard populations. The ‘sarcopenia’ stage is characterised by low muscle mass, plus low muscle strength or low physical performance. ‘Severe sarcopenia’ is the stage identified when all three criteria of the definition are met (low muscle mass, low muscle strength and low physical performance). Recognising stages of sarcopenia may help in selecting treatments and setting appropriate recovery goals. Staging may also support design of research studies that focus on a particular stage or on stage changes over time.
EWGSOP conceptual stages of sarcopenia
| Stage | Muscle mass | Muscle strength | Performance |
|---|---|---|---|
| Presarcopenia | ↓ | ||
| Sarcopenia | ↓ | ↓ | Or ↓ |
| Severe sarcopenia | ↓ | ↓ | ↓ |
| Stage | Muscle mass | Muscle strength | Performance |
|---|---|---|---|
| Presarcopenia | ↓ | ||
| Sarcopenia | ↓ | ↓ | Or ↓ |
| Severe sarcopenia | ↓ | ↓ | ↓ |
Sarcopenia and other syndromes
Sarcopenia is featured in other syndromes associated with prominent muscle wasting. The main reason to differentiate between them is to encourage research into age-related mechanisms of sarcopenia and to guide targeted and appropriate therapy for each.
Cachexia
‘Cachexia’ (Greek ‘cac’ or bad + ‘hexis’ or condition) is widely recognised in older adults as severe wasting accompanying disease states such as cancer, congestive cardiomyopathy and end-stage renal disease [21]. Cachexia has recently been defined as a complex metabolic syndrome associated with underlying illness and characterised by loss of muscle with or without loss of fat mass [22]. Cachexia is frequently associated with inflammation, insulin resistance, anorexia and increased breakdown of muscle proteins [23, 24]. Thus, most cachectic individuals are also sarcopenic, but most sarcopenic individuals are not considered cachectic. Sarcopenia is one of the elements of the proposed definition for cachexia [22]. Very recently, a consensus paper expanding this definition of cachexia and identifying relevant issues on how to differentiate cachexia and sarcopenia was published by ESPEN, one of the EWGSOP-endorsing societies [25].
Frailty
Frailty is a geriatric syndrome resulting from age-related cumulative declines across multiple physiologic systems, with impaired homeostatic reserve and a reduced capacity of the organism to withstand stress, thus increasing vulnerability to adverse health outcomes including falls, hospitalisation, institutionalisation and mortality [26, 27]. Fried et al. developed a phenotypic definition of frailty based on readily identifiable physical aspects; three or more of the following characteristics support a frailty diagnosis—unintended weight loss, exhaustion, weakness, slow gait speed and low physical activity [27]. Frailty and sarcopenia overlap; most frail older people exhibit sarcopenia, and some older people with sarcopenia are also frail. The general concept of frailty, however, goes beyond physical factors to encompass psychological and social dimensions as well, including cognitive status, social support and other environmental factors [26].
Sarcopenic obesity
In conditions such as malignancy, rheumatoid arthritis and ageing, lean body mass is lost while fat mass may be preserved or even increased [28]. This state is called sarcopenic obesity, and thus the relationship between age-related reduction of muscle mass and strength is often independent of body mass. It had long been thought that age-related loss of weight, along with loss of muscle mass, was largely responsible for muscle weakness in older people [29]. However, it is now clear that changes in muscle composition are also important, e.g. ‘marbling’, or fat infiltration into muscle, lowers muscle quality and work performance [30].
While weight changes vary widely between individuals, certain patterns of age-related change in body composition have been observed. In ageing men, the percentage of fat mass increases initially, then levels off or decreases. Such change has been attributed to an accelerated decrease in lean mass, along with an initial increase and a later decrease in fat mass [31]. Women show a generally similar pattern [31]. Intramuscular and visceral fat increase with ageing while subcutaneous fat declines [18, 32, 33].
Identifying sarcopenia in research and practice
The parameters of sarcopenia are the amount of muscle and its function. The measurable variables are mass, strength and physical performance. The challenge is to determine how best to measure them accurately. It is also important to recognise change by repeating the same measures over time in the same individuals. The following sections briefly review measurement techniques that can be used and discuss their suitability for research and clinical practice settings.
Assessment techniques
Muscle mass
A wide range of techniques can be used to assess muscle mass [34]. Cost, availability and ease of use can determine whether the techniques are better suited to clinical practice or are more useful for research. Table 4 lists the suggestions of EWGSOP for use of these techniques in research and in routine clinical practice.
Measurements of muscle mass, strength, and function in research and practicea
| Variable | Research | Clinical practice |
|---|---|---|
| Muscle mass | Computed tomography (CT) | BIA |
| Magnetic resonance imaging (MRI) | DXA | |
| Dual energy X-ray absorptiometry (DXA) | Anthropometry | |
| Bioimpedance analysis (BIA) | ||
| Total or partial body potassium per fat-free soft tissue | ||
| Muscle strength | Handgrip strength | Handgrip strength |
| Knee flexion/extension | ||
| Peak expiratory flow | ||
| Physical performance | Short Physical Performance Battery (SPPB) | SPPB |
| Usual gait speed | ||
| Usual gait speed | Get-up-and-go test | |
| Timed get-up-and-go test | ||
| Stair climb power test |
Please refer to the text for a description and references on these measurement techniques.
Body imaging techniques. Three imaging techniques have been used for estimating muscle mass or lean body mass—computed tomography (CT scan), magnetic resonance imaging (MRI) and dual energy X-ray absorptiometry (DXA). CT and MRI are considered to be very precise imaging systems that can separate fat from other soft tissues of the body, making these methods gold standards for estimating muscle mass in research. High cost, limited access to equipment at some sites and concerns about radiation exposure limit the use of these whole-body imaging methods for routine clinical practice [8]. DXA is an attractive alternative method both for research and for clinical use to distinguish fat, bone mineral and lean tissues. This whole-body scan exposes the patient to minimal radiation. The main drawback is that the equipment is not portable, which may preclude its use in large-scale epidemiological studies [8].
> CT and MRI are gold standards for estimating muscle mass in research. DXA is the preferred alternative method for research and clinical use.
Bioimpedance analysis. Bioimpedance analysis (BIA) estimates the volume of fat and lean body mass. The test itself is inexpensive, easy to use, readily reproducible and appropriate for both ambulatory and bedridden patients. BIA measurement techniques, used under standard conditions, have been studied for >10 years [35], and BIA results under standard conditions have been found to correlate well with MRI predictions [36]. Prediction equations have been validated for multiethnic adults [36] and reference values established for adult white men and women, including older subjects [37–39]. Thus, BIA might be a good portable alternative to DXA.
> BIA may be considered as a portable alternative to DXA.
Total or partial body potassium per fat-free soft tissue. As skeletal muscle contains >50% of the total body potassium (TBK) pool, TBK is the classic method for estimation of skeletal muscle. More recently, partial body potassium (PBK) of the arm has been proposed as a simpler alternative [40]. PBK of the arm is safe and inexpensive.
> TBK is the classic method for the estimation of skeletal muscle, but this method is not used routinely.
Anthropometric measures. Calculations based on mid-upper arm circumference and skin fold thickness have been used to estimate muscle mass in ambulatory settings. Calf circumference correlates positively with muscle mass; calf circumference <31 cm has been associated with disability [41]. However, age-related changes in fat deposits and loss of skin elasticity contribute to errors of estimation in older people. There are relatively few studies validating anthropometric measures in older and obese people; these and other confounders make anthropometric measures vulnerable to error and questionable for individual use [14].
> Anthropometric measures are vulnerable to error and not recommended for routine use in the diagnosis of sarcopenia.
Muscle strength
There are fewer well-validated techniques to measure muscle strength. Although lower limbs are more relevant than upper limbs for gait and physical function, handgrip strength has been widely used and is well correlated with most relevant outcomes. Again, cost, availability and ease of use can determine whether the techniques are better suited to clinical practice or are useful for research (Table 4). It must be remembered that factors unrelated to muscle, e.g. motivation or cognition, may hamper the correct assessment of muscle strength.
Handgrip strength. Isometric hand grip strength is strongly related with lower extremity muscle power, knee extension torque and calf cross-sectional muscle area [13]. Low handgrip strength is a clinical marker of poor mobility and a better predictor of clinical outcomes than low muscle mass [13]. In practice, there is also a linear relationship between baseline handgrip strength and incident disability for activities of daily living (ADL) [42]. Muscle strength measures of different body compartments are correlated, so when feasible, grip strength measured in standard conditions with a well-studied model of a handheld dynamometer with reference populations can be a reliable surrogate for more complicated measures of muscle strength in the lower arms or legs.
> Grip strength is a good simple measure of muscle strength, and it correlates with leg strength.
Knee flexion/extension. Strength is about the magnitude of force generation, whereas power is about work rate (work done per unit time). In healthy older people, power is lost faster than strength. Both are important, but power is a better predictor of certain functional activities [43–45].
The ability of the muscle to generate force can be measured in several ways. Leg extensor power can be measured with a commercially available power rig [46]. Strength can be measured isometrically or isokinetically, the latter being a closer reflection of muscle function in everyday activity. Isometric strength testing of maximal voluntary contractions can be measured with relatively simple custom-made equipment. It is usually measured as the force applied to the ankle, with the subject seated in an adjustable straight-back chair, the lower leg unsupported and the knee flexed to 90° [47]. Modern, commercial isokinetic dynamometers allow both isometric and isokinetic measurements of strength as concentric torque at various angular velocities [48, 49]. Measurement is feasible in frail older people [50, 51]. Some data are available for older populations [52–54], but more are needed from a wider range of ages and ethnicities. These techniques are suitable for research studies, but their use in clinical practice is limited by the need for special equipment and training.
> Knee flexion techniques are suitable for research studies, but their use in clinical practice is limited by the need for special equipment and training.
Peak expiratory flow. In people without lung disorders, peak expiratory flow (PEF) is determined by the strength of respiratory muscles. PEF is a cheap, simple and widely accessible technique that has prognostic value [55, 56]. However, research on the use of PEF as a measure of sarcopenia is limited, so PEF cannot be recommended as an isolated measure of muscle strength at this time.
> PEF measures the strength of respiratory muscles, but it cannot be recommended as an isolated measure.
Physical performance
A wide range of tests of physical performance are available, including the Short Physical Performance Battery (SPPB), usual gait speed, 6-min walk test and the stair climb power test (Table 4) [57].
Short Physical Performance Battery. The SPPB evaluates balance, gait, strength and endurance by examining an individual’s ability to stand with the feet together in side-by-side, semi-tandem and tandem positions, time to walk 8 ft and time to rise from a chair and return to the seated position five times [58]. It is a composite of some separate tests that have also been used individually in sarcopenia research. It has been recently recommended by an international working group for use as a functional outcome measure in clinical trials in frail older persons [57]. Meaningful changes in the SPPB have been defined [59, 60]. Thus, the SPPB can be used as a standard measure of physical performance both for research and in clinical practice.
> The SPPB, a composite measure of physical performance, is a standard measure both for research and clinical practice.
Usual gait speed. Buchner et al. first recognised a non-linear relationship between leg strength and usual gait speed; this relationship explained how small changes in physiological capacity may have substantial effects on performance in frail adults, while large changes in capacity have little or no effect in healthy adults [61]. Since then, a study by Guralnik et al. suggested that timed usual gait provides a predictive value for the onset of disability [62]. Most recently, Cesari et al. confirmed the importance of gait speed (over a 6-m course) as a predictor of adverse health events (severe mobility limitation, mortality) but showed that poor performance on other tests of lower extremity function (standing balance and time to rise from a chair five times) had comparable prognostic value [63]. Usual gait speed can be used in clinical and research settings [57].
> Gait speed is part of the SPPB, but it can also be used as a single parameter for clinical practice and research.
Timed get-up-and-go test. The timed get-up-and-go (TGUG) test measures the time needed to complete a series of functionally important tasks. TGUG requires the subject to stand up from a chair, walk a short distance, turn around, return and sit down again. It thus serves as an assessment of dynamic balance. Balance function is observed and scored on a five-point scale [64].
> The TGUG, used in geriatric assessment, can serve as a performance measurement.
Stair climb power test. The stair climb power test (SCPT) has been proposed as a clinically relevant measure of leg power impairment [65]. SCPT results are consistent with more complex techniques for measuring leg power (double leg press at 40 and 70% of the one-repetition maximum; DLP40, DLP70) and performance (SPPB with components of gait speed chair stand time and standing balance). The SCPT has been suggested for research settings [65].
> The SCPT may be useful in some research settings.
Defining cut-off points
Cut-off points depend upon the measurement technique chosen and on the availability of reference studies. EWGSOP recommends use of normative (healthy young adult) rather than other predictive reference populations, with cut-off points at two standard deviations below the mean reference value. More research is urgently needed in order to obtain good reference values for populations around the world.
Various options to define sub-normal values for sarcopenia designation have been suggested. The following section provides some examples of how cut-off points have been derived and validated by correlation with other relevant clinical features.
Baumgartner et al. summed the muscle mass of the four limbs from a DXA scan as appendicular skeletal muscle mass (ASM) and defined a skeletal muscle mass index (SMI) as ASM/height2 (kg/m2) [66]. A SMI two standard deviations below the mean SMI of young male and female reference groups was defined as the gender-specific cut point for sarcopenia. Defined in this way, sarcopenia was significantly associated with physical disability and was independent of ethnicity, age, comorbidity, health behaviours and fat mass [66]. This method depends upon a measurement of appendicular skeletal muscle mass by DXA or estimation by BIA [19, 66].
In a cross-sectional survey of people aged ≥18 years in the USA (n = 14,818 adults >18 years, including n = 4,504 adults >60 years), Janssen et al. [67] also used standard deviations to define sarcopenia, measured in terms of skeletal muscle index (SMI), where SMI = (skeletal muscle mass/body mass) × 100. Subjects were considered to have a normal SMI if their SMI was higher than one standard deviation below the gender-specific mean for young adults (aged 18–39 years). Class I sarcopenia was considered present in subjects whose SMI was within one to two standard deviations below mean values for young adults, and Class II sarcopenia was present in subjects whose SMI was below two standard deviations of young adult values. With these definitions, sarcopenia was found to be a relatively common occurrence in American men and women >60 years; the likelihood of functional impairment and disability was two times greater in older men and three times greater in older women with Class II sarcopenia compared to older people who had a normal SMI.
Newman et al. [68] performed an observational cohort study of older people living in the USA (ages 70–79 years, n = 2,984, 52% women, 41% black). Participants were assessed using DXA and were classified as sarcopenic using two different approaches to adjust lean mass to body size: appendicular lean mass divided by height squared (aLM/ht2) and appendicular lean mass adjusted for height and body fat mass (residuals). Because population norms for young adult blacks and whites are not currently available, the gender-specific 20th percentile was arbitrarily chosen as the cut-off point for each method. In men, both classifications of sarcopenia were associated with smoking, poorer health, lower activity and impaired lower extremity function. In women, the classification based on both height and fat mass was more strongly associated with impaired lower extremity function, while other associations were fewer. As a result of these findings, the authors suggested that fat mass should be considered in estimating prevalence of sarcopenia in women and in overweight or obese individuals [68].
Norman et al. conducted a study that investigated the association between BIA and muscle function [69]. The study investigated the association between resistance and reactance normalised for height (R/H and Xc/H) and hand grip strength, an assessment of muscle function. The study included 363 men and women with a mean age of 63.1 years. Patients were grouped in quintiles by hand grip strength. Results showed that BIA resistance and reactance normalised for height were both associated with hand grip strength independent of other predictors of hand grip strength, such as age and gender. Xc/H was positively correlated with increases in hand grip strength, while R/H was negatively correlated with strength; significant differences in hand grip strength by quintile were associated with vector migration in the RXc graph. The researchers concluded that BIA was a clinically relevant measure muscle function, which would be particularly useful for patients unable or unwilling to perform grip strength tests.
Table 5 shows some cut-off points available from the sarcopenia literature, based on normative populations when available or on predictive populations when normative population data were unavailable.
Diagnosis of sarcopenia: measurable variables and cut-off points
| Criterion | Measurement method | Cut-off points by gender | Reference group defined | Ref |
|---|---|---|---|---|
| Muscle mass | DXA | Skeletal muscle mass index (SMI) | Based on 2 SD below mean of young adults (Rosetta Study) | [66] |
| (Appendicular skeletal muscle mass/height2) | ||||
| Men: 7.26 kg/m2 | ||||
| Women: 5.5 kg/m2 | ||||
| SMI (ASM/height2) | Based on sex-specific lowest 20% of study group (n = 2,976) | [17] | ||
| Men: 7.25 kg/m2 | ||||
| Women: 5.67 kg/m2 | ||||
| SMI (ASM/height2) | Based on sex-specific lowest 20% (Health ABC Study) | [68] | ||
| Men: 7.23 kg/m2 | ||||
| Women: 5.67 kg/m2 | ||||
| Residuals of linear regression on appendicular lean mass adjusted for fat mass as well as height | Based on sex-specific lowest 20% (Health ABC Study) | [68] | ||
| Men: −2.29 | ||||
| Women: −1.73 | ||||
| BIA | SMI using BIA predicted skeletal muscle mass (SM) equation (SM/height2) | Based on 2 SD below mean of young adults in study group (n = 200) | [8] | |
| Men: 8.87 kg/m2 | ||||
| Women: 6.42 kg/m2 | ||||
| SMI using absolute muscle mass, not appendicular muscle mass | Based on statistical analysis of NHANES III data on older (≥60 years) men and women | [19, 67] | ||
| (absolute muscle mass/height2) | ||||
| Men: | ||||
| Severe sarcopenia ≤8.50 kg/m2 | ||||
| Moderate sarcopenia 8.51–10.75 kg/m2 | ||||
| Normal muscle ≥10.76 kg/m2 | ||||
| Women: | ||||
| Severe sarcopenia ≤5.75 kg/m2 | ||||
| Moderate sarcopenia 5.76–6.75 kg/m2 | ||||
| Normal muscle ≥6.76 kg/m2 | ||||
| Muscle strength | Handgrip strength | Men: <30 kg | Based on statistical analysis of study group (n = 1,030) | [13] |
| Women: <20 kg | ||||
| Men: | Based on quartiles of study group (n = 5,317) | [27] | ||
| BMI ≤ 24 ≤ 29 kg | ||||
| BMI 24.1–26 ≤ 30 kg | ||||
| BMI 26.1–28 ≤ 30 kg | ||||
| BMI > 28 ≤ 32 kg | ||||
| Women: | ||||
| BMI ≤ 23 ≤ 17 kg | ||||
| BMI 23.1–26 ≤ 17.3 kg | ||||
| BMI 26.1–29 ≤ 18 kg | ||||
| BMI > 29 ≤ 21 kg | ||||
| Physical performance | SPPB | SPPB ≤8 | SPPB score is a summation of scores on three tests: Balance, Gait Speed and Chair Stand. Each test is weighted equally with scores between 0 and 4—quartiles generated from Established Populations for Epidemiologic Studies of the Elderly (EPESE) data (n = 6,534). The maximum score on the SPPB is 12 | [62] |
| SPPB 0–6 Low performance | ||||
| SPPB 7–9 Intermediate performance | ||||
| SPPB 10–12 High Performance | ||||
| Gait speed | 6-m course | Based on statistical analysis of Health ABC participant data | [63] | |
| GS <1 m/s | ||||
| 6-m course | Based on ROC curves analysis of Health ABC data | [63] | ||
| GS <1.175 m/s | ||||
| 15-ft (4.572 m) course | Based on quartiles of study group (n = 5,317) | [27] | ||
| Men: | ||||
| Height ≤ 173 cm ≥ 7 s (GS < 0.65 m/s) | ||||
| Height > 173 cm ≥ 6 s (GS < 0.76 m/s) | ||||
| Women: | ||||
| Height ≤ 159 cm ≥ 7 s (GS < 0.65 m/s) | ||||
| Height > 159 cm ≥ 6 s (GS < 0.76 m/s) | ||||
| 4-m course | Based on statistical analysis of study group (n = 1,030) | [13] | ||
| GS <0.8 m/s | ||||
| 8-ft (2.438 m) course | Based on SPPB values | |||
| Quartiles of performance: | ||||
| ≤0.43 m/s | ||||
| 0.44–0.60 m/s | ||||
| 0.61–0.77 m/s | ||||
| ≥0.78 m/s |
Sarcopenia screening and assessment
Identifying subjects with sarcopenia, both for clinical practice and for selection of individuals for clinical trials, seems to be an important task. The EWGSOP has developed a suggested algorithm based on gait speed measurement as the easiest and most reliable way to begin sarcopenia case finding or screening in practice (Figure 2). A cut-off point of >0.8 m/s identifies risk for sarcopenia [70].
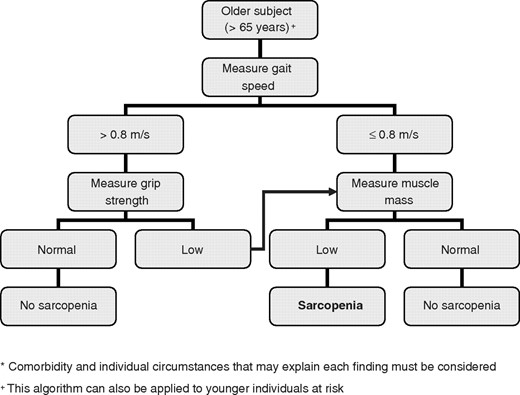
EWGSOP-suggested algorithm for sarcopenia case finding in older individuals.
Treatment outcomes for research
While reduced mobility and functionality are increasingly prevalent in older people, only a handful of clinical trials are under way to test potential sarcopenia treatments. The absence of standardised primary outcomes is a major challenge for the design of such studies. For intervention trials, EWGSOP presently recommends three primary outcome variables—muscle mass, muscle strength and physical performance (Table 6). Other outcomes can be considered secondary and of particular interest in specific research areas and intervention trials.
Suggested primary and secondary outcome domains for intervention trials in sarcopenia
| Primary outcome domains |
| • Physical performance |
| • Muscle strength |
| • Muscle mass |
| Secondary outcome domains |
| • Activities of daily living (ADL; basic, instrumental) |
| • Quality of life (QOL) |
| • Metabolic and biochemical markers |
| • Markers of inflammation |
| • Global impression of change by subject or physician |
| • Falls |
| • Admission to nursing home or hospital |
| • Social support |
| • Mortality |
For each of these outcomes, one or more variables can be measured. Selection of measurement tools for research studies will depend on availability, access to data for relevant reference populations (considering age, gender and ethnicity), type of study (longitudinal vs cross-sectional), aim of the study and cost.
Challenges of managing sarcopenia
Depending on the literature definition used for sarcopenia, the prevalence in 60–70-year-olds is reported as 5–13%, while the prevalence ranges from 11 to 50% in people >80 years [71]. The number of people around the world aged ≥60 years was estimated at 600 million in the year 2000, a figure that is expected to rise to 1.2 billion by 2025 and 2 billion by 2050 [72]. Even with a conservative estimate of prevalence, sarcopenia affects >50 million people today and will affect >200 million in the next 40 years.
The impact of sarcopenia on older people is far reaching; its substantial tolls are measured in terms of morbidity [73], disability [67], high costs of health care [74] and mortality [75]. Because the consequences of sarcopenia in older people are serious and life-changing, health care professionals everywhere are challenged to work together to turn our growing body of knowledge into actions that will improve the health and wellbeing of millions of older people around the world.
Once an operational definition of sarcopenia is adopted and included in the mainstream of comprehensive geriatric assessment, the next steps are to define the natural course of sarcopenia and to develop and define effective treatment. To this end, the ESWGOP committee members and their allied organisations encourage health care professionals to seek answers to the following questions:
What is the role of nutrition in prevention and treatment of age-related sarcopenia? What amounts of macronutrients are needed for older people with or at risk for sarcopenia, especially protein and specific amino acids? What micronutrients, e.g. vitamin D, play important roles in protecting and building lean body mass? And does the timing for intake of meals and/or dietary supplements make a difference?
What is the role of physical activity in prevention and treatment of sarcopenia in older people? What exercises are best suited and most effective for older people? How can older people be enabled to take more habitual physical activity? For people who have marked physical limitations, are there alternatives to traditional exercise programmes? How can nutrition and exercise regimens be combined for prevention of treatment of sarcopenia?
Do any specific medications have sufficient evidence-based support for treatment of sarcopenia? If not, what are the current candidate drugs? What study designs and outcome measures will be acceptable for drug labelling?
Summary and conclusions
Several European organisations working in nutrition and geriatric medicine created a joint European Working Group on Sarcopenia in Older People (EWGSOP). This final EWGSOP paper offers a working definition of sarcopenia, summarises what is currently known about underlying mechanisms and reviews techniques for measuring variables of sarcopenia. This paper also offers guidelines for use of these tools as a way to identify sarcopenia and evaluate treatment effectiveness, and offers advice about which tools are best suited for clinical practice and for research studies. Further, examples of currently used cut-off points for the diagnosis of sarcopenia are offered. Based on increased awareness of sarcopenia in older people and widespread use of tools for screening and assessment, the ultimate goal is to identify dietary strategies, lifestyle changes and treatments that can prevent or delay the onset of sarcopenia.
Key points
Age-related sarcopenia is common and has huge personal and financial costs.
This paper presents a clinical definition and consensus diagnostic criteria for sarcopenia, as developed by the European Working Group on Sarcopenia in Older People (EWGSOP) and endorsed by four participating professional medical societies.
The overall goal was to compile a set of tools that would promote recognition and treatment of age-related sarcopenia in practice and also encourage conduct of well-designed research studies of its causes and consequences.
We would like to thank Dr Cecilia Hofmann, medical writer, for her assistance in preparing the final version of the manuscript. She provided library and bibliography management support, edited the draft prepared by committee members and formatted the manuscript for publication.
Grant support: The EUGMS received a grant from Abbott Nutrition International (ANI) to fund the European Working Group on Sarcopenia in Older People (EWGSOP). This grant was used for operational activities of the EUGMS and for funding the three meetings of the Working Group. Abbott had no role in the choice of members of the group, but had the right to have an observer member at the meetings. Members of the Working Group received no salary or other incomes from the EUGMS, ANI or any other organisation for any of the tasks involved in the preparation of this manuscript or for attending the meetings of the group.
References
Author notes
Endorsed by the European Geriatric Medicine Society (EUGMS), the European Society for Clinical Nutrition and Metabolism (ESPEN), the International Association of Gerontology and Geriatrics—European Region (IAGG-ER) and the International Association of Nutrition and Aging (IANA).

Comments