


Abstract
research on the role of positive affect, such as happiness, on health outcomes is burgeoning. Within this context, evidence for an inverse effect of happiness on mortality is inconclusive. Furthermore, few studies link happiness with mortality among older people, and in Asian populations. We examine the association between happiness and all-cause mortality among older people in Singapore.
data for 4,478 Singaporeans aged ≥60 years enrolled in a nationally-representative longitudinal survey (three waves: 2009; 2011; 2015) were utilised. Happiness, at baseline, in 2009, was measured using three positively-worded items from the Centre for Epidemiological Studies Depression Scale, and considered in two distinct ways in the analyses—continuous (‘happiness score’ [0–6]) and binary (happy [score = 6]/unhappy). All-cause mortality, until 31 December 2015, was assessed primarily using administrative databases, supplemented by data from survey waves 2 and 3. Multivariable Cox regression models assessed the association of ‘happiness score’ and the ‘binary happiness variable’ (separate models for each) with all-cause mortality.
the likelihood of all-cause mortality was lower by 9% (multivariable hazard ratio (HR) [95% confidence interval]: 0.91 [0.87–0.95]) for each unit increase in ‘happiness score’, and was 19% lower for happy, versus unhappy, older people (HR: 0.81 [0.68–0.97]).
happiness is associated with reduced likelihood of all-cause mortality among older people in an Asian population, with the benefit observed even for incremental increases in happiness. Activities, policies and programs that maintain or improve happiness may be beneficial for a longer life among older people.
Introduction
There is a growing interest in the role that positive affect plays in improving population health [1]. Many studies report positive affect to be associated with better health outcomes, such as lower mortality, reduced morbidity and functional independence, in both community-dwelling and clinical populations [2–10]. However, evidence for an inverse effect of happiness, a form of positive affect, on mortality is inconclusive [2, 6–9, 11–14].
The key to the inconsistency in the association of happiness with mortality is the variability in controlling for confounders across studies. For example, in a study of over 700,000 English and Scottish women, the association between happiness and mortality was not seen after adjustment for socio-demographic, lifestyle and health factors [2]. Similarly, a 15-year follow-up study of 861 Dutch older persons aged 65–85 years observed that the inverse link between happiness and mortality was not statistically significant after adjustment for physical activity and prevalent morbidity [8]. Furthermore, in studies that report this association, psychosocial variables, such as loneliness [15] and social networks [16], which are potential confounders, are frequently not accounted for [2, 7–9, 11].
Another limitation of existing studies on happiness and mortality is the generalisability of their findings only to certain populations. Firstly, only a few studies have focused exclusively on older people [8, 13], i.e. individuals aged 60 years or older. Secondly, most of the studies that do report the association of interest are from Western countries, hence, constraining the findings to this socio-cultural context. Cross-cultural research suggests that the value and consequences of happiness may differ across cultures [17]. For instance, East Asians are more inclined than Westerners to think that it is not appropriate to express happiness in many social situations [17]. Another study found that positive emotions were associated with depressive symptoms among European Americans and Asian Americans but not immigrant Asians [18]. Therefore, studying the association of happiness with mortality among older people in an Asian country would expand the scope of the extant literature examining this association.
In addressing the above mentioned limitations, we assessed if happiness is associated with all-cause mortality in a nationally-representative sample of older people in Singapore, a Southeast Asian nation. Furthermore, given the variability in the associations of positive affect with mortality by age [5, 19] and by sex [20], we investigated if age or sex moderate the association between happiness and all-cause mortality.
Method
Study design and participants
Data from a nationally-representative longitudinal survey (Panel on Health and Ageing among Singaporean Elderly [PHASE]; Wave 1 in 2009, Wave 2 in 2011–2012 and Wave 3 in 2015) of community-dwelling older people in Singapore, combined with information on their date of death, until 31 December 2015, from the national Registry of Births and Deaths databases, were utilised. Details of Wave 1 are available elsewhere [21]—briefly, 4,990 Singapore citizens and permanent residents aged 60 years or older living at home (or their proxy respondents, if unable to respond due to health reasons) were surveyed. Of these, 3,103 and 1,572 participants were re-interviewed at Waves 2 and 3, respectively. The Institutional Review Board at the National University of Singapore ethics approved the longitudinal survey and matching with the deaths databases. Our analytical sample was restricted to 4,478 of the 4,990 Wave 1 participants, after sequentially excluding those with: (1) missing value for happiness (n = 460; participants unable to respond themselves due to their ill-health had a proxy respondent, who did not answer the items on happiness), (2) severe cognitive impairment (n = 9; score>seven on the Short Portable Mental Status Questionnaire [22]; uncertainty of self-report of happiness) and (3) mortality within 6 months of their Wave 1 interview (n = 43; confounding due to asymptomatic life-limiting diseases).
Happiness
Happiness is better assessed using the frequency, than intensity, of a positive affect [23]. At Wave one, participants were asked how often in the past week (Never or Rarely: 0; Sometimes: 1; Often: 2) they experienced the following: ‘I felt happy’, ‘I enjoyed life’ and ‘I felt hope about the future’, using a 12-item version of the Centre for Epidemiological Studies Depression Scale (CES-D) [24]. Previous studies have used the ‘positive’ items from the CES-D to measure happiness specifically [16], and positive affect in general [4, 10, 25, 26]. While most of these studies use four positive items from the CES-D, the 12-item CES-D used in PHASE did not include the item ‘I felt I was just as good as other people’. Exploratory factor analysis of the 12-item CES-D scale, verifying the structural validity of grouping the three items in our data, supported a 2-factor model, with the three items having factor loadings ≥0.5 for a common factor (not shown; available on request).
A review of studies linking positive psychological well-being with mortality suggested that findings vary with how the variable for well-being is considered in the analysis [3]. Thus, to check the robustness of our association of interest, we operationalised happiness in two distinct ways: (1) a continuous ‘happiness score’ (sum of scores on the three items; range: 0–6; higher value indicates a greater extent of happiness), and (2) a ‘binary happiness variable’ (happy [happiness score = 6]/unhappy [happiness score≤5]). In sensitivity analysis, detailed in Appendix 1, available in Age and Ageing online, we operationalised happiness in alternate ways, such as using an alternative cut-off (≥5) for the ‘binary happiness variable’.
All-cause mortality
We assessed all-cause mortality, until 31 December 2015, using the national Registry of Births and Deaths databases, supplemented by data collected during survey Waves 2 and 3.
Confounders
Our analysis controlled for a range of demographic, lifestyle, health and social variables of participants at Wave 1 (details of confounders are presented in Appendix 2, available in Age and Ageing online).
Statistical analysis
The confounders were summarised with sampling weights, by ‘binary happiness variable’ (happy/unhappy) and all-cause mortality until 31 December 2015 (alive/dead). We assessed the statistical significance of differences, across happy/unhappy and across alive/dead, using student’s t-test and chi-square test for continuous and categorical variables, respectively. Kaplan–Meir estimates were used to generate unadjusted survival curves by ‘binary happiness variable’; the two curves were compared using the log-rank test. Univariable and multivariable (adjusting for all confounders) associations (hazard ratios [HR] and associated 95% confidence intervals [CI]) of the ‘happiness score’ and the ‘binary happiness variable’ with all-cause mortality were assessed using Cox regression analysis. In the multivariable models, we introduced cross-product terms for age (as 60–74/≥75) and sex with the happiness variable to assess for moderation; the terms were retained only if they were significant. Finally, we tested for a non-linear association between ‘happiness score’ and all-cause mortality using restricted cubic splines with four knots in multivariable Cox regression analysis; the first knot (score = 0) was used as the reference. In sensitivity analysis, the multivariable association of the alternative operationalisations of happiness with all-cause mortality were assessed. All analyses were performed using the SAS statistical package version 9.4 (Statistical Analysis System Inc., Cary, NC), except for the restricted cubic spline plots, which were fitted in Stata version 14 (Stata Corporation, College Station, Texas, USA). A P-value of <0.05 was considered statistically significant.
Results
The average follow-up duration was 6.2 ± 1.4 years, and the average ‘happiness score’ was 4.16 ± 1.66. Of the 4,478 older people in the analytical sample, 1,486 (33.2%) were happy. All considered confounders, except body mass index category, were associated with the ‘binary happiness variable’. A total of 813 (18.2%) participants died until 31 December 2015. Again, all considered confounders were associated with all-cause mortality (Appendix 3, available in Age and Ageing online).
Among the 1,486 happy older people, a total of 217 (14.6%) deaths were observed until 31 December 2015. The corresponding proportion was higher (19.9%; n = 596) among the 2,992 unhappy older people. There was a significant difference in the unadjusted survival curves between happy and unhappy older people (log-rank test P < 0.001); the curve for happy older people was higher through the follow-up (Figure 1).
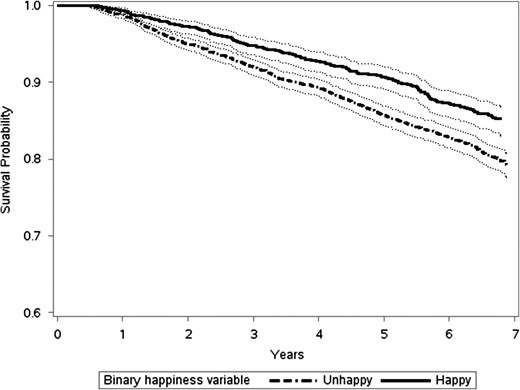
Kaplan–Meier survival curves (with 95% Confidence Limits) by ‘binary happiness variable’ (Happy/Unhappy).
Cox regression analysis revealed a significant inverse association of happiness with all-cause mortality. Compared to unhappy older people, those happy had a 19% reduced likelihood of all-cause mortality (multivariable HR [95% CI]: 0.81 [0.68–0.97]). Further, for each unit increase in ‘happiness score’, the likelihood of all-cause mortality was reduced by 9% (multivariable HR [95% CI]: 0.91 [0.87–0.95]) (Table 1 and Appendix 4, available in Age and Ageing online). In either multivariable analysis, the cross-product terms for age and sex with the variable for happiness were not significant. The linear association of ‘happiness score’ with the likelihood of all-cause mortality was confirmed by the restricted cubic spline regression (P-value for non-linearity = 0.87) (Appendix 5, available in Age and Ageing online). Inverse associations of happiness with all-cause mortality were also observed in the sensitivity analysis (Appendix 1, available in Age and Ageing online).
Association of ‘binary happiness variable’ and ‘happiness score’ with all-cause mortality, Cox regression analysis
| Binary happiness variable | For each unit increase in ‘happiness score’ | ||
|---|---|---|---|
| Unhappy | Happy | ||
| Univariable hazard ratio (95% CI) | Reference | 0.71 (0.61-0.83)*** | 0.89 (0.85-0.93)*** |
| Multivariable hazard ratio (95% CI)a | Reference | 0.81 (0.68-0.97)* | 0.91 (0.87-0.95)*** |
CI: Confidence Interval.
*P < 0.05, ***P < 0.001.
aAdjusted for demographic (age, sex, ethnicity, marital status, housing type, educational status and living arrangement), lifestyle (physical activity, smoking status, alcohol intake and sleep duration), health (body mass index category, self-rated health, number of chronic diseases, number of activity of daily living limitations, number of instrumental activity of daily living limitations, number of mobility limitations, depressive symptoms and cognitive impairment status) and social (loneliness and social networks) variables—multivariable hazard ratios for the covariates are provided in Supplementary Table 3, available in Age and Ageing online.
Discussion
Happy older people live longer. We observed happiness to be associated with reduced likelihood of all-cause mortality among older people. The association was consistent regardless of whether happiness was defined as a continuous or a binary variable, observed even after adjusting for a range of demographic, lifestyle, health and social variables. Furthermore, the association did not vary by age or by sex, and was present even when happiness was operationalised alternatively in our sensitivity analysis. Our finding not only supports the growing literature linking happiness with lower mortality [7, 9, 11], but also extends it to older people and Asian populations. In fact, we posit that the true association of happiness with mortality may even be stronger than observed in our study; given reports of the limited expression of happiness among East Asians [17], it is possible that the extent of happiness was underreported by our study participants, resulting in estimates that are closer to the null.
While acknowledging the presence of a bi-directional relationship of happiness with health and lifestyle factors, the potential pathways that link happiness with a reduced likelihood of mortality could be through improved physical and mental health as well as maintenance of a healthy lifestyle, such as adequate sleep and physical activity [5, 27]. The theorised underlying physiological or biological mechanisms include those involving cardiovascular function, immunologic function and hypothalamic–pituitary–adrenal axis [5]. Many of the proposed biological mechanisms are based on experimental studies that artificially manipulated positive affect in laboratory settings; studies that examine if such controlled changes in positive affect are mirrored in real-world settings are warranted [5].
The variability in the conceptualisation and measurement of happiness make it difficult to directly compare the association of happiness with health outcomes across studies. For example, happiness has been conceptualised to comprise evaluative well-being (e.g. life satisfaction), hedonic well-being (e.g. everyday feelings or mood, such as happiness) and eudemonic well-being (e.g. meaning and purpose of life) [28]. Likewise, there are several approaches for measuring happiness, the common ones being the use of all or a subset of questions of a structured well-being scale [8, 11], positive items on the CES-D scale [4, 10, 19, 25, 26, 29] and single-item scales [2, 9]. For reasons stated in the Method section, we measured happiness using three positive items on the CES-D scale. Nonetheless, given concerns that these items may not be solely assessing happiness but also tapping into other constructs, such as optimism [5], we performed sensitivity analyses to separately examine the association of the items representing hedonic happiness (‘I felt happy’, ‘I enjoyed life’) and hope (‘I felt hope about the future’) on all-cause mortality, and found similar inverse associations with mortality in these analyses.
Compared to the six studies that have assessed the association of the positive items on the CES-D scale with mortality, our observed findings are largely similar [4, 10, 19, 25, 26, 29]. Two of the studies, among older persons, observed an inverse association of the positive items on the CES-D scale with mortality in their entire sample [4, 25], while two more observed it only in sub-populations, such as older persons aged 61–80 years and persons with diabetes [10, 19]. A recent study observed the inverse relationship among older persons before controlling for other subjective health measures, such as quality of life [26]. Only one study, not exclusive to older persons, reported a null finding [29]. Thus, studies on older persons have consistently found an inverse association between positive affect, as measured on the CES-D scale, with mortality. This suggests that older persons may especially benefit from increases in positive effect.
Our study finding, coupled with findings from previous studies demonstrating ways to enhance happiness [30, 31], has implications for both older people and policymakers striving to increase life expectancy. At an individual level, older people may have longevity benefits through participating in activities shown to increase happiness or psychological well-being—such as expressing gratitude, a daily focus on the ‘good’ things that happen to them through the day, and identifying and utilising one’s strength of character [30, 31]. Suggestions for policymakers to help individuals live happier lives include promotion of community engagement, encouragement of strong social networks, provision of a decent material standard of living, fostering of freedom and democracy, and good governance [9, 12].
Our study has several strengths. In addition to our focus on older people residing in an Asian country, our inclusion of a wide range of confounders is a key strength. An important limitation in previous studies is the exclusion or inadequate measurement of health-related confounders in analyses linking happiness and mortality [2]. To counter this, we controlled for several health and health-risk (lifestyle) variables. We also controlled for psychosocial variables of loneliness [15] and social networks [16], which are not often considered in most studies [2, 7–9, 11]. Other strengths include the use of a nationally-representative sample and the comprehensive assessment of mortality using national administrative databases.
The study also has its limitations. Firstly, physical activity was operationalised through a simple question (whether respondents go for a walk for exercise purposes), suggesting the possibility of residual confounding by physical activity status. However, inclusion of questions on limitations in mobility, activities of daily living (ADLs) and instrumental ADLs would have likely reduced such residual confounding. Secondly, except for most of the demographic variables, adjusting for the lifestyle, health and social variables may be considered as over-adjusting given their potential to be on the causal pathway between happiness and mortality. For example, happiness affects health, and good health has found to predict subsequent positive affect [28]. However, for many of the variables, such as physical activity, alcohol intake and social networks, empirical data suggests their causal association with feelings of happiness [32–35] and with mortality [36–38]. Thus, we adjusted for them as confounders. Thirdly, while we attempt to mitigate unmeasured confounding either due to undiagnosed or unreported life-limiting health conditions or due to lack of information on severity of known health conditions by excluding deaths within six months of the baseline interview, we do acknowledge the presence of residual confounding. Fourthly, we did not have access to data on the cause of death from the administrative databases, thus, we are unable to examine the association of happiness with cause-specific mortality. Fifthly, we had a relatively short follow-up term for our cohort; it will be of interest to see if the associations are maintained in the long-term. Similarly, we were only able to consider the baseline status of happiness. Larger studies, with longer follow-up durations should explore the association of change in happiness with mortality. Finally, we assessed chronic diseases through the self-report of ever-diagnosis by a medical professional, which may underestimate the number of chronic diseases. However, given the high rates of screening for chronic diseases in Singapore [39], the undetected number of chronic diseases is unlikely to be large.
In conclusion, happy older people live longer. Given our finding of a linear association between happiness and reduced all-cause mortality, even small increments in happiness may be beneficial for older people. Activities, policies and programs that maintain or improve happiness may contribute to a longer life among older people.
Only few existing studies linking happiness with reduced mortality focus exclusively on older people. Further, all studies reporting this link are from Western countries.
This study is the first to report this link in a representative sample of older people residing in Singapore, an Asian country.
Happiness is associated with reduced likelihood of all-cause mortality among older Singaporeans.
The benefit is observed even for incremental increases in happiness.
Acknowledgements
We thank Mary Ann C. Bautista for her assistance in editing the final draft of the manuscript.
Conflicts of interest
None.
Funding
Waves 1, 2 and 3 of the Panel on Health and Ageing among Singaporean Elderly (PHASE) have been funded or supported by the following sources: Ministry of Social and Family Development, Singapore; Singapore Ministry of Health’s National Medical Research Council under its Singapore Translational Research Investigator Award ‘Establishing a Practical and Theoretical Foundation for Comprehensive and Integrated Community, Policy and Academic Efforts to Improve Dementia Care in Singapore’ (NMRC-STAR-0005-2009), and its Clinician Scientist—Individual Research Grant—New Investigator Grant ‘Singapore Assessment for Frailty in Elderly-Building upon the Panel on Health and Aging of Singaporean Elderly’ (NMRC-CNIG-1124-2014); and Duke-NUS Geriatric Research Fund. The content including the methods, findings and results are solely the authors’ responsibility and do not represent the endorsement and views of the funding sources.

Comments