


Abstract
Trauma places a significant burden on healthcare services, and its management impacts greatly on the injured patient. The demographic of major trauma is changing as the population ages, increasingly unveiling gaps in processes of managing older patients. Key to improving patient care is the ability to characterise current patient distribution.
There is no contemporary evidence available to characterise how age impacts on trauma patient distribution at a national level. Through an analysis of the Trauma Audit Research Network (TARN) database, we describe the nature of Major Trauma in England since the configuration of regional trauma networks, with focus on injury distribution, ultimate treating institution and any transfer in-between.
The TARN database was analysed for all patients presenting from April 2012 to the end of October 2017 in NHS England.
About 307,307 patients were included, of which 63.8% presented directly to a non-specialist hospital (trauma unit (TU)). Fall from standing height in older patients, presenting and largely remaining in TUs, dominates the English trauma caseload. Contrary to perception, major trauma patients currently are being cared for in both specialist (major trauma centres (MTCs)) and non-specialist (TU) hospitals. Paediatric trauma accounts for <5% of trauma cases and is focussed on paediatric MTCs.
Within adult major trauma patients in England, mechanism of injury is dominated by low level falls, particularly in older people. These patients are predominately cared for in TUs. This work illustrates the reality of current care pathways for major trauma patients in England in the recently configured regional trauma networks.
Key points
There is no contemporary evidence available to characterise how age impacts on trauma patient distribution at a national level.
Within adult major trauma patients in England, mechanism of injury is dominated low falls, particularly in older people.
TUs receive the majority of trauma patients, not MTCs, as is the common perception.
Introduction
Annually 16,000 people die as a result of trauma in England and Wales, and non-fatal injuries pose an additional burden on health services, equivalent to £50,000 per patient [1]. The typical trauma patient is changing from young and male to older with a lower degree of male predominance, reflecting major changes in injury causation, imaging practices and to a degree the impact of an ageing population [2]. This shift occasions is not just a change in age but also in case complexity and societal demand on rehabilitation services [2, 3].
This trauma burden is not homogenous. Patients present to a variety of hospitals, not all to specialist teams at specialist facilities. Thus, a well-functioning clinical network is key to safe and effective patient care. Patient age affects both presentation and management, largely due to ‘stealth trauma’, which is perceived to result in under-triage in older people [4]. This situation is far from straightforward; the optimal management of older patients with traumatic brain injury or intracranial haematomas on scan, for example, is subject of debate. [5] The population of older injured continues to grow and increasingly demand clinical resource and organisational infrastructure, although to date, exact impact in numbers and hospital burden is unclear [6].
A need exists to look across the entire major trauma population to assess age and distribution of injured patients and how patient distribution might impact future healthcare.
The most effective way to perform this is to appraise the national clinical database that underpins data collection from trauma systems in England. Central to understanding the impact of this dataset is an appreciation of how trauma care has changed since the introduction of trauma networks in 2012. Previously, injured patients were taken to the nearest hospital, regardless of severity and nature of the index trauma and also irrespective of resources and skillset of that given hospital to provide resuscitation and/or ongoing definitive care. Two key publications detailed discrepancies in care and identified key issues with previous systems, stimulating political awareness and engendering change into the current system of care [7, 8].
Since 2012 major trauma care has used a ‘hub and spoke’ model, consisting of regional networks of major trauma centres (MTCs) and satellite trauma units (TUs) and local emergency hospitals (LEHs). There is now a system in which a proportion of patients with appropriate injuries ‘bypass’ local hospitals to be treated at specialist centres. [9] This has created a perception that the bulk of care is being performed in MTCs and that outcomes in terms of mortality may differ between the hub and spoke. It is therefore important that care pathways and outcomes for high and low energy major trauma are characterised and compared with these impressions.
Objectives
Through an analysis of the Trauma Audit Research Network (TARN) database, we aim to characterise the injured population of England, primarily focussing on care pathway distribution, ultimate treating institution and any transfer in-between. The cohort within each pathway will be characterised by injury severity, comorbidity and injury mechanism. It is intended that the findings inform resource allocation and provisions of expertise across trauma networks. Analysis of the TARN database underpins several key elements influencing contemporary UK trauma care. Enabling overview of all domains of care of the trauma patient, regardless of age, the database has been interrogated to enable assessment of a variety of key areas of care. Brain injury management is an example of its use in the older patient population [10]. The database is also informing pathways of care in older orthopaedic patients as well as the generic reflection on changing patterns in survival and trauma demographic [2, 6]. TARN has been measuring trauma care and outcomes for over 25 years and is well placed to reflect on the relatively recent establishment of the Major Trauma service in the UK, the subject by which this work is defined [11, 12].
Methods
The TARN database was analysed for all patients presenting to English hospitals from April 2012 to the end of October 2017. TARN collects data on patients suffering from trauma in England and Wales, Ireland and some hospitals from Continental Europe. TARN includes patients who are admitted to hospital for 3 or more days, require critical care resources, who are transferred for further care or who die from their injuries. Isolated injuries, including fractures of the pubic ramus and proximal femur in patients aged >65 years or isolated closed limb fractures, are specifically excluded.
Patients were compared by care pathway in terms of 1st and 2nd treating hospitals and by demographics, injury mechanism, severity (Injury Severity Score (ISS)), physiology at arrival to hospital (including Glasgow Coma Score (GCS)) and mortality, where known at discharge. There is no overlap within these pathways as patients can only feature once within the database.
Basic parametric (95% confidence limits) and non-parametric (interquartile ranges) descriptors were used to demonstrate the nature of case presentation across participating units. Some NHS England hospitals with Type 1 emergency departments are not MTCs or TUs—these are referred to as local emergency hospitals (LEHs). LEH will not normally receive patients identified by ambulance services as having sustained major trauma, but these patients may self-present to LEHs. Most LEHs therefore still submit data to TARN.
Distribution of cases by hospital and transfer.
Statistical analysis
All analyses were performed using statistical software (Stata 14.2, StataCorp. 2015. Stata Statistical Software: Release 14. College Station, TX: StataCorp LP). Patients were grouped into six categories according to flow between treating institutions as well as isolating those patients treated at one institution only.
Only univariate analyses were considered. For continuous data, difference in medians were analysed by Kruskal–Wallis test and post-hoc analysis using Dunn’s test with Bonferroni adjustment for multiple comparisons. This adjustment is used to counteract the problem of Type I error that occurs when multiple comparisons are made. Association between categorical data was evaluated by the χ2 test and a post-hoc analysis using adjusted residuals with Bonferroni adjustment which will detect the cells that contributed to the overall χ2. A two-sided P value of 0.05 was considered statistically significant [13].
TARN contains no patient identifiable data and holds approval from the UK Health Research Authority (section 251 PIAG) for analysis of the anonymised data for which it is custodian.
Results
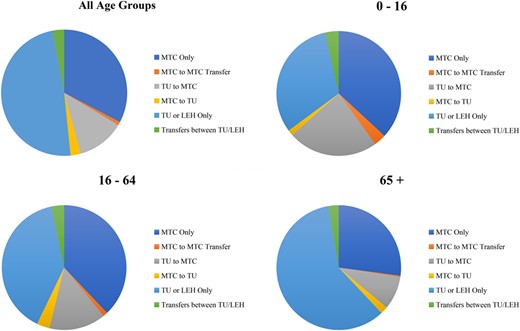
About 307,307 patients presented to hospitals in England during the study period, of whom 196,250 (63.9%) presented directly to a TU or LEH, although this percentage varied by age (Figure 1). Eighty-one percent of major trauma patients (249,838) were cared for solely in hospital of first presentation. The majority (65.5%) of transfers occurred from TUs as first hospital to a MTC. The overall median age of patients was 63.6 years in the study sample, overall 55.1% male; whilst the median age is 56.6 years for those solely cared for in an MTC, 60% being male. Patients cared for outside of MTCs are significantly older at 72.1 years and predominately (53.2%) female (Table 1).
Patients recorded as being admitted to hospitals in England, 2012–2017 (all patients)
| MTC only | MTC to MTC transfer only | TU to MTC | MTC to TU | TU or LEH only | Transfer between TUs/LEH | Total | P-value | |
|---|---|---|---|---|---|---|---|---|
| 100,461 | 2,664 | 37,651 | 7,932 | 149,377 | 9,222 | 307,307 | ||
| Median agea | 56.6 (33.2–78.0) | 38.0 (20.2–57.4) | 52.5 (29.7–71.5) | 53.8 (33.9–73.4) | 72.1 (53.5–84.9) | 59.9 (37.0–78.3) | 63.6 (42.2–81.7) | <0.0001 |
| Male, % | 60.8 | 73.2 | 68.5 | 66.5 | 46.8 | 58.5 | 55.1 | <0.0001 |
| 65+, % | 39.5 | 16.7 | 33.9 | 35.3 | 58.2 | 42.4 | 47.8 | <0.0001 |
| Median ISSb | 10 (9–21) | 22 (13–29) | 16 (9–25) | 20 (9–29) | 9 (8–13) | 9 (8–16) | 9 (9–17) | <0.0001 |
| GCS | ||||||||
| 3 | 4 | 6 | 2.8 | 5.3 | 1.2 | 0.7 | 2.5 | <0.0001 |
| 4–8 | 4.2 | 12.3 | 3.5 | 9.7 | 0.9 | 1.1 | 2.6 | |
| 9–12 | 4.6 | 8.7 | 4.7 | 8.8 | 1.8 | 1.6 | 3.3 | |
| 13–15 | 83.2 | 64.6 | 76 | 67.9 | 90.1 | 76.5 | 84.9 | |
| Not recorded | 3.9 | 8.4 | 13 | 8.4 | 6 | 20.2 | 6.7 | |
| RTC, % | 28.8 | 34.5 | 24.7 | 45.4 | 11.8 | 17.4 | 20.2 | <0.0001 |
| Fall <2 m, % | 43.9 | 26.9 | 46 | 22.8 | 72.4 | 56.8 | 57.8 | <0.0001 |
| Charlson score | ||||||||
| Not recorded | 7.7 | 5.3 | 5.1 | 8 | 6.6 | 8 | 6.8 | <0.0001 |
| 0 | 50.4 | 60.1 | 52.7 | 48.7 | 40.7 | 50 | 45.9 | |
| 1–4 | 27.4 | 24.1 | 27.4 | 30.3 | 34.3 | 27.9 | 30.8 | |
| 5–9 | 11.5 | 8.1 | 11.8 | 10.8 | 14.8 | 11.1 | 13.2 | |
| 10+ | 3 | 2.4 | 3 | 2.3 | 3.6 | 3 | 3.3 | |
| Known outcome, % | 100 | 84.5 | 84.6 | 45.8 | 100 | 70.2 | 95.7 | <0.0001 |
| Mortalityc | 8.9 (8.7–9) | 4.8 (4–5.6) | 5 (4.8–5.3) | 0.8 (0.6–1) | 6.7 (6.6–6.9) | 2.1 (1.8–2.4) | 7 (6.9–7.1) |
aInterquartile range expressed in brackets for all median age values.
bInterquartile range expressed in brackets for all median ISS values.
c95% confidence intervals expressed in brackets for all mortality values.
| MTC only | MTC to MTC transfer only | TU to MTC | MTC to TU | TU or LEH only | Transfer between TUs/LEH | Total | P-value | |
|---|---|---|---|---|---|---|---|---|
| 100,461 | 2,664 | 37,651 | 7,932 | 149,377 | 9,222 | 307,307 | ||
| Median agea | 56.6 (33.2–78.0) | 38.0 (20.2–57.4) | 52.5 (29.7–71.5) | 53.8 (33.9–73.4) | 72.1 (53.5–84.9) | 59.9 (37.0–78.3) | 63.6 (42.2–81.7) | <0.0001 |
| Male, % | 60.8 | 73.2 | 68.5 | 66.5 | 46.8 | 58.5 | 55.1 | <0.0001 |
| 65+, % | 39.5 | 16.7 | 33.9 | 35.3 | 58.2 | 42.4 | 47.8 | <0.0001 |
| Median ISSb | 10 (9–21) | 22 (13–29) | 16 (9–25) | 20 (9–29) | 9 (8–13) | 9 (8–16) | 9 (9–17) | <0.0001 |
| GCS | ||||||||
| 3 | 4 | 6 | 2.8 | 5.3 | 1.2 | 0.7 | 2.5 | <0.0001 |
| 4–8 | 4.2 | 12.3 | 3.5 | 9.7 | 0.9 | 1.1 | 2.6 | |
| 9–12 | 4.6 | 8.7 | 4.7 | 8.8 | 1.8 | 1.6 | 3.3 | |
| 13–15 | 83.2 | 64.6 | 76 | 67.9 | 90.1 | 76.5 | 84.9 | |
| Not recorded | 3.9 | 8.4 | 13 | 8.4 | 6 | 20.2 | 6.7 | |
| RTC, % | 28.8 | 34.5 | 24.7 | 45.4 | 11.8 | 17.4 | 20.2 | <0.0001 |
| Fall <2 m, % | 43.9 | 26.9 | 46 | 22.8 | 72.4 | 56.8 | 57.8 | <0.0001 |
| Charlson score | ||||||||
| Not recorded | 7.7 | 5.3 | 5.1 | 8 | 6.6 | 8 | 6.8 | <0.0001 |
| 0 | 50.4 | 60.1 | 52.7 | 48.7 | 40.7 | 50 | 45.9 | |
| 1–4 | 27.4 | 24.1 | 27.4 | 30.3 | 34.3 | 27.9 | 30.8 | |
| 5–9 | 11.5 | 8.1 | 11.8 | 10.8 | 14.8 | 11.1 | 13.2 | |
| 10+ | 3 | 2.4 | 3 | 2.3 | 3.6 | 3 | 3.3 | |
| Known outcome, % | 100 | 84.5 | 84.6 | 45.8 | 100 | 70.2 | 95.7 | <0.0001 |
| Mortalityc | 8.9 (8.7–9) | 4.8 (4–5.6) | 5 (4.8–5.3) | 0.8 (0.6–1) | 6.7 (6.6–6.9) | 2.1 (1.8–2.4) | 7 (6.9–7.1) |
aInterquartile range expressed in brackets for all median age values.
bInterquartile range expressed in brackets for all median ISS values.
c95% confidence intervals expressed in brackets for all mortality values.
About 58.2% of major trauma patients cared for solely in TUs/LEH are older people (65 years and older) versus 39.5% in an MTC ((Table 1) P < 0.0001.). Demographically, 33.9% of patients transferred to an MTC from a TU were >65 years old, and transfer patients were predominantly (68.4%) male. This contrasts to 47.8% of the overall study sample being 65 years or older (Table 1).
Falls from <2 m represent the commonest causal mechanism for English trauma admissions, accounting for 57.8% of all TARN cases (Table 1). Falls from <2 m accounted for 43.9% injury mechanism in MTCs, and 72.4% in TUs, respectively.
Mortality is significantly lower in patients treated solely in TUs compared with those treated solely in MTCs (6.7% versus 8.9%, P < 0.0001). Injury and comorbidity severity profiles are similar between these two groups, but the proportion arriving with impaired conscious (presenting GCS < 13) is over three times greater at MTCs compared with TUs (12.84% versus 3.9%).
Within the transfer population, patients transferred between TUs and LEHs had the highest prevalence of falls from <2 m at 56.8%. About 46.0% of those transferred from a TU to a MTC sustained falls from <2 m, as did 43.9% of patients transferred between MTCs. Low energy falls were least prevalent in patients transferred from MTCs to TUs (22.8%, Table 1).
Numbers of paediatric trauma patients are low, forming less than 5% (147,018 of 307,307) of cases overall. These cases are less likely to be transported from scene to a TU and if so, are most likely (44% of children conveyed to a TU) to be transferred out to an MTC (Figure 1 and Table 2).
Patients recorded as being admitted to hospitals in England, 2012–2017 (reported by age group)
| Age group | MTC only | MTC to MTC transfer only | TU to MTC | MTC to TU | TU or LEH only | Transfer between TUs/LEH | Total | P-value | |
|---|---|---|---|---|---|---|---|---|---|
| 10–16 | n | 5,423 | 467 | 3,434 | 221 | 4,655 | 518 | 14,718 | |
| Median agea | 8.6 (3.1–13.1) | 8.0 (2.2–13.1) | 7.9 (2.4–12.6) | 9.3 (3.7–13.2) | 3.7 (1.7–10.5) | 5.7 (2.3–12.1) | 6.8 (2.2–12.4) | <0.0001 | |
| Male, % | 67.3 | 68.5 | 68.1 | 58.4 | 68.2 | 70.5 | 67.8 | 0.036 | |
| Median ISSb | 9 (9–17) | 17 (9–25) | 14 (9–22) | 17 (9–27) | 9 (9–9) | 9 (9–9) | 9 (9–16) | <0.0001 | |
| RTC, % | 41.1 | 39 | 29.2 | 57.9 | 13.9 | 17 | 29.2 | <0.0001 | |
| Fall <2 m, % | 29.5 | 27.8 | 37.1 | 12.2 | 59.8 | 57.3 | 41.5 | <0.0001 | |
| Mortalityc | 3.7 (3.2–4.2) | 2.4 (1–3.7) | 2.9 (2.3–3.4) | 0 (0–0) | 1.8 (1.4–2.2) | 0.4 (−0.1–0.9) | 2.8 (2.5–3) | <0.0001 | |
| 16–64 | n | 55,340 | 1,751 | 21,444 | 4,908 | 57,827 | 4,795 | 146,065 | |
| Median age | 41.9 (27.5–54.0) | 38.3 (25.9–51.2) | 42.6 (28.1–53.8) | 41.9 (28.2–53.2) | 51.3 (37.6–59.1) | 45.2 (29.2–55.9) | 46.2 (30.6–56.5) | <0.0001 | |
| Male, % | 73.3 | 77.4 | 74.7 | 75.6 | 61.2 | 70.1 | 68.7 | <0.0001 | |
| Median ISS | 13 (9–24) | 24 (14–29) | 16 (9–25) | 22 (10–32) | 9 (9–10) | 9 (5–14) | 9 (9–16) | <0.0001 | |
| RTC, % | 40.1 | 37.2 | 32.5 | 53.6 | 22.7 | 25.6 | 32.1 | <0.0001 | |
| Fall <2 m, % | 24.1 | 20 | 30.7 | 11.9 | 51.5 | 35.9 | 35.9 | <0.0001 | |
| Mortality | 5.8 (5.6–6) | 3.6 (2.7–4.5) | 3.3 (3.1–3.6) | 0.2 (0.1–0.4) | 2.7 (2.6–2.9) | 0.6 (0.4–0.9) | 3.9 (3.8–4) | <0.0001 | |
| 65+ | n | 39,698 | 446 | 12,773 | 2,803 | 86,895 | 3,909 | 146,524 | |
| Median aged | 81.6 (74.1–87.6) | 74.6 (69.1–82.1) | 77.7 (71.2–84.1) | 78.7 (72.3–84.8) | 83.4 (76.5–88.8) | 80.6 (73.6–86.7) | 82.3 (75.1–88.0) | <0.0001 | |
| Male, % | 42.6 | 61.7 | 58.1 | 51.1 | 36 | 42.6 | 40.3 | <0.0001 | |
| Median ISSe | 9 (9–18) | 25 (14–26) | 17 (9–25) | 17 (9–25) | 9 (5–14) | 9 (9–16) | 9 (9–16) | <0.0001 | |
| RTC, % | 11.2 | 19.3 | 10.4 | 30.1 | 4.5 | 7.4 | 7.4 | <0.0001 | |
| Fall <2 m, % | 73.5 | 52.7 | 73.9 | 42.8 | 86.9 | 82.2 | 81.3 | <0.0001 | |
| Mortalityf | 13.9 (13.5–14.2) | 11.9 (8.9–14.9) | 8.5 (8–9) | 1.9 (1.4–2.4) | 9.6 (9.5–9.8) | 4.1 (3.4–4.7) | 10.5 (10.4–10) | <0.0001 |
aBrackets express interquartile range.
bBrackets express interquartile range.
cBrackets express 95% confidence intervals.
dBrackets express interquartile range.
eBrackets express interquartile range.
fBrackets express 95% confidence intervals.
| Age group | MTC only | MTC to MTC transfer only | TU to MTC | MTC to TU | TU or LEH only | Transfer between TUs/LEH | Total | P-value | |
|---|---|---|---|---|---|---|---|---|---|
| 10–16 | n | 5,423 | 467 | 3,434 | 221 | 4,655 | 518 | 14,718 | |
| Median agea | 8.6 (3.1–13.1) | 8.0 (2.2–13.1) | 7.9 (2.4–12.6) | 9.3 (3.7–13.2) | 3.7 (1.7–10.5) | 5.7 (2.3–12.1) | 6.8 (2.2–12.4) | <0.0001 | |
| Male, % | 67.3 | 68.5 | 68.1 | 58.4 | 68.2 | 70.5 | 67.8 | 0.036 | |
| Median ISSb | 9 (9–17) | 17 (9–25) | 14 (9–22) | 17 (9–27) | 9 (9–9) | 9 (9–9) | 9 (9–16) | <0.0001 | |
| RTC, % | 41.1 | 39 | 29.2 | 57.9 | 13.9 | 17 | 29.2 | <0.0001 | |
| Fall <2 m, % | 29.5 | 27.8 | 37.1 | 12.2 | 59.8 | 57.3 | 41.5 | <0.0001 | |
| Mortalityc | 3.7 (3.2–4.2) | 2.4 (1–3.7) | 2.9 (2.3–3.4) | 0 (0–0) | 1.8 (1.4–2.2) | 0.4 (−0.1–0.9) | 2.8 (2.5–3) | <0.0001 | |
| 16–64 | n | 55,340 | 1,751 | 21,444 | 4,908 | 57,827 | 4,795 | 146,065 | |
| Median age | 41.9 (27.5–54.0) | 38.3 (25.9–51.2) | 42.6 (28.1–53.8) | 41.9 (28.2–53.2) | 51.3 (37.6–59.1) | 45.2 (29.2–55.9) | 46.2 (30.6–56.5) | <0.0001 | |
| Male, % | 73.3 | 77.4 | 74.7 | 75.6 | 61.2 | 70.1 | 68.7 | <0.0001 | |
| Median ISS | 13 (9–24) | 24 (14–29) | 16 (9–25) | 22 (10–32) | 9 (9–10) | 9 (5–14) | 9 (9–16) | <0.0001 | |
| RTC, % | 40.1 | 37.2 | 32.5 | 53.6 | 22.7 | 25.6 | 32.1 | <0.0001 | |
| Fall <2 m, % | 24.1 | 20 | 30.7 | 11.9 | 51.5 | 35.9 | 35.9 | <0.0001 | |
| Mortality | 5.8 (5.6–6) | 3.6 (2.7–4.5) | 3.3 (3.1–3.6) | 0.2 (0.1–0.4) | 2.7 (2.6–2.9) | 0.6 (0.4–0.9) | 3.9 (3.8–4) | <0.0001 | |
| 65+ | n | 39,698 | 446 | 12,773 | 2,803 | 86,895 | 3,909 | 146,524 | |
| Median aged | 81.6 (74.1–87.6) | 74.6 (69.1–82.1) | 77.7 (71.2–84.1) | 78.7 (72.3–84.8) | 83.4 (76.5–88.8) | 80.6 (73.6–86.7) | 82.3 (75.1–88.0) | <0.0001 | |
| Male, % | 42.6 | 61.7 | 58.1 | 51.1 | 36 | 42.6 | 40.3 | <0.0001 | |
| Median ISSe | 9 (9–18) | 25 (14–26) | 17 (9–25) | 17 (9–25) | 9 (5–14) | 9 (9–16) | 9 (9–16) | <0.0001 | |
| RTC, % | 11.2 | 19.3 | 10.4 | 30.1 | 4.5 | 7.4 | 7.4 | <0.0001 | |
| Fall <2 m, % | 73.5 | 52.7 | 73.9 | 42.8 | 86.9 | 82.2 | 81.3 | <0.0001 | |
| Mortalityf | 13.9 (13.5–14.2) | 11.9 (8.9–14.9) | 8.5 (8–9) | 1.9 (1.4–2.4) | 9.6 (9.5–9.8) | 4.1 (3.4–4.7) | 10.5 (10.4–10) | <0.0001 |
aBrackets express interquartile range.
bBrackets express interquartile range.
cBrackets express 95% confidence intervals.
dBrackets express interquartile range.
eBrackets express interquartile range.
fBrackets express 95% confidence intervals.
In the older population, the result is reversed with 70.7% of all cases over 65 years with ISS > 8 presenting to TUs. In addition, the chance of an older patient with significant injury being transferred from a TU to an MTC is low at 8.7% (12,773 of 146,524—Table 2, Figure 1).
The incidence of road traffic collisions (RTCs) as mechanism of injury varies by age. RTC accounts for 7.4% of trauma in the over 65 group, and 29.2% in the under 16 years old group. RTC accounts for 32.1% of trauma in adults aged 16–64.
Median ISS score varies little by age, although adults aged 16–64 had the highest average ISS over all pathways. Across all pathways, paediatric trauma patients had the lowest median ISS scores. Additionally, the median ISS of patients across all ages treated at a MTC only or a TU/LEH only was the same; ISS = 9.
Patients admitted to a MTC only scored higher for indicators of injury severity, and these patients also had higher mortality compared with those treated at TU/LEH only. A greater percentage of patients treated at TU/LEH compared with those treated at a MTC sustained a ‘low level’ fall from 2 metres or less (43.9% at MTC compared with 72.4% at TU/LEH).
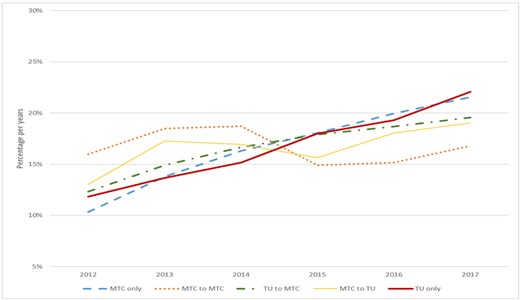
Amongst patients transferred within networks, there is a pattern of increased injury severity in those being transferred ‘up’ to a MTC, with the most severely injured patients found to be those necessitating transfer between MTCs—as can be expected. These patients were also the youngest patient group, with median age of 38 years. Movement of patients throughout networks demonstrates a uniform increase in cases moving through the trauma system (Figure 2). How the trauma network handles its distribution of caseload over time is a key marker of how the nature of trauma changes over time. Figure 2 does not include repatriations. It clearly demonstrates the increase in flow of patients into and remaining within the non-MTC hospitals. The increase in MTC only cases therefore is mirrored by cases presenting only to TUs or LEHs (annotated as TUs). Similarly, transfer practices between specialist and non-specialist centres demonstrates a steady increase over time. All three distributions (MTC Only, TU/LEH only and transfer between TU/LEH to MTC) are tightly grouped throughout the increase over time.
Distribution of cases by hospital and transfer over the study period as a function of time.
Discussion
We demonstrate that the majority of major trauma patients across all age groups in England are triaged and treated at a TU or LEH. Of those patients treated at one centre only, without transfer, 59.8% were treated at a TU or LEH, suggesting that these ‘satellites’ or ‘spokes’ within regional trauma networks treat a considerable proportion of major trauma patients.
Age, treatment centre and transfer
These findings demonstrate that TU/LEHs shoulder the greatest burden, by caseload, within the trauma networks. Regarding the characterisation of patients being transferred between centres, the results indicate that the patients requiring transfer tend to be more severely injured and younger than those patients admitted to one centre only, with the exception of those patients being transferred from TU/LEH to other TU/LEH. This exception may be attributed to the role played by LEH and TU in the rehabilitation of trauma patients after initial treatment. [14]
The median age of all patients treated at TU or LEH exclusively (72.1 years) is greater than those treated at MTC or those transferred within the network. When the subset of patients >65 treated at TU or LEH only is analysed, the median age is 83.4 years, and 86.9% of these patients sustained falls from 2 metres or less. It is worth reflecting at this point; this significant trauma population is in addition to the hip fracture burden presenting alongside these patients and also in addition to older patients with isolated injures that do not qualify for TARN inclusion. With this data, we can demonstrate for the first time in a national trauma system with caseload in excess of 300,000 that,
twice as many major trauma patients >65 years of age are treated at a TU/LEH than at an MTC;
smaller percentages of older patients are transferred between centres within networks;
the vast majority of patients >65 are treated at the TU or LEH at which they presented.
Again, this suggests that TU and LEH are receiving the vast majority of frail older patients, the majority of whom sustain low energy trauma from falls from standing height or less and that these patients are less likely to be transferred between centres compared with younger patients.
Regarding patient transfer since implementation of trauma networks, our results are consistent with other TARN studies, suggesting lower proportions of patients require secondary transfer between hospitals—possibly due to more seriously injured patients being transported directly to MTCs [12]. This finding is demonstrated in Figure 2 with the transfer between MTC or from MTC to TU/LEH being relatively static over time. With regards transfer practices and initial case distribution, as the national trauma system matures, there is a uniform increase over time in case number (Figure 2). Key to understanding the distribution of major trauma cases however, this increase is demonstrated in both MTCs and TU/LEH. Figure 2 reinforces the key element of this work in that over time, we can demonstrate that the trauma burden grows and is shared equally in terms of overall numbers between the perceived specialist and non-specialist hospitals. This has ramifications for the national trauma service going forward, particularly with regard older patients. Many MTC hospitals for example continue to provide a full hip fracture service in addition to the major trauma work resulting in issues with clinical prioritisation. The transfer between TU/LEH to MTC of cases requiring specialist surgical input continues and grows. Concurrently, the TU/LEH continues to admit major trauma cases in older patients who remain in their hospitals. There is a situation therefore developing of increased demand for both specialist input and routine surgery in the older patient but limited resource. This limitation may be seen either at the MTC in terms of capacity or at TU/LEH in terms of perceived lack of specialist input as skill fade and increased subspecialists focus impact and decreased capacity for orthogeriatric investment threatens optimum care.
Injury severity and comorbidity
Despite the high proportion of older patients sustaining low-energy injuries, these injuries are nevertheless high severity. As can be expected, older trauma patients also have more comorbidities as expressed by Charlson score. Higher Charlson score was, however, associated with increased probability of treatment outside of the MTC environment independent of age. More older, severely injured patients are seen in TUs/LEHs than in MTCs, and the Charlson scores reflect this (Table 1). Median ISS was again the same for those older patients treated at MTC only and those treated at TU/LEH only.
Implications
We have shown a pattern of increased volume of older frail patients with significant injuries, presenting to and remaining in TUs. This may suggest the need for greater focus on the referral and transfer flow of older trauma patients, particularly with injuries from low energy trauma such as falls, within TU and LEH. These units require appropriate investment and a suitable skill mix (including orthogeriatric input) amongst the clinicians managing these patients, as can be demonstrated from National Hip Fracture Database (NHFD) data in respect of patients with hip fracture who fulfil the same demographics.
This issue is not new but strengthens the call for an alteration in the funding and resource model to improve pathways of care [12]. Equally this situation corroborates the need, as highlighted in a recent National Confidential Enquiry into Patient Outcome and Death report, for robust networks and inter-hospital pathways of care to enable timely referral and review [15].
Limitations
Despite the very high quality of TARN datasets, it remains a challenge to ameliorate the pitfalls of utilising ‘big data’. No database can be entirely complete. Further risks associated with uncontrolled clinical measurement, multiple datapoints and transcription apply [16]. GCS for example, with its multiple components and repeated measurement, can be a source of data ‘missingness’ [17]. Whilst this may threaten hypotheses relating to head injury interventions, this is not a feature of the current work. Equally, these issues can be minimised in impact. Misclassification bias has largely been eliminated from this study by the highly specific and comprehensive coding of major trauma within Hospital Episode Statistics and subsequent admission of data to TARN [18]. The multi-parameter coding utilising the ISS amongst other measures reduces the opportunity for misclassification of major trauma at hospital level. Trauma best practice tariffs further incentivise quality data submission. Our previous work utilising a similar TARN dataset to look at impact of age on patients with orthopaedic injuries demonstrated consistent findings across all submitting hospitals, both of ‘high quality’ and ‘low quality’ data submission [6]. This is key to demonstrating the ability of the dataset to support use in this manner.
‘Lumping’ of major trauma patients >65 prevents finer interpretation of the nature of trauma in the ‘oldest old’. These patients, generally classified as >80 years old, are a rapidly growing population within the UK and are well represented in trauma case data, as demonstrated by the median ages of patients in the >65 category in this study.
The TARN database excludes isolated closed fractures, and this work is not fully reflective of the overall trauma population, only those with significant injuries. When seen alongside the NHFD as an additional field, it illustrates that the extent of older person’s injury is underrepresented, and the resource disparity in the context of the demand for older patient fracture care is worse than currently perceived [19].
Conclusions
We present the first comprehensive overview of the distribution of caseload in major trauma patients presenting to hospitals across England. The 5-year study period and patient numbers exceeding 300,000 provide a unique demonstration of patterns of patient movement and nature of injury severity in a national trauma system.
There are clear differences in caseload between paediatric, adult and older (>65) patients. Transfer behaviours differ between adults and children. Paediatric major trauma numbers are very low, and movement between hospitals is very different in comparison with the older adult. Within adults, the injury mechanism is dominated by low falls, particularly in the older population; these patients make up a large proportion of caseload in TUs.
We illustrate the reality of the major trauma population in England, reflecting the changing population demographic. This strengthens the growing evidence base for increased resource allocation to care for and rehabilitate the older trauma population, particularly in satellite TUs and not—as often perceived—in MTCs.
Declaration of Conflicts of Interest:
None.
Declaration of Funding:
TARN is funded by NHS Trusts. The funders played no part in the design, execution, analysis and interpretation of data or in the writing the study.

Comments