


Abstract
Studies investigating outcomes of delirium using large-scale routine data are rare. We performed a two-centre study using the 4 ‘A’s Test (4AT) delirium detection tool to analyse relationships between delirium and 30-day mortality, length of stay and home time (days at home in the year following admission).
The 4AT was performed as part of usual care. Data from emergency admissions in patients ≥65 years in Lothian, UK (n = 43,946) and Salford, UK (n = 38,824) over a period of |$\sim$|3 years were analysed using logistic regression models adjusted for age and sex.
4AT completion rates were 77% in Lothian and 49% in Salford. 4AT scores indicating delirium (≥4/12) were present in 18% of patients in Lothian, and 25% of patients in Salford. Thirty-day mortality with 4AT ≥4 was 5.5-fold greater than the 4AT 0/12 group in Lothian (adjusted odds ratio (aOR) 5.53, 95% confidence interval [CI] 4.99–6.13) and 3.4-fold greater in Salford (aOR 3.39, 95% CI 2.98–3.87). Length of stay was more than double in patients with 4AT scores of 1–3/12 (indicating cognitive impairment) or ≥ 4/12 compared with 4AT 0/12. Median home time at 1 year was reduced by 112 days (Lothian) and 61 days (Salford) in the 4AT ≥4 group (P < 0.001).
Scores on the 4AT used at scale in practice are strongly linked with 30-day mortality, length of hospital stay and home time. The findings highlight the need for better understanding of why delirium is linked with poor outcomes and also the need to improve delirium detection and treatment.
Key Points
Prior research studies have linked delirium with mortality, length of stay and other adverse outcomes.
Policy guidelines advocate effective delirium detection and care but delirium is mostly undetected in practice.
There is a lack of large scale research demonstrating links between routinely collected delirium assessments and outcomes.
We show in a large study that the 4AT delirium test completed by clinical staff is linked with outcomes e.g. 30-day mortality.
Real-time delirium assessment at scale with the 4AT is feasible and yields findings of immediate and longer-term clinical significance.
Background
Delirium is an acute neuropsychiatric syndrome affecting one in four older patients admitted to hospital as an emergency [1]. Around two-thirds of delirium is present on admission [2, 3]. Delirium is linked with multiple adverse outcomes [4, 5], including long-term cognitive impairment [6], mortality [7, 8], and patient and carer distress [9]. However, much of this evidence comes from specialist assessment of delirium in selected patient cohorts. Risk factors include older age, dementia and frailty [4]. Guidelines and policy statements recommend that delirium should be detected and effectively managed [10, 11], yet delirium remains frequently undiagnosed [12–16].
The adoption of electronic health records (EHRs) presents new opportunities to study delirium at scale [17]. Yet studies in clinical populations examining delirium detected in routine practice in relation to outcomes are rare. Corradi and colleagues [18] examined relationships between Confusion Assessment Method (CAM) [19] delirium tool scores in routine practice in n = 88,206 patients. Positive CAM scores were linked with outcomes, but patients rated ‘Unable to Assess’ (UTA) on the CAM outnumbered those with positive CAM scores and had higher mortality than CAM-positive patients. Other large scale studies have linked delirium with outcomes, but they have not used real-time delirium detection as part of routine care [15, 20–23].
The 4 ‘A’s Test (4AT) is a brief test of delirium and cognitive impairment [24, 25] widely used in practice [26] and recommended in guidelines and policy statements [10, 12, 27–37]. A study in hip fracture patients (n = 522) found that 4AT scores were associated with mortality and increased length of stay [38]. Another study in geriatrics inpatients (n = 222) linked mortality at 1 year with 4AT scores [39]. Here we used admission 4AT scores completed by clinicians within EHR systems for a large population of consecutive older emergency patients, to examine the relationships between delirium and outcomes in large clinical populations in two centres. We tested the hypotheses that 4AT scores are associated with inpatient mortality within 30 days, length of inpatient stay and number of days at home in the year following admission (home time).
Methods
Study population and setting
This study was conducted in Lothian and Salford, UK, using linked routine healthcare data. In Lothian, three acute hospital sites were included, and in Salford one hospital was included. We studied consecutive non-elective admissions aged ≥65 years. In Lothian, this comprised acute medical patients admitted between April 2016 and March 2020. Patients not resident in Scotland were excluded from the analysis to ensure availability of complete follow-up. In Salford, consecutive non-elective (83% medical, 17% surgical) admissions were included between September 2017 and March 2020. A restricted population of residents with a Salford postcode was used for outcome follow-up to ensure complete follow-up data were available. The start dates reflect commencement of routine 4AT implementation in the EHR in each site.
Electronic 4AT testing
The 4AT is a validated [24, 40] brief delirium assessment tool designed for clinical use. It is scored between 0 and 12 points. We analysed 4AT assessment within 24 h of each patient’s first admission in the study period, using the standard cutoffs of 4AT 0 (normal test), 4AT 1–3 (possible cognitive impairment, no delirium) and 4AT ≥4 (possible delirium ± cognitive impairment). We also analysed patients with no 4AT completed. The 4AT is embedded in the EHR in Lothian (TrakCare, InterSystems, Cambridge, MA) and Salford (Allscripts, Chicago, IL) [17, 41]. In both sites, completion of the assessment is recommended for all nonelective admissions aged ≥65. Where more than one score was available, the first completed assessment was used.
Outcomes
The primary outcome was inpatient mortality within 30 days of admission. This was analysed using consecutive hospital episodes at each site. Secondary outcomes were inpatient mortality at any timepoint, the proportion of eligible patients receiving a completed 4AT assessment and the length of stay. To further understand any relationship with higher 4AT scores, the 30-day mortality for patients with 4AT ≥4 was also assessed using 4–6, 7–9 and 10–12 point groupings. A unique patient cohort was then created including only the first (index) hospital episode for each person within the dataset. This was used to assess two further secondary outcomes in patients surviving to discharge from their index episode: non-elective hospital readmission within 30 days and all-cause mortality within 1 year.
To mitigate the competing risk of death and readmission in this older population, we included a further outcome of ‘home time’ at 1 year following index hospitalisation. Home time is defined as the number of days a person spends alive and outside of hospital in the 365 days following index hospitalisation. This measure therefore accounts for loss of home time days due to death within the year of follow-up, but also for all days readmitted to hospital even if over multiple episodes. Home time is an increasingly reported person-centred outcome measure that has now been validated in multiple populations [42–44]. We included an additional post-discharge home time measure for survivors excluding the index admission, to count the number of home time days achieved in the year following discharge.
Statistical analysis
Analysis was conducted independently in each site without merging of individual-level data, but using the same R script coding adapted to local data structures. Continuous data are presented as means ± standard deviation (SD) or median ± interquartile range and where appropriate compared by Student’s t-test, Mann–Whitney U-test or analysis of variance. Categorical data are presented as absolute numbers (percentages) and compared by Chi-squared test. The primary analysis was based on a logistic regression model to assess the odds of inpatient death at 30 days by 4AT score adjusting for age and sex, using the group with 4AT 0 as the referent. Secondary analyses for the risk of readmission at 30 days and death at 1 year were handled in a similar manner, with Kaplan–Meier plots constructed to visualise survival over the period of follow-up. Density plots were constructed to show the distribution of index admission length of stay, grouped by 4AT status. For the home time data, median home time between groups was compared by standard nonparametric testing. To help simply visualise the distribution within each 4AT group, the potential year of home time follow-up was divided into four blocks each of 3-month duration. All analyses were conducted using R [45], including tidyverse, MASS and survminer packages.
Ethics
In both sites, access to these data was provided in accordance with service evaluation of an existing intervention (4AT assessment) recommended in local and national guidelines.
Results
We included 82,770 consecutive hospital episodes (43,946 in Lothian, 38,824 in Salford) involving 31,266 unique patients (mean age 79 ± 8 years, 56% female) over the study period (Table 1). All admissions in Lothian were to medical wards, and in Salford 83% were medical and 17% surgical. The median length of stay was 5 [2–13] days in Lothian and 3 [1–9] days in Salford.
Characteristics of all consecutive hospital admissions
| All n = 82,770 | Lothian n = 43,946 | Salford n = 38,824 | P-value | |
|---|---|---|---|---|
| Age, years (SD) | 79 (8) | 79 (8) | 79 (8) | 1.00 |
| Female | 45,108 (54) | 24,564 (56) | 20,544 (53) | <0.001 |
| Inpatient deaths | 6,358 (8) | 3,822 (9) | 2,536 (7) | <0.001 |
| Inpatient deaths within 30 days | 5,077 (6) | 2,850 (7) | 2,227 (6) | <0.001 |
| 4AT score, mean (SD) | 1.8 (3) | 1.6 (3) | 2.2 (4) | <0.001 |
| Score 0 | 32,350 (39) | 21,032 (48) | 11,318 (29) | <0.001 |
| Score 1–3 | 9,930 (12) | 6,958 (16) | 2,972 (8) | |
| Score ≥ 4 | 10,685 (13) | 6,017 (14) | 4,668 (12) | |
| Not measured | 29,805 (36) | 9,939 (23) | 19,866 (51) |
Values are n (%) unless stated otherwise. P-value represents the difference between Lothian and Salford following either t-test comparison of means or Chi-squared analysis for proportions.
Completion rates of 4AT and scoring patterns
A 4AT assessment was completed in 52,965 (64%) of hospital admissions, but this varied between sites (77% Lothian, 49% Salford). Rates of completion appeared consistent over time in both centres (Supplementary Figure 1). Older patients were more likely to have a 4AT completed (66% of patients >90 years old vs. 58% aged 65–70 years, P < 0.001) and this relationship was more marked in Salford than in Lothian (Supplementary Table 1). Excluding incomplete 4AT assessments, rates of hospital episodes with possible delirium (4AT ≥4) were higher in Salford (4,668/18,958, 25%) than in Lothian (6,007/34,007, 18%, P < 0.001 for difference). Probable cognitive impairment (4AT 1–3) was observed in 20% (6,958/34,007) of episodes with a completed 4AT in Lothian, compared with 16% in Salford (2,972/18,958). Total 4AT scores increased with age; in both sites, patients >90 years old had 3-fold higher mean scores than those aged 65–70 years old (Supplementary Table 1).
Mortality in relation to 4AT
There were 6,358 (8%) inpatient deaths of which 5,077 (6%) occurred within 30 days of admission (Table 1). Rates were similar between the two sites. The risk of inpatient death within 30 days of admission increased in relation to 4AT, from 4% of patients with 4AT 0, 7% with 4AT 1–3 and 17% of those with 4AT ≥4 (Table 2). Deaths in those without a 4AT measurement were higher than the 4AT 0 group and similar to the 4AT 1–3 group, at 6%. After adjustment for differences in age and sex (because risk of delirium and risk of adverse outcomes may be modified by these variables [4]), the risk of inpatient death at 30 days in patients with 4AT ≥4 was 5.5-fold greater than the 4AT 0 group in Lothian (adjusted odds ratio [aOR] 5.53, 95% confidence interval [CI] 4.99–6.13) and 3.4-fold greater in Salford (aOR 3.39, 95% CI 2.98–3.87, Table 3). Patients with 4AT 1–3 had a smaller increased risk, but this was still elevated in comparison to those with 4AT 0 (aOR 1.84 [95% CI 1.62–2.08] in Lothian, aOR 1.45 [95% CI 1.21–1.74] in Salford). There was a similar magnitude of increased mortality risk amongst patients without 4AT completion to the 4AT 1–3 group. Death at any point during a hospital admission was observed in 23% of patients with 4AT ≥4, with a similar observed risk relationship across the 4AT groups (Tables 2 and 3). There appeared to be a linear non-linear trend to higher inpatient mortality with increasing 4AT scores beyond 4 points (Supplementary Figure 2).
Readmission and mortality for unique patients (both centres) by index admission 4AT score
| All | 4AT 0 | 4AT 1–3 | 4AT ≥ 4 | Not measured | |
|---|---|---|---|---|---|
| Number of patients | 31,266 | 13,749 (44) | 3,958 (13) | 3,938 (13) | 9,621(31) |
| Mean age, years (SD) | 79 (8) | 78 (8) | 83 (8) | 82 (8) | 79 (8) |
| Female | 17,355 (56) | 7,480 (54) | 2,302 (58) | 2,278 (58) | 5,295 (55) |
| Readmission within 30 days | 3,148 (10) | 1,293 (9) | 447 (11) | 344 (9) | 1,064 (11) |
| Inpatient mortality at 30 days | 1,936 (6) | 544 (4) | 267 (7) | 677 (17) | 540 (6) |
| Any inpatient mortality | 2,524 (8) | 555 (4) | 402 (10) | 921 (23) | 646 (7) |
| All-cause mortality at 1 year | 8,422 (27) | 2,685 (20) | 1,404 (35) | 1,942 (49) | 2,391 (25) |
Values are n (%) unless stated otherwise.
Odds of readmission or death in relation to 4AT
| Lothian | Salford | |||||||
|---|---|---|---|---|---|---|---|---|
| 4AT 0 | 4AT 1–3 | 4AT ≥ 4 | Not measured | 4AT 0 | 4AT 1–3 | 4AT ≥ 4 | Not measured | |
| Inpatient mortality at 30 days | Ref | 1.84 (1.62–2.08) | 5.53 (4.99–6.13) | 2.12 (1.90–2.36) | Ref | 1.45 (1.21–1.74) | 3.39 (2.98–3.87) | 1.37 (1.22–1.54) |
| Any inpatient mortality | Ref | 2.19 (1.97–2.44) | 6.27 (5.72–6.87) | 2.04 (1.85–2.25) | Ref | 1.62 (1.37–1.90) | 3.27 (2.89–3.71) | 1.34 (1.20–1.50) |
| Readmission within 30 daysa | Ref | 1.04 (0.93–1.16) | 0.59 (0.51–0.67) | 0.89 (0.81–0.97) | Ref | 1.47 (1.17–1.84) | 1.08 (0.87–1.33) | 1.02 (0.89–1.17) |
| All-cause mortality at 1 yeara | Ref | 1.82 (1.67–1.99) | 3.49 (3.20–3.80) | 1.43 (1.32–1.54) | Ref | 1.98 (1.62–2.42) | 3.11 (2.61–3.71) | 1.32 (1.17–1.50) |
Ref: reference. Values are odds ratios (95% CIs) derived from logistic regression models adjusted for age and sex.
aModelling undertaken using unique patients’ index (first) hospital admission within the study time period only, and where at least 1 year of follow-up data were available—this included 22,934 patients in Lothian and 8,332 patients in Salford.
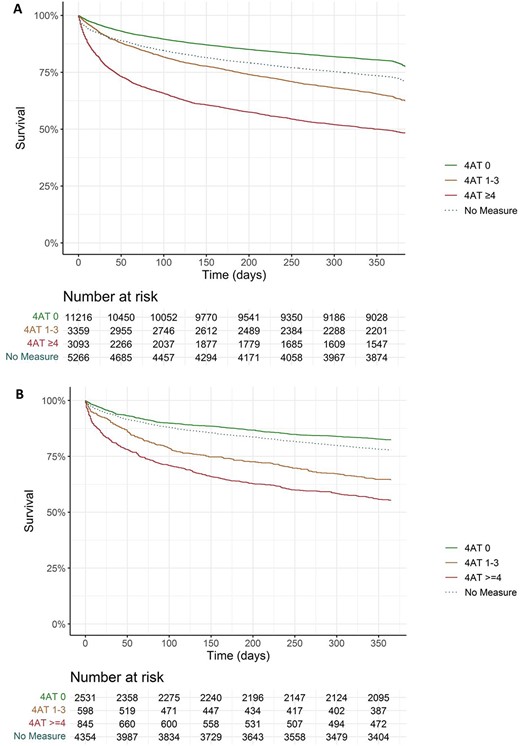
Kaplan–Meier plots for survival from all-cause mortality in the year following index hospital presentation in Lothian (A) and Salford (B).
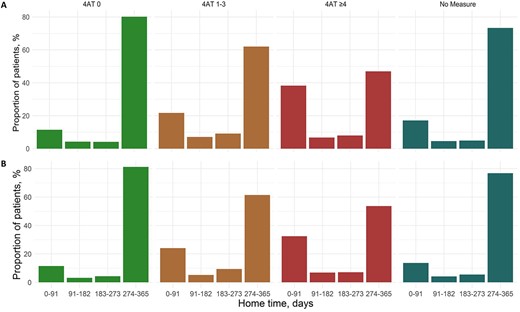
Home time in the year following 4AT assessment in Lothian (A) and Salford (B).
By 1 year after the date of hospital admission, 8,422 (27%) patients had died. This comprised 49% of patients with 4AT ≥4 at their index hospital admission, 35% of those 4AT 1–3 and 20% with 4AT 0 (Table 2). Within the group with 4AT ≥4, there appeared to be an increased risk of death with higher scores in both sites (Figure 1). The group without 4AT assessment had a 25% observed mortality at 1 year. After adjusting for differences in age and sex, there was a greater than 3-fold increased risk of death amongst patients with 4AT ≥4 in both sites when compared with patients with 4AT 0 (aOR 3.49 [95% CI 3.20–3.80] in Lothian, aOR 3.11 [95% CI 2.61–3.71] in Salford, Table 3). There was a smaller increased risk of death at 1 year in the group with 4AT 1–3, approaching a doubling of the risk compared with the 4AT 0 group (aOR 1.82 [95% CI 1.67–1.99] in Lothian, aOR 1.98 [95% CI 1.62–2.42] in Salford). The risk increase in patients without 4AT assessment was smaller for 1-year mortality compared with 30-day risk, but remained higher than in the 4AT 0 group.
Length of stay, readmission risk and home time
Length of stay was more than doubled in patients with any abnormal 4AT score compared with 4AT score of 0, but there was little difference observed between patients in the 4AT 1–3 and ≥ 4 groups (Supplementary Figure 3 and Supplementary Tables 2 and 3). Patients without a 4AT measure had a similar short admission profile and 30-day readmission risk to those with 4AT 0 assessment. Readmission rates were highest amongst patients with 4AT 1–3 across both cohorts, although this risk only reached significance in Salford after adjustment for age and sex (aOR 1.47 [95% CI 1.17–1.84] using 4AT 0 as the reference group, Supplementary Tables 2 and 3). Lower readmission rates were observed in the 4AT ≥4 group in Lothian (aOR 0.59 [95% CI 0.51–0.67]).
To account in part for the competing risks of inpatient death and readmission risk, home time over the year following index admission was calculated. The median home time at 1 year was reduced by 112 days in Lothian in the 4AT ≥4 compared with those 4AT 0 (245 [0–351] days vs. 357 [322–362] days respectively, P < 0.001, Supplementary Table 2). Similar results were observed with a 61-day reduction median home time in the Salford cohort (295 [30–354] days for patients 4AT ≥4 vs. 356 [319–362] days with 4AT 0, P < 0.001, Supplementary Table 3). In both sites, more than one-third of patients with 4AT ≥4 achieved fewer than 91 days of home time in the year following index admission (Figure 2). Reductions were smaller for patients with 4AT 1–3 at 324 [131–356] median home time days in Lothian and 321 [98–355] days in Salford. Amongst survivors of the index admission (n = 28,742), home time in the year following discharge remained lower in those with 4AT ≥4, but to a less pronounced effect, with 4- and 13-day reductions in median home time compared with 4AT 0 patients in Lothian and Salford, respectively. However, in both sites, nearly one in five patients with 4AT ≥4 at index presentation still achieved fewer than 91 home time days in the year following discharge (Supplementary Figure 4).
Discussion
In this two-centre routine data study of older emergency admissions, 4AT scores were associated with 30-day mortality, hospital length of stay and time at home in the year following the admission. In Lothian, 30-day mortality with 4AT ≥4 (indicating delirium) was 5.5-fold greater than 4AT 0, and in Salford the 30-day mortality was 3.4-fold greater than 4AT 0. Patients with 4AT 1-3 (indicating cognitive impairment but no delirium) or noncompleted 4AT had a mortality risk lower than 4AT ≥4 but increased compared with 4AT 0.
These findings provide a novel real-world analysis of a widely recommended delirium assessment tool, showing both that positive score rates are broadly aligned with estimated levels of delirium, and that scores are associated with important outcomes. There are very few comparable studies. Corradi and colleagues [18] derived delirium from the CAM scored in inpatients (aged 18+; 50% aged ≥65), with n = 88,206 episodes studied. However the percentage of CAM-positive scores (8%) was considerably lower than the expected prevalence in this population [1, 4]. More patients (12%) were classed as UTA than were CAM positive. This is likely because the CAM may not yield a positive test result if patients are unable to produce speech or are drowsy, though in practice such patients usually have delirium [18]. Consistent with this known issue, the CAM-positive delirium group had an inpatient mortality rate of 12% and in the UTA group the mortality rate was 22%. Another study of n = 9,214 older inpatients [21] reported that delirium detected by the CAM (performed by specially trained nurses) was linked to increased length of stay. However, the CAM-positive rate in the sustainability phase of the study was 3.2%, markedly lower than the expected prevalence of delirium [1, 4]. Other studies in large clinical populations have reported links between delirium and adverse outcomes, or rates of delirium assessment tool completion alongside positive score rates, but none has reported real-time delirium detection data from routine care in relation to outcomes [15, 20, 22, 23, 46, 47]. By showing effectiveness in practice, the present findings provide helpful new evidence on implementation of delirium assessment for both clinicians and policymakers. For example, a report on the development of the NHS England Dementia Assessment and Referral data collection is considering inclusion of the 4AT [48].
The present findings confirm in a large population the association between delirium and adverse outcomes. The magnitude of the relationship between delirium and mortality found in both centres is comparable with findings from a systematic review (71 studies, total n = 49,566) reporting that delirium was associated with a 3.2-fold increase in mortality in all settings and a 3.6-fold increase in medical inpatients [7]. Another relevant systematic review found that acutely altered level of arousal, which mostly indicates delirium, was associated with a 5.7-fold increase in inpatient mortality [49]. Our results suggest a potential dose–response relationship with higher 4AT scores conferring higher mortality risk. This is an important observation in a large real-world population that warrants further clinical and research attention, particularly where optimised care could prevent the development of some delirium [4, 11]. The causes of the increased mortality in patients with delirium are unclear. People with delirium are at higher risk of hospital complications such as falls and pneumonia [50] and they also frequently have risk factors such as old age, dementia and frailty that also contribute to risk of inpatient mortality [51–53]. It remains unclear if delirium interventions can improve outcomes. Studies are few and have mixed results [4, 10, 54], though there is some evidence of benefits such as reduced delirium severity and duration [55]. Yet despite the lack of clear evidence of efficacy of delirium treatment, there is undoubted value in a formal diagnosis in that this provides prognostic information, facilitates access to specific delirium treatment pathways and is essential to give accurate and timely information to patients and carers as advocated in guidelines [10, 11]. However, delirium detection rates in general remain variable and often poor in the UK and elsewhere [3, 12, 13]. A 2019/2020 national audit of UK Emergency Departments found that only 40% had a cognitive assessment, and only 16% of these had a 4AT with 11% using another assessment tool for delirium [12]. By contrast, in hip fracture care in England, assessment of delirium with the 4AT is mandated and incentivised as part of the Best Practice Tariff, and completion rates are >95% [27]. These and other studies [46, 47] suggest that delirium assessment at scale in routine clinical workflow is possible but that achieving this requires appropriate data collection, and visibility, policy and education.
This study has several strengths. It has a large sample size and used routine clinical data from a population of unselected non-elective admissions aged ≥65. Delirium was ascertained using a validated tool that was completed in real-time by clinical staff rather than by researchers or staff with a special role in delirium detection. The 4AT had positive score rates which were broadly consistent with estimated rates of delirium in the populations concerned. The present positive score rates are comparable with recent studies using the 4AT [46] and the Nursing Delirium Screening Scale [47] and contrast with the lower positive score rates reported in large scale studies using the CAM [15, 18, 20, 21]. The study also has some limitations. Completion rates of the 4AT were 77% in Lothian and 49% in Salford, reflecting the ongoing challenge of introducing delirium assessment and cognitive testing into routine practice. As an observational cohort study, bias may have been introduced by 4AT completion in patients with a higher pretest probability of delirium. Our findings suggest patients who did not receive a 4AT assessment were generally at lower risk of poor outcomes, but future work should address the barriers to assessment in this group. We did not measure and control for dementia, multimorbidity or frailty. The findings demonstrate that positive 4AT scores strongly indicate higher risk of adverse outcomes, but further research is needed to understand the extent to which this risk can be modified through intervention.
Conclusions
Delirium as detected by the 4AT performed by clinical staff as part of routine practice is associated with important short and longer term outcomes. The results confirm that detection and effective management of delirium in older patients should be considered an essential component of good care on arrival to hospital.
Acknowledgement
We thank Schanhave Santhirasekaran for her help with data management.
Declaration of Conflicts of Interest
AM is the main author of the 4AT (see www.the4AT.com); the 4AT is free to download and use, and there are no current or future financial interests. AM was co-chair of the committee that produced the 2019 Scottish Intercollegiate Guidelines Network (SIGN) Guideline on Delirium in which the 4AT is recommended. The other authors declare no competing interests.
Declaration of Sources of Funding
AA was supported by a clinical lectureship from the Chief Scientist Office (Scotland): PCL/18/05. TI was supported by an MRC Precision Medicine Doctoral Training Fellowship awarded to the University of Edinburgh (G34632).
References
Author notes
Shared first authorship
Shared senior authorship

Comments