


Abstract
We conducted a prospective study of dietary patterns and longitudinal change in audiometric hearing thresholds among 3,135 women (mean age = 59 years) in the Nurses’ Health Study II (2012–2018). Diet adherence scores for the Dietary Approaches to Stop Hypertension (DASH) and Alternate Mediterranean (AMED) diets and the Alternate Healthy Eating Index 2010 (AHEI-2010) were calculated using validated food-frequency questionnaires. Baseline and 3-year follow-up hearing sensitivities were assessed by pure-tone audiometry at 19 US sites. We used multivariable-adjusted logistic regression models to examine independent associations between diet adherence scores and risk of ≥5 dB elevation in the pure-tone average (PTA) of low-frequency (LPTA0.5,1,2 kHz), mid-frequency (MPTA3,4 kHz), and high-frequency (HPTA6,8 kHz) hearing thresholds. Higher adherence scores were associated with lower risk of hearing loss. Compared with the lowest quintile of DASH score, the multivariable-adjusted odds ratios for mid-frequency and high-frequency threshold elevation in the highest quintile were 0.71 (95% confidence interval (CI): 0.55, 0.92; P for trend = 0.003) and 0.75 (95% CI: 0.59, 0.96; P for trend = 0.02); for AMED and AHEI scores, for mid-frequency threshold elevation, they were 0.77 (95% CI: 0.60, 0.99; P for trend = 0.02) and 0.72 (95% CI: 0.57, 0.92; P for trend = 0.002). Nonsignificant inverse associations were observed for high-frequency threshold elevation. There were no significant associations between adherence scores and low-frequency threshold elevation. Our findings indicate that eating a healthy diet might reduce the risk of acquired hearing loss.
Abbreviations
- AAA
Audiometry Assessment Arm
- AHEI-2010
Alternate Healthy Eating Index 2010
- AMED
Alternate Mediterranean diet
- CHEARS
Conservation of Hearing Study
- CI
confidence interval
- DASH
Dietary Approaches to Stop Hypertension
- HL
hearing level
- NHS II
Nurses’ Health Study II
- PTA
pure-tone average
Hearing loss poses a growing public health burden; approximately 466 million individuals worldwide suffer from disabling hearing loss, and the number is expected to grow to over 900 million by the year 2050 (1). Individuals with hearing loss are more likely to have impaired activities of daily living (2), lower quality of life (2), and higher risk of cognitive decline (3) and depression (4). Hearing loss is often irreversible; therefore, identifying potentially modifiable risk factors that can inform strategies for prevention is of critical importance (5).
Diet might influence hearing health. Certain micronutrients, including specific vitamins, carotenoids, and long-chain polyunsaturated fatty acids, have been associated with risk of hearing loss (6–8). While most studies have focused on micronutrient intake, dietary pattern analysis is a valuable complementary approach because dietary patterns represent a comprehensive portrayal of food and nutrient consumption and incorporate potential joint effects (9). A healthier overall diet could protect against hearing loss by several mechanisms, including preventing microvascular and macrovascular compromise of cochlear blood flow, curbing oxidative damage, and reducing inflammation.
Greater adherence to the Dietary Approaches to Stop Hypertension (DASH) and Alternate Mediterranean (AMED) diets and higher scores on the Alternate Healthy Eating Index 2010 (AHEI-2010), 3 commonly studied dietary patterns, are associated with lower risk of major chronic diseases and mortality (10–14). The DASH diet was designed to reduce blood pressure, but higher DASH scores are also associated with lower risk of several chronic conditions (10, 11, 15, 16). The AMED score is a measure of adherence to the Mediterranean diet pattern, adapted to reflect diet patterns and behaviors that have been consistently associated with lower risk of chronic diseases (17). The AHEI-2010 is a measure of diet quality based on dietary factors that have been consistently associated with lower risk of chronic diseases in both clinical and epidemiologic studies and is based on the original AHEI that was developed in 2002 (14, 18).
Limited data are available on the relationship between overall diet and risk of acquired hearing loss. A cross-sectional study in the National Health and Nutrition Examination Survey found that a higher Healthy Eating Index score was associated with better high-frequency, but not low-frequency, hearing thresholds (19). In a longitudinal study among 70,966 US women in the Nurses’ Health Study II (NHS II), greater adherence to the DASH and AMED diets and higher AHEI-2010 scores were associated with approximately 30% lower risk of self-reported moderate or worse hearing loss (20). However, longitudinal associations between healthful dietary patterns and audiometric hearing threshold elevation have not previously been investigated. Therefore, we examined the independent relationships between DASH, AMED, and AHEI-2010 adherence scores and risk of decline in pure-tone audiometric hearing thresholds measured longitudinally among a large cohort of US women participating in the Conservation of Hearing Study (CHEARS).
METHODS
Study population
NHS II began in 1989 when 116,430 female registered nurses aged 25–42 years completed a baseline questionnaire. The follow-up over 30 years is >90% of eligible person-time. Information on self-reported hearing status and date of onset of change in hearing was collected beginning in 2009. In 2012, 33,102 participants completed a hearing study supplemental questionnaire (see below); >90% were willing to undergo research hearing assessments. In a subcohort of NHS II, the CHEARS Audiology Assessment Arm (AAA), we assessed longitudinal changes in pure-tone air and bone conduction audiometric hearing thresholds. We identified 19 geographically diverse testing sites and licensed audiologists who adhered to our rigorous research standards and protocols. We reviewed calibration data to ensure that all equipment met American National Standards Institute standards. We a priori chose to invite participants who reported better hearing prior to the baseline assessment to examine early changes in hearing thresholds. Women who reported their hearing was “excellent,” “very good,” or had “a little hearing trouble,” and who had no history of stroke or cancer, other than nonmelanoma skin cancer, and resided within the proximity of one of our testing sites, were invited to participate. We completed baseline testing on 3,749 participants and completed 3-year follow-up testing on 3,136 participants (84%) in June 2018. Characteristics of AAA participants did not differ appreciably from the main cohort. Additionally, characteristics of AAA participants who did not complete follow-up did not differ from those who did (Web Table 1, available at https://academic.oup.com/aje). The majority of participants who were unable to complete follow-up reported that they no longer resided within proximity to a testing site or had scheduling conflicts. We excluded 1 participant for whom diet information was not available; thus, 3,135 women were included in the analysis.
Ascertainment of diet
Semiquantitative food frequency questionnaires assessed usual diet over the previous year starting in 1991, with updates every 4 years. The validated semiquantitative food frequency questionnaire includes >130 foods, >20 beverages, and vitamin/mineral supplement use that account for >90% of measured nutrient intake (21). Briefly, for each food, a commonly used unit or portion size is specified, and participants are asked how often, on average, they had consumed each type of food or beverage during the previous year, with 9 response options. These dietary data collection methods have been validated and used extensively worldwide to examine relationships between diet and numerous health outcomes (22). We used each semiquantitative food frequency questionnaire to calculate scores that measure adherence to the DASH, AMED, and AHEI-2010 dietary patterns; a higher score was indicative of stronger adherence.
The DASH score was constructed according to foods and nutrients emphasized or minimized in the DASH diet (23). The component scores for fruits, vegetables, nuts, and legumes, low-fat dairy products, and whole grains were the participant’s quintile ranking (e.g., quintile 1 was assigned 1 point and quintile 5 was assigned 5 points). For sodium, red and processed meats, and sugar-sweetened beverages, low intake was desired, thus the lowest quintile was given a score of 5 points and the highest quintile a score of 1 point. We summed the component scores to obtain an overall DASH score, ranging from 8–40 (11, 23). The AMED score (range 0–9) is composed of 9 items: vegetables (except potatoes), fruits, nuts, legumes, whole grains, monounsaturated-to-saturated fat ratio, fish, red/processed meats, and alcohol (24). For red/processed meats, 1 point was given when intake was less than the median intake. For alcohol, 1 point was given for intakes within the range 5–15 g/day. For the remaining items, 1 point was given for each desirable component for intake greater than the median; otherwise, no point was assigned. The rationale for variable selection and scoring criteria for the AHEI-2010 is described elsewhere (14). Briefly, AHEI-2010 components were scored from 0 (worst adherence) to 10 (best adherence), and include 11 items: vegetables, fruit, whole grains, nuts, legumes, long-chain n-3 polyunsaturated fatty acids (PUFAs) and other PUFAs, red/processed meat, sugar-sweetened beverages and fruit juice, trans-fat, sodium, and moderate alcohol intake. The possible AHEI-2010 score ranged from 0 (nonadherence) to 110 (perfect adherence).
Ascertainment of audiometric hearing thresholds
Hearing sensitivity was assessed in 2012–2015 (baseline) and in 2015–2018 (follow-up) by pure-tone audiometry measuring air and bone conduction thresholds (the sound intensity of a pure tone at which it is first perceived) for each ear by a licensed audiologist in a sound booth meeting American National Standards Institute (S3.1-1999) standards for ambient noise levels and using equipment calibrated to meet American National Standards Institute (3.6 1996) requirements. The audiology protocol included otoscopy, tympanometry, and the modified Hughson-Westlake procedure (25) to determine the lowest levels at which pure tones (octave and interoctave frequencies from 0.5–8 kHz; in 5-dB steps) were reliably detected at each ear (26). Hearing acuity was categorized according to pure-tone average (PTA) of low-frequency (LPTA0.5,1,2 kHz), mid-frequency (MPTA3,4 kHz), and high-frequency (HPTA6,8 kHz) audiometric hearing thresholds. Low-frequency, mid-frequency, and high-frequency hearing threshold declines were each defined as a ≥5-dB hearing level (HL) worsening of the pure-tone averages at follow-up testing. All testing results were reviewed by the senior study audiologist (C.H.). Individuals with occluding cerumen (earwax) (<1%) were referred for cerumen removal before the hearing assessment was completed.
Ascertainment of covariates
Potential confounders considered in the multivariable analyses included age (continuous), race (white, black, Asian, Hispanic, other ancestry), smoking (never, past, current), body mass index (categories: <25, 25–29, 30–34, 35–39, ≥40), waist circumference (≤70, 71–79, 80–87, ≥88 cm), physical activity (quintiles), hypertension (yes/no), diabetes (yes/no), total energy intake (continuous), aspirin use (none, 1 day/week, 2–3 days/week, 4–5 days/week, ≥6 days/week), acetaminophen use (none, 1 day/week, 2–3 days/week, 4–5 days/week, ≥6 days/week), ibuprofen use (none, 1 day/week, 2–3 days/week, 4–5 days/week, ≥6 days/week), tinnitus (≥several days/week; yes/no), noise exposure (very loud occupational or leisure-time noise exposure ≥3 hours/week during any decade; yes/no), impulse/gunfire noise exposure (≥3 times/year during any decade; yes/no), and baseline pure-tone thresholds (continuous). Covariate information was obtained from validated biennial questionnaires in 2011 (27) except for noise exposure, which was obtained by supplemental questionnaire in 2012 (see below). Indicator variables were created for missing information for each covariate, and these were included in the multivariable models.
Hearing study supplemental questionnaire
In 2012, detailed hearing-related information was self-reported by a representative subcohort of NHS II participants (n = 33,102), with and without reported hearing problems, including information on previous evaluation for hearing loss and identified causes. Participants provided information on lifetime occupational, leisure-time, and residential noise exposure. These data were used to adjust for noise exposure (28) and to conduct sensitivity analyses. Lifetime noise exposure is typically quantified by self-report, but standardized measurement procedures or validated survey instruments that comprehensively measure noise exposure over the lifespan are lacking (29). We therefore developed a detailed assessment of lifetime noise exposure by age. We have previously obtained and validated reliable lifetime information on other factors, such as diet (30) and physical activity (31). While some misclassification occurs with this approach, this noise assessment enabled us to categorize participants according to cumulative lifetime exposure to occupational, recreational, residential, and impulse (e.g., gunfire) noise.
Statistical analysis
The analytical approach was prospective, using dietary and covariate information collected before the baseline audiology assessment. Logistic regression models were used to estimate odds ratios and 95% confidence intervals. We examined the association between quintiles of dietary adherence scores and risk of low-frequency (PTA0.5,1,2 kHz), mid-frequency (PTA3,4 kHz), and high-frequency (PTA6,8 kHz) audiometric hearing threshold elevation, defined as a ≥5-dB HL worsening of the pure-tone average at follow-up testing. Cumulative averages, starting in 1991, were computed for each adherence score to reduce within-person variation and represent long-term intake (32). In our final multivariable models, we retained only those covariates that were significantly associated with the outcome at a significance level of 0.05: age, race, body mass index, smoking, tinnitus, total energy intake, noise exposure, and baseline PTA.
Tests for linear trend were performed by assigning the median value of each category of diet adherence score to all participants in that group. We explored whether including age as a quadratic term in addition to the linear term for age altered the multivariable-adjusted results and also whether the association between diet score and hearing threshold elevation was modified by age or by noise exposure by creating terms for interaction between age and each quintile of diet score for each of the three diet patterns, between history of loud noise exposure and each quintile of diet score for each of the three diet patterns, and between history of impulse/gunfire noise and each quintile of the three diet patterns, and we entered them into our multivariable models. To examine whether the association between diet and hearing threshold elevation varied by baseline PTA, we conducted stratified analyses using cutpoints for mild hearing loss used previously in the literature: baseline PTA <20 dB versus ≥20 dB (33) and baseline PTA ≤25 dB versus >25 dB (34). We conducted analyses stratified by baseline PTA <20-dB HL versus ≥20-dB HL for low, mid-, and high frequencies separately to assess whether results differed according to baseline hearing sensitivity. All P values are 2-tailed and considered statistically significant at P < 0.05. Statistical tests were performed using SAS, version 9.4 (SAS Institute Inc., Cary, North Carolina).
RESULTS
Baseline characteristics of the participants according to quintile of DASH, AMED, and AHEI-2010 diet scores are presented in Table 1 and Web Tables 2 and 3. Overall, the mean age was 59.2 years, and the participants were predominantly white (96.4%). Women in the lowest quintile of DASH score had higher body mass index and larger waist circumference, and they were less physically active than women with higher DASH scores. There were no appreciable differences in exposure to very loud noise or impulse noise. At baseline, the median pure-tone average thresholds in the worse ear for low-frequency, mid-frequency, and high-frequency audiometric hearing thresholds were 10.0 (interquartile range, 6.7–15.0), 15.0 (interquartile range, 10.0–25.0), and 25.0 (interquartile range, 17.5–40.0) dB HL, respectively.
Characteristics According to Quintile of Dietary Approaches to Stop Hypertension Scorea Among Women in the Nurses’ Health Study II Audiometry Assessment Arm, United States, 2011
| DASH Scoreb | |||||||||
|---|---|---|---|---|---|---|---|---|---|
| Characteristic | Quintile 1(n = 628) | Quintile 3(n = 619) | Quintile 5(n = 622) | ||||||
| Mean (SD) | Median (IQR) | % | Mean (SD) | Median (IQR) | % | Mean (SD) | Median (IQR) | % | |
| DASH score | 19.2(17.7–20.2) | 24.5(24.0–25.0) | 29.8(29.0–31.2) | ||||||
| Age, years | 59.2 (4.5) | 59.1 (4.5) | 59.6 (4.4) | ||||||
| Race, white | 96.4 | 97.1 | 96.5 | ||||||
| Body mass indexc | 28.0 (6.6) | 26.3 (5.5) | 25.0 (4.6) | ||||||
| Waist circumferenced, cm | 89.4 (15.3) | 85.4 (13.8) | 82.1 (11.3) | ||||||
| Physical activity, METs/week | 17.0 (19.3) | 26.1 (28.7) | 36.6 (31.9) | ||||||
| Cumulative average energy intake, kcal/day | 1571 (407) | 1765 (406) | 2071 (383) | ||||||
| Smoking status | |||||||||
| Never | 65.6 | 68.1 | 65.6 | ||||||
| Past | 29.0 | 30.9 | 33.7 | ||||||
| Current | 5.3 | 0.9 | 0.7 | ||||||
| Hypertension | 39.3 | 31.0 | 25.6 | ||||||
| Diabetes mellitus | 6.0 | 4.7 | 2.4 | ||||||
| Tinnitus | 9.4 | 11.0 | 9.1 | ||||||
| Ibuprofen use ≥2 days/week | 34.8 | 33.5 | 29.0 | ||||||
| Acetaminophen use ≥2 days/week | 15.0 | 14.3 | 10.8 | ||||||
| Very loud noise exposuree | 34.1 | 34.3 | 35.1 | ||||||
| Impulse noise exposuref | 7.6 | 7.7 | 10.2 | ||||||
| Baseline PTAg, dB HL | |||||||||
| Low frequencyg | |||||||||
| Better ear | 11.2 (7.7) | 10.0 (6.8) | 9.8 (6.3) | ||||||
| Worse ear | 13.0 (8.9) | 11.9 (7.5) | 11.7 (6.9) | ||||||
| Mid-frequencyg | |||||||||
| Better ear | 17.3 (11.4) | 16.2 (10.7) | 16.1 (10.8) | ||||||
| Worse ear | 19.4 (12.2) | 18.6 (11.4) | 18.2 (11.0) | ||||||
| High frequencyg | |||||||||
| Better ear | 28.8 (16.2) | 27.4 (16.2) | 26.4 (15.4) | ||||||
| Worse ear | 31.6 (16.7) | 30.7 (16.9) | 29.2 (15.7) | ||||||
Abbreviations: DASH, Dietary Approaches to Stop Hypertension; IQR, interquartile range; HL, hearing loss; MET, metabolic equivalent; PTA, pure-tone-average; SD, standard deviation.
a Values are means (SD) for continuous variables except where noted as medians (IQR). Values of polytomous variables might not sum to 100% due to rounding. Covariate information assessed in 2011 unless otherwise noted.
b Possible range for DASH score = 8 to 40 points. Higher score represents greater adherence to the Dietary Approaches to Stop Hypertension diet.
c Weight (kg)/height (m)2.
d Waist circumference was assessed in 2005.
e Very loud noise exposure 3 hours per week or more during any decade of life. Information on noise exposure assessed in 2012.
f Impulse noise exposure 3 times per year or more during any decade of life. Information on noise exposure assessed in 2012.
g Baseline audiometry was conducted in 2012–2015. Low-frequency PTA indicates the pure-tone average of hearing thresholds at 0.5, 1, and 2 kHz. Mid-frequency PTA indicates the pure-tone average of hearing thresholds at 3 and 4 kHz. High-frequency PTA indicates the pure-tone average of hearing thresholds at 6 and 8 kHz.
At follow-up (median, 3.1 years; interquartile range, 2.9–3.4), a ≥5-dB HL worsening of hearing sensitivities in either ear occurred among 590 (19%) participants at low-frequency, 1,196 (38%) at mid-frequency, and 1,532 (49%) at high-frequency PTA hearing thresholds (Figure 1). Higher DASH, AMED, and AHEI-2010 scores were associated with lower risk of hearing loss in the mid-frequencies. Higher DASH score was also associated with lower risk of high-frequency hearing loss; nonsignificant inverse associations were observed between higher AMED and AHEI-2010 scores and risk of high-frequency hearing loss (Tables 2–4). Compared with women in the lowest quintile of DASH score, the multivariable-adjusted odds ratio for mid-frequency threshold decline among women in the highest quintile was 0.71 (95% confidence interval (CI): 0.55, 0.92; P for trend = 0.003), and for high-frequency threshold decline the multivariable-adjusted odds ratio was 0.75 (95% CI: 0.59, 0.96; P for trend = 0.02). Similarly, compared with women in the lowest quintile of AMED score, the multivariable-adjusted odds ratio for mid-frequency threshold decline among women in the highest quintile was 0.77 (95% CI: 0.60, 0.99; P for trend = 0.02). There was a suggestion that higher AMED score was associated with lower risk of high-frequency threshold decline (multivariable-adjusted odds ratio = 0.82 95% CI: 0.64, 1.05; P for trend = 0.08). For AHEI-2010, compared with women in the lowest quintile, the multivariable-adjusted odds ratio for mid-frequency threshold decline among women in the highest quintile was 0.72 (95% CI: 0.57, 0.92; P for trend = 0.002) and for high-frequency threshold decline was 0.87 (95% CI: 0.69, 1.09; P for trend = 0.43). There were no significant associations between any of the dietary patterns and low-frequency threshold decline.
Dietary Approaches to Stop Hypertension Score and Odds Ratios for 3-Year Audiometric Hearing Threshold Elevation Among Women in the Nurses’ Health Study IIa, United States, 2012–2018
| Low-Frequency PTAa | Mid-Frequency PTAa | High-Frequency PTAa | |||||||||||||
|---|---|---|---|---|---|---|---|---|---|---|---|---|---|---|---|
| DASH Quintileb | No. of Cases | Age-Adjusted | Multivariable- Adjustedc | No. of Cases | Age-Adjusted | Multivariable- Adjustedc | No. of Cases | Age-Adjusted | Multivariable- Adjustedc | ||||||
| OR | 95% CI | OR | 95% CI | OR | 95% CI | OR | 95% CI | OR | 95% CI | OR | 95% CI | ||||
| 1 | 123 | 1.00 | Referent | 1.00 | Referent | 252 | 1.00 | Referent | 1.00 | Referent | 317 | 1.00 | Referent | 1.00 | Referent |
| 2 | 111 | 0.88 | 0.66,1.18 | 0.89 | 0.66,1.19 | 246 | 0.97 | 0.77,1.22 | 0.95 | 0.76,1.20 | 317 | 1.01 | 0.81,1.27 | 1.00 | 0.79,1.25 |
| 3 | 120 | 0.97 | 0.74,1.29 | 0.98 | 0.73,1.31 | 253 | 1.02 | 0.81,1.28 | 1.00 | 0.79,1.26 | 292 | 0.86 | 0.69,1.08 | 0.85 | 0.68,1.07 |
| 4 | 124 | 0.95 | 0.72,1.25 | 0.93 | 0.70,1.25 | 232 | 0.82 | 0.65,1.03 | 0.79 | 0.62,1.00 | 322 | 0.95 | 0.76,1.18 | 0.91 | 0.72,1.14 |
| 5 | 112 | 0.88 | 0.66,1.17 | 0.85 | 0.62,1.16 | 213 | 0.76 | 0.60,0.96 | 0.71 | 0.55,0.92 | 284 | 0.80 | 0.64,1.00 | 0.75 | 0.59,0.96 |
| P for trend | 0.53 | 0.43 | 0.007 | 0.003 | 0.04 | 0.02 | |||||||||
Abbreviations: CI, confidence interval; DASH, Dietary Approaches to Stop Hypertension; HL, hearing loss; OR, odds ratio; PTA, pure-tone-average.
a Threshold decline defined as ≥5-dB HL worsening of low-frequency (PTA0.5,1,2 kHz), mid-frequency (PTA3,4 kHz), and high-frequency (PTA6,8 kHz) audiometric hearing thresholds.
b Higher score represents greater adherence to the DASH diet; quintile 5 is highest.
c Adjusted for age, race, body mass index, smoking, tinnitus, total energy intake, noise exposure, and baseline PTA.
In multivariable models that further adjusted for waist circumference, physical activity, hypertension, diabetes, aspirin use, acetaminophen use, and ibuprofen use, the results were not appreciably changed. Further adjustment for age as a quadratic term did not materially alter the results. The associations between diet and hearing threshold elevation did not vary by age or by noise exposure (results not shown). In stratified analyses using cutpoints for mild hearing loss used previously in the literature, baseline PTA <20 dB versus ≥20 dB and baseline PTA ≤25 dB versus >25 dB, we did not observe evidence of effect modification by baseline PTA using either cutpoint (results not shown). In sensitivity analyses that excluded participants who reported stroke (n = 1) or cancers other than nonmelanoma skin cancer (n = 45) during follow-up or excluded ears with possible conductive hearing loss (n = 240), the results were not appreciably changed. Because race is a strong risk factor for hearing loss, we conducted a sensitivity analysis that restricted the study population to white participants only, and the results did not appreciably differ (results not shown).
Alternate Mediterranean Diet Score and Odds Ratios for 3-Year Audiometric Hearing Threshold Elevation Among Women in the Nurses’ Health Study IIa, United States, 2012–2018
| Low-Frequency PTAa | Mid-Frequency PTAa | High-Frequency PTAa | |||||||||||||
|---|---|---|---|---|---|---|---|---|---|---|---|---|---|---|---|
| AMED Quintileb | No. of Cases | Age-Adjusted | Multivariable- Adjustedc | No. of Cases | Age-Adjusted | Multivariable-Adjustedc | No. of Cases | Age-Adjusted | Multivariable- Adjustedc | ||||||
| OR | 95% CI | OR | 95% CI | OR | 95% CI | OR | 95% CI | OR | 95% CI | OR | 95% CI | ||||
| 1 | 128 | 1.00 | Referent | 1.00 | Referent | 274 | 1.00 | Referent | 1.00 | Referent | 336 | 1.00 | Referent | 1.00 | Referent |
| 2 | 94 | 0.91 | 0.68,1.23 | 0.91 | 0.68,1.23 | 206 | 0.92 | 0.73,1.16 | 0.92 | 0.72,1.16 | 261 | 0.97 | 0.77,1.22 | 0.94 | 0.75,1.19 |
| 3 | 133 | 0.96 | 0.73,1.26 | 0.95 | 0.72,1.26 | 263 | 0.84 | 0.68,1.05 | 0.83 | 0.67,1.04 | 337 | 0.89 | 0.72,1.10 | 0.85 | 0.69,1.06 |
| 4 | 111 | 0.91 | 0.69,1.21 | 0.90 | 0.67,1.22 | 221 | 0.80 | 0.64,1.00 | 0.77 | 0.61,0.98 | 294 | 0.89 | 0.71,1.11 | 0.84 | 0.67,1.06 |
| 5 | 124 | 0.99 | 0.75,1.31 | 0.96 | 0.71,1.31 | 232 | 0.81 | 0.61,0.96 | 0.77 | 0.60,0.99 | 304 | 0.88 | 0.71,1.09 | 0.82 | 0.64,1.05 |
| P for trend | 0.94 | 0.78 | 0.03 | 0.02 | 0.18 | 0.08 | |||||||||
Abbreviations: AMED, Alternate Mediterranean diet; CI, confidence interval; HL, hearing loss; OR, odds ratio; PTA, pure-tone average.
a Threshold decline defined as ≥5-dB HL worsening of low-frequency (PTA0.5,1,2 kHz), mid-frequency (PTA3,4 kHz), and high-frequency (PTA6,8 kHz) audiometric hearing thresholds.
b Higher score represents greater adherence to a Mediterranean-style diet.
c Adjusted for age, race, body mass index, smoking, tinnitus, total energy intake, noise exposure, and baseline PTA.
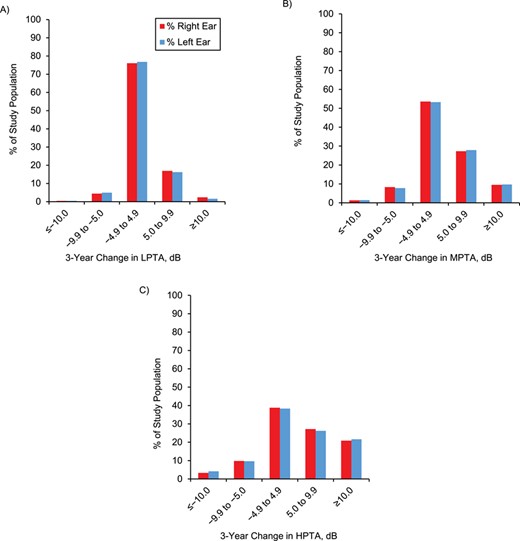
Three-year change in low-, mid-, and high-frequency pure-tone average (PTA) audiometric hearing thresholds among women in the Nurses’ Health Study II Audiometry Assessment Arm, United States, 2012–2018. A) 3-year change in low-frequency PTA (LPTA; 0.5,1,2 kHz) hearing thresholds. B) 3-year change in mid-frequency PTA (MPTA; 3.4 kHz) hearing thresholds. C) 3-year change in high-frequency PTA (HPTA; 6,8 kHz) hearing thresholds. X-axis: specified change in pure-tone average hearing thresholds (dB HL). Y-axis: proportion of the study population with specified change in pure-tone average low-frequency (LPTA0.5,1,2 kHz), mid-frequency (MPTA3.4 kHz), and high-frequency (HPTA6,8 kHz) audiometric hearing thresholds.
We examined whether specific components of DASH, AMED, or the AHEI-2010 predominantly explained the association in analyses with each of the components simultaneously adjusted for the other components (Web Tables 4–6). The point estimates for higher intakes of recommended components tended to be below 1.00, while the point estimates for higher intakes of discouraged components tended to be above 1.00. For all three diet scores, avoidance of red and processed meat was most strongly associated with lower risk (data not shown).
DISCUSSION
In this longitudinal study among 3,135 US women, higher DASH, AMED, and AHEI-2010 scores were independently associated with lower risk of 3-year audiometric hearing threshold elevation. In the mid-frequencies, the odds of hearing loss were almost 30% lower among those whose diets most closely resembled these healthful dietary patterns. In the high frequencies, the odds were 25% lower with the highest DASH score.
Decline in auditory function may result from cumulative contributions from genetics and environmental exposures, including noise and toxins. Individual differences in susceptibility to hearing loss are not well understood, and rates of progression vary widely. In a prospective study among 70,966 NHS II participants, we previously found that greater adherence to these healthful dietary patterns was independently associated with lower risk of self-reported hearing loss (20). For example, women with the highest DASH diet scores had approximately 30% lower risk of self-reported hearing loss of moderate or worse severity. To our knowledge, this is the first longitudinal investigation of dietary patterns and risk of hearing threshold elevation using comprehensive audiologic assessments.
Alternate Healthy Eating Index 2010 Score and Odds Ratios for 3-Year Audiometric Hearing Threshold Elevation Among Women in the Nurses’ Health Study IIa, United States, 2012–2018
| Low-Frequency PTAa | Mid-Frequency PTAa | High-Frequency PTAa | |||||||||||||
|---|---|---|---|---|---|---|---|---|---|---|---|---|---|---|---|
| AHEI-2010 Quintileb | No. of Cases | Age-Adjusted | Multivariable- Adjustedc | No. of Cases | Age-Adjusted | Multivariable- Adjustedc | No. of Cases | Age-Adjusted | Multivariable- Adjustedc | ||||||
| OR | 95% CI | OR | 95% CI | OR | 95% CI | OR | 95% CI | OR | 95% CI | OR | 95% CI | ||||
| 1 | 107 | 1.00 | Referent | 1.00 | Referent | 249 | 1.00 | Referent | 1.00 | Referent | 316 | 1.00 | Referent | 1.00 | Referent |
| 2 | 132 | 1.25 | 0.94,1.67 | 1.27 | 0.95,1.69 | 260 | 1.05 | 0.83,1.31 | 1.03 | 0.82,1.29 | 291 | 0.82 | 0.66,1.03 | 0.85 | 0.68,1.06 |
| 3 | 112 | 1.01 | 0.76,1.36 | 1.02 | 0.76,1.38 | 239 | 0.90 | 0.72,1.13 | 0.87 | 0.69,1.10 | 322 | 0.99 | 0.79,1.24 | 1.01 | 0.81,1.27 |
| 4 | 114 | 1.04 | 0.78,1.40 | 1.07 | 0.80,1.45 | 231 | 0.86 | 0.68,1.08 | 0.83 | 0.66,1.05 | 305 | 0.90 | 0.72,1.12 | 0.93 | 0.74,1.17 |
| 5 | 125 | 1.13 | 0.85,1.51 | 1.16 | 0.86,1.56 | 217 | 0.76 | 0.60,0.96 | 0.72 | 0.57,0.92 | 298 | 0.83 | 0.66,1.03 | 0.87 | 0.69,1.09 |
| P for trend | 0.81 | 0.68 | 0.005 | 0.002 | 0.22 | 0.43 | |||||||||
Abbreviations: AHEI-2010, Alternate Healthy Eating Index 2010; CI, confidence interval; HL, hearing loss; OR, odds ratio; PTA, pure-tone average.
a Threshold decline defined as ≥5-dB HL worsening of low-frequency (PTA0.5,1,2 kHz), mid-frequency (PTA3,4 kHz), and high-frequency (PTA6,8 kHz) audiometric hearing thresholds.
b Higher score represents greater adherence to AHEI-2010.
c Adjusted for age, race, body mass index, smoking, tinnitus, total energy intake, noise exposure, and baseline PTA.
There are several mechanisms by which a healthier diet could protect against hearing loss. Evidence from animal models suggests that dietary factors might influence the susceptibility to sensorineural hearing loss, whether due to auditory injury from inadequate cochlear blood supply, hypoxia and ischemic damage, inflammation, increased oxidative stress, mitochondrial dysfunction, or auditory neurodegeneration (35–38). For example, healthier diets could protect against vascular compromise and reduced cochlear blood flow by promoting beneficial blood lipid profiles, improving endothelial function, lowering blood pressure, and reducing inflammation (10, 11, 39). Reduced blood flow can render cochlear cells vulnerable to ischemic damage (40, 41) and impair maintenance of the cochlear electrical potential, sensory hair cell function, and auditory signal amplification (38, 42–44), and lead to poorer auditory thresholds (44–47). Additionally, these diets emphasize foods that are aggregate sources of compounds needed for antioxidative function and prevention of free radical damage (48, 49) and are associated with lower markers of oxidative stress (50). Sensory hair cells, cells in the stria vascularis, and spiral ganglion neurons all rely on oxidative metabolism due to the high metabolic demands of mechanoelectrical transduction (35). Oxidative stress and free radical damage can lead to impaired auditory signal transduction, cell death, and hearing loss (45–47, 51). Further, healthier dietary patterns were associated with lower risk of neurodegenerative disease (52) and could similarly protect against auditory neuroinflammation and neurodegeneration (37).
While there are shared components of the DASH, AMED, and AHEI-2010 dietary scores, there are several differences in the way the scores are derived and components incorporated. The DASH diet is characterized by higher consumption of fruits, vegetables, nuts, seeds, legumes, lean meats, fish, poultry, low- or nonfat dairy and lower consumption of sweets, saturated fats, and sodium (10, 23). In contrast to DASH, AMED does not prescribe specific amounts for each food group but instead recommends a hierarchy of food groupings such that vegetables (excluding potatoes), fruits, nuts, whole grains, and vegetable oils, particularly olive oil, form the base of the diet; 2 or more servings per week of fish are the second tier; regular but moderate intake of wine or alcohol, poultry, and dairy in moderation are the third tier; and meats and sweets are to be consumed less often (24). Two key features that distinguish the AMED from the DASH pattern are the nearly exclusive use of olive oil and the moderate intake of wine in AMED. It is unclear why only a higher DASH score was statistically significantly associated with lower risk of high-frequency hearing loss while the inverse associations observed for AMED and AHEI-2010 were either marginal or nonsignificant, respectively. These differences could possibly be due to differences in the individual components included in the diet scores or their combined contributions to the overall association, differences in the way the individual components of the scores are categorized, or differences in the way the scores themselves are categorized.
The AHEI-2010 is a diet quality measure, with components included based on evidence in the literature, capturing information on diet quality and lower risk of cardiovascular disease, diabetes, cancer, and other major chronic diseases (53). Similar to AMED and DASH, higher intakes of vegetables and fruit and lower intakes of sodium, added sugar, and saturated fat are emphasized. Specific recommendations are provided for intake of whole grains, protein sources, alcohol intake, and the avoidance of sugar-sweetened beverages (14).
Our findings that the association between diet and threshold decline encompasses frequencies critical for speech understanding are of particular interest (54, 55). Differences in patterns of outer hair cell damage in the low-frequency apical region and the high-frequency basal region of the cochlea and varying associations between environmental exposures and frequency-specific threshold declines have been demonstrated in animal and human studies, suggesting tonotopic differences in the susceptibility to injury from environmental exposures (36, 56). For example, in an animal model of accelerated age-related hearing loss, animals fed a diet enhanced with vitamins A, C, and E and magnesium had less aging-related threshold decline in the low and mid- frequencies but not in the high frequencies compared with animals fed a typical diet (36). A randomized, controlled trial in the Netherlands (a country without folic acid supplementation of the food supply) among older adults with higher plasma homocysteine, found that folic acid supplementation was inversely associated with 3-year low-frequency (PTA0.5,1,2 kHz) threshold decline, but it was not associated with threshold decline in higher frequencies (PTA4,6,8 kHz) (57). Our longitudinal findings are consistent with a cross-sectional study in the National Health and Nutrition Examination Survey that found that higher Healthy Eating Index scores were associated with better prevalent combined mid- and high-frequency (PTA3,4,6,8 kHz) hearing sensitivities but not low-frequency (PTA0.5,1,2 kHz) hearing sensitivity (19).
Our findings also demonstrate that a substantial proportion of participants experienced ≥5-dB PTA declines over 3 years, a relatively short duration. The longstanding convention of classifying hearing thresholds below 20-dB HL in the 0.5–8 kHz range as “clinically normal” might miss impactful hearing loss and merit revision based on a more updated perspective (58). Further, although hearing thresholds that exceed 20- or 25-dB HL but are less than 41-dB HL in the speech frequencies are typically categorized as “mild” hearing loss (59), this term does not capture the considerable adverse implications on communication and speech understanding, particularly in noise, or the added listening effort that can lead to fatigue and social withdrawal and can compromise interpersonal interactions and work productivity. Therefore, the observed declines in auditory sensitivities over a relatively short duration of follow-up could be indicative of consequential functional hearing loss, even among individuals with “clinically normal” audiograms. These findings also suggest that the magnitude of the associations over a longer duration of time might be substantially greater.
Strengths of our study include the large sample size, longitudinal design, use of well-validated and updated diet and covariate exposure information, and longitudinal audiometric assessments conducted by licensed audiologists following rigorous research methods. Our study also has limitations. Dietary information was self-reported. However, we averaged multiple dietary assessments, which reduces random measurement error (21). We adjusted for potentially confounding variables, many of which have previously been demonstrated to be well-reported in this cohort (60, 61); however, we cannot exclude the possibility of residual confounding. Our sample size was modest (n = 3,135), and there were relatively few cases of low-frequency threshold decline. There is variability associated with conventional audiometry, yet all testing was conducted by audiologists following rigorous research protocols. Our study included female health-care professionals, which enhances the validity of the health information collected and reduces the variability in educational achievement and socioeconomic status—thus, there is less of a potential for residual confounding by these factors—but the population was limited to predominantly middle-aged non-Hispanic white women. Further research in additional populations is warranted.
In conclusion, in this longitudinal study of dietary patterns and hearing loss among 3,135 US women, we found that women whose diets most closely resembled the DASH, AMED, or AHEI-2010 dietary pattern had a lower risk of audiometric hearing threshold elevation over 3 years. Eating a healthy diet could be helpful in reducing the risk of acquired hearing loss.
ACKNOWLEDGMENTS
Author affiliations: Channing Division of Network Medicine, Department of Medicine, Brigham and Women’s Hospital, Boston, Massachusetts (Sharon G. Curhan, Molin Wang, Gary C. Curhan); Harvard Medical School, Boston, Massachusetts (Sharon G. Curhan, Gary C. Curhan); Massachusetts General Hospital, Boston, Massachusetts (Christopher Halpin); Department of Biostatistics, Harvard T.H. Chan School of Public Health, Boston, Massachusetts (Molin Wang); Department of Epidemiology, Harvard T.H. Chan School of Public Health, Boston, Massachusetts (Molin Wang, Gary C. Curhan); Vanderbilt Bill Wilkerson Center for Otolaryngology and Communication Sciences and the Department of Otolaryngology, Vanderbilt University Medical Center, Nashville, Tennessee (Roland D. Eavey); and Renal Division, Department of Medicine, Brigham and Women’s Hospital, Boston, Massachusetts (Gary C. Curhan).
This work was supported by the National Institutes of Health (grants DC 010811 and UM1 CA 176726).
We thank the CHEARS Audiology Assessment Arm Site Directors and study sites whose efforts made this project possible: Albert Einstein College of Medicine (Drs. Laura Tocci, Elizabeth Dinces); Callier Center for Communication Disorders (Dr. Kenneth Pugh); Cleveland Hearing and Speech Center (Drs. Michelle Burnett, Laura Brady, Bridgid Whitford); Columbia University Medical Center (Drs. Jaclyn Spitzer, Jessica Galatioto, Anil Lalwani); Henry Ford Hospital (Drs. Jessica Messer, Virginia Ramachandran, Jaclyn Sommerville); Indiana University at Indianapolis (Dr. Rich Miyamoto); LIJ Hearing and Speech Center (Drs. Andrea Vambutas, Leslie Wexler); Massachusetts Eye and Ear Infirmary (Dr. Chris Halpin); Southern New England Ear Nose and Throat (Dr. Ken Yanagisawa); Phelps Memorial Hospital Center (Drs. Judith Christopher, Jessica LaCorte); San Diego Hearing Center (Dr. Blanche Blackington); St. Louis University Medical Center (Dr. David Harris); Stanford Hospital and Clinics (Drs. Gerald Popelka, Matthew Fitzgerald); University of California, Irvine (Dr. Alicia Tratkman); University of Cincinnati (Dr. Stephanie Lockhart); University of Michigan (Drs. Bruce Edwards, Paul Kileny); University of Pennsylvania (Drs. Jennifer Rotz, Michael Ruckenstein); University of Pittsburgh Medical Center (Drs. Catherine Palmer, Lori Zitelli); University of Rochester (Dr. Mark Orlando); Yale University (Dr. Eli Michaelides). We also thank Elaine Coughlin-Gifford for her programming help on this project.
S.G.C. serves as a consultant to Decibel Therapeutics. G.C.C. serves as a consultant to Decibel Therapeutics, AstraZeneca, Shire, Allena Pharmaceuticals, RenalGuard, Orfan Biotech, OM1, and Merck; he receives royalties from UpToDate for being an author and Section Editor. The other authors report no conflicts.

