


Abstract
Intraabdominal fat (IAF) area is often measured indirectly in epidemiologic studies. The authors recruited 147 participants from the second examination (1990–1992) of the Atherosclerosis Risk in Communities Study to examine IAF area and determine whether there were differences in IAF area and distribution by location. Magnetic resonance imaging was used to image four 10-mm slices between the second and fourth lumbar vertebrae by an inverse recovery method, and IAF was calculated from each image. The authors constructed gender-specific mixed models with IAF area as the outcome and the location of imaging along the torso as the independent variable, using random intercepts to account for between-person variation in IAF area. The torso location of IAF measurement was a significant predictor of IAF area in both men (p = 0.02) and women (p < 0.0001) after adjustment for body mass index. A significant positive interaction between age and location was seen in men, with increasing IAF area moving down the torso with older ages. Using magnetic resonance imaging, location along the torso yields different IAF areas and distributions independently of body mass index in both genders, with measurement at the second lumbar vertebra (slightly above the umbilicus) capturing the largest amount of IAF. Studies that attempt to link IAF with cardiovascular disease risk factors should consider measurement location to accurately capture the association.
Obesity is a major risk factor for the development of a number of chronic conditions associated with atherosclerosis and coronary heart disease, such as hypertension, type 2 diabetes mellitus, and dyslipidemia (1–4). Often obesity is defined by weight or body mass index (weight (kg)/height (m)2) and regional adiposity is measured with skinfolds or other anthropometric measurements, such as waist circumference. Overall body weight or body fat alone may not be as important a contributor to chronic disease risk as the regional distribution of body fat. A greater risk of chronic disease mortality and morbidity has been shown with an increased level of abdominal adiposity, rather than gluteal and femoral adiposity (5–8). Many studies have shown an association between increased intraabdominal or visceral adipose tissue and conditions such as hyperinsulinemia, hypertension, and dyslipidemia, independent of general obesity or fatness (9–18).
The metabolic characteristics of intraabdominal fat (IAF) are quite different from those of more peripheral subcutaneous fat. IAF is more lipogenic (8, 19, 20) and releases free fatty acids into the portal circulation, which drains directly into the liver, whereas subcutaneous fat drains into the systemic circulation. The influx of free fatty acids in the liver results in overproduction of hepatic very low density lipoprotein and retention of low density lipoprotein in the bloodstream. This can also lead to a reduced level of high density lipoprotein, possibly from an increased exchange of cholesterol for triglyceride in very low density lipoprotein particles (5, 8, 21).
The measurement of body fat and the differentiation of IAF from subcutaneous fat can be determined by several different methods. Computerized tomography is an accurate measure of IAF, but it requires exposure to ionizing radiation, thus limiting the number of measurements that can safely be performed on an individual. It also involves the difficulty of large-scale population-based screening that is dependent on equipment availability and cost. Dual-energy x-ray absorptiometry exposes subjects to lower doses of ionizing radiation than computerized tomography and is therefore safer for multiple measurements. However, dual-energy x-ray absorptiometry is two-dimensional, measuring body regions such as the trunk, and therefore it cannot differentiate between central IAF and subcutaneous fat (22).
Magnetic resonance imaging (MRI) differentiates fat as precisely as computerized tomography without exposure to ionizing radiation (23, 24). In addition, MRI can easily image multiple slices of an individual to determine the area and volume of different types of fat (total fat, IAF, subcutaneous fat, and spinal fat). Waist circumference is often used in population-based studies as a surrogate measure of IAF because of the impracticability of using MRI in larger studies. Several studies have shown relatively high correlation (0.75–0.91) between IAF and waist circumference in nonobese (22, 25, 26) and mixed (17, 27, 28) cohorts but slightly lower correlation (0.65–0.69) in obese cohorts (29–31), suggesting that a single location of waist circumference measurement may not be uniformly appropriate. Because of its accuracy and safety, MRI remains the standard for measuring different types of adipose tissue.
Studies using MRI have shown that an increased IAF area is associated with cardiovascular disease risk factors (15, 32, 33). All of these studies have relied on the sum of IAF from multiple MRI slices (15, 32) or a single MRI slice (33). Often, the single-slice image used is taken at a location that corresponds to an easily identifiable anatomic landmark, such as location along the lumbar vertebrae (L4–L5) corresponding to the umbilicus.
The goals of this study were to examine IAF area as measured with MRI at four different torso levels, to determine whether there are differences in the amount of IAF depending on torso level, and to examine these differences by gender.
MATERIALS AND METHODS
Subject selection
The sample for this analysis was selected from the Atherosclerosis Risk in Communities (ARIC) Study, described in detail elsewhere (34). The ARIC Study is a multicenter prospective cohort study of 15,792 participants designed to investigate various etiologic factors for atherosclerosis. Participants from the general population aged 45–64 years at the baseline examination (1987–1989) were sampled at four US field centers (Forsyth County, North Carolina; Jackson, Mississippi; suburban Minneapolis, Minnesota; and Washington County, Maryland). Participants in Jackson were all African-American, while participants at the other three field centers were predominantly White. Participants were reexamined every 3 years until 1998.
Participants for this analysis were selected in Forsyth County, North Carolina, during the second ARIC study visit (1990–1992). The population from which this substudy was derived has been described previously (35). In brief, 772 ARIC participants were selected for a case-control study and were free of prevalent cardiovascular and cerebrovascular disease. Of these 772 participants, 386 had preclinical atherosclerosis as measured by B-mode ultrasonography, and they were matched by age (45–54 years and 55–64 years), race (Black and White), and sex to 386 participants who were free of preclinical atherosclerosis.
Volunteers were solicited for the current study from the 772 ARIC participants, and 147 (51 postmenopausal women and 96 men) met the inclusion criteria. None of the 147 experienced claustrophobia or had metal objects in their body (such as pacemakers) or surgical prosthetic devices, which are exclusion criteria for MRI (36).
Magnetic resonance imaging
MRI was done with the participant lying in a supine position. The procedure used has been described in detail previously (36, 37). Images were obtained with a Picker Vista 2055 HP MR scanner (Picker Vista, Cleveland, Ohio) using an inverse recovery method. Four 10-mm slices were taken between the second and fourth lumbar vertebrae, with 5 mm between slices. The images were then transferred to a work station, and specialized software was used to determine total fat area and IAF area for each slice.
IAF area was estimated with a pixel density technique by standardizing the signal intensity of fat on a representative area and circumscribing the entire image to obtain direct measures of total fat, subcutaneous fat, and spinal fat on each sagittal slice. IAF was calculated indirectly as the difference between total fat area and subcutaneous fat and spinal fat area (36).
Covariates
Other measures used for this analysis—body mass index, waist circumference, and age—were measured continuously during the participant's regularly scheduled ARIC clinic visit. Body mass index was calculated as weight in kilograms divided by height in meters squared. Age, waist circumference at the umbilicus, height, and weight were determined according to a standardized protocol as previously described (36).
Statistical analysis
The characteristics of the study sample were calculated as mean values (for continuous variables) and percentages (for categorical variables). The significance of gender differences was determined by t test for continuous variables and chi-squared test for categorical variables. Spearman correlation coefficients were used to assess the correlation between waist circumference and IAF area at each slice, as well as correlations between IAF areas from the different slices. Mixed model regression was done using the torso level of each MRI slice to predict the IAF area. Each participant had IAF measurements at four separate torso levels. Several different covariance structures were evaluated to account for the within-person correlation of IAF measures at different torso levels resulting from multiple measurements per person. The results were found to be robust for the different structures, and compound symmetry was used for the analysis. Random intercepts using SAS PROC MIXED were included to account for between-person correlation in MRI slice location. Gender-specific models were constructed because a significant interaction was seen between slice location and gender. For the men, an interaction term for the interaction between MRI slice location and age was included in all models. Results of two-sided significance tests are presented. SAS software for used for analysis (version 8.1; SAS Institute, Inc., Cary, North Carolina).
RESULTS
Table 1 shows the characteristics of the men and women in this study. All women were postmenopausal. On average, the subjects were overweight (mean body mass index was 26.1 for men and 25.6 for women). Men had a greater amount of IAF than women at each measurement location, and IAF area decreased as the MRI images moved inferiorly down the spine for both genders (from 192.3 cm2 to 136.8 cm2 for men and from 124.8 cm2 to 111.5 cm2 for women). IAF area was highest at the slice corresponding to the second lumbar vertebra (L2) for both men and women, but the decrease in IAF as the images moved down the spinal column was greater in men than in women. A graphic representation of the decrease in IAF area by slice location for both genders is shown in figure 1.
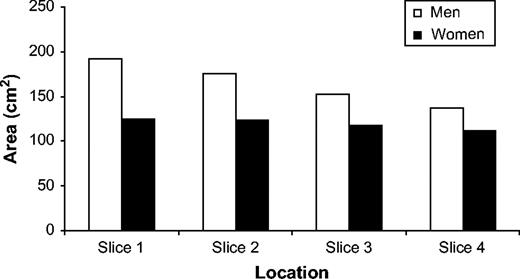
Intraabdominal fat area, as determined by magnetic resonance imaging, according to torso level among 147 subjects recruited from the Atherosclerosis Risk in Communities Study, 1990–1992. Slice 1 corresponds to the level of the second lumbar vertebra, and slice 4 corresponds to the level of the fourth lumbar vertebra.
Characteristics of 147 subjects recruited from the Atherosclerosis Risk in Communities Study, 1990–1992
Men (n = 96) | Women (n = 51) | |||||
|---|---|---|---|---|---|---|
| Mean or % | Range | Mean or % | Range | |||
| Mean age (years)* | 59.6 (5.3)† | 48.0–68.0 | 62.1 (4.0) | 50.0–68.0 | ||
| White race (%) | 95.8 | 92.2 | ||||
| Ever or current smoking (%)* | 84.4 | 54.9 | ||||
| Ever or current alcohol drinking (%)* | 80.2 | 54.9 | ||||
| Ever or current use of hormones (%) | NA‡ | 31.6 | ||||
| Mean body mass index§ | 26.1 (3.1) | 20.0–35.2 | 25.6 (4.1) | 18.4–39.5 | ||
| Mean waist circumference (cm)* | 97.9 (9.5) | 79.0–121.0 | 90.5 (11.4) | 67.0–125.0 | ||
| Mean intraabdominal fat area from L2‡ to L4‡ (cm2) | ||||||
| Slice 1* | 192.3 (82.0) | 36.2–404.3 | 124.8 (64.2) | 43.7–315.2 | ||
| Slice 2* | 175.4 (73.9) | 38.0–358.9 | 123.3 (57.0) | 38.1–301.3 | ||
| Slice 3* | 152.8 (63.5) | 34.6–333.1 | 117.8 (54.5) | 39.8–293.2 | ||
| Slice 4* | 136.8 (52.6) | 43.2–274.6 | 111.5 (49.5) | 31.9–278.3 | ||
p < 0.05 for difference between men and postmenopausal women (two-sided test).
Numbers in parentheses, standard deviation.
NA, not applicable; L2, second lumbar vertebra; L4, fourth lumbar vertebra.
Weight (kg)/height (m)2.
Correlations between IAF areas from the four slices and between IAF areas and waist circumference are shown by gender in table 2. The slices of IAF area were highly correlated with each other in both men and women (correlation coefficients ≥0.89). A higher correlation was seen between waist circumference and IAF area by slice location among women than among men, but the same overall pattern was observed in both genders, with higher correlations at the spinal level corresponding to L2 (slice 1).
Spearman coefficients for correlations between intraabdominal fat (IAF) areas from four magnetic resonance imaging slices and between IAF areas and waist circumference, by gender,* Atherosclerosis Risk in Communities Study, 1990–1992
Slice 1 | Slice 2 | Slice 3 | Slice 4 | Waist circumference | |
|---|---|---|---|---|---|
| Slice 1 | 0.98 | 0.94 | 0.90 | 0.57 | |
| Slice 2 | 0.96 | 0.98 | 0.95 | 0.54 | |
| Slice 3 | 0.94 | 0.96 | 0.97 | 0.49 | |
| Slice 4 | 0.89 | 0.92 | 0.96 | 0.48 | |
| Waist circumference | 0.68 | 0.65 | 0.62 | 0.58 |
Correlations for men are shown in the upper right portion of the table, and correlations for women are shown in the lower left.
Table 3 shows the predicted IAF area for each MRI slice. These predicted mean values were further adjusted by random intercepts to account for within-person correlation between slices (data not shown). For men, as age increased, the amount of IAF increased to a greater extent at slice 1 than at slice 4—a result not seen in women, where the effect of age on IAF area was uniform across slices. Because the men had an interaction between MRI slice location and age, predicted mean values for men are displayed for two ages—50 years and 65 years. The torso level at which IAF was measured was a significant predictor of IAF area in women (p < 0.0001) and was significant for age × slice location in men (p for interaction = 0.02). This significant association persisted in both genders after adjustment for body mass index.
Predicted intraabdominal fat area,* as determined by magnetic resonance imaging, according to torso level in men and women, Atherosclerosis Risk in Communities Study, 1990–1992
Women (n = 51)† | Men (n = 96)‡ | |||||||||
|---|---|---|---|---|---|---|---|---|---|---|
| Age 50 years | Age 65 years | |||||||||
| Mean | 95% CI§ | Mean | 95% CI | Mean | 95% CI | |||||
| Slice 1 | 124.78 | 112.59, 136.97 | 160.79 | 134.95, 186.64 | 209.94 | 192.14, 227.75 | ||||
| Slice 2 | 123.35 | 111.16, 135.54 | 146.41 | 120.56, 172.26 | 191.62 | 173.79, 209.44 | ||||
| Slice 3 | 117.75 | 105.56, 129.94 | 131.77 | 105.92, 157.62 | 164.64 | 146.84, 182.45 | ||||
| Slice 4 | 111.50 | 99.30, 123.69 | 119.31 | 93.46, 145.16 | 146.61 | 128.81, 164.42 | ||||
Predicted mean values presented here were adjusted for body mass index. All models also included random intercepts because of within-person correlation, but these means were computed from the fixed effects only.
p < 0.0001 for slice location.
p = 0.02 for interaction between slice location and age. Ages 50 and 65 years are shown as examples for predicted intraabdominal fat area because of the slice location × age interaction.
CI, confidence interval.
Compared with the most inferior location (slice 4), mean IAF area did not increase linearly in men or women as location moved superiorly, despite the MRI slices' having been taken at equal distances from each other. For the older men (age 65 years) in this study sample, similar increases occurred between slice locations 4 and 3 (18.0 cm2) and 2 and 1 (18.3 cm2), with a larger increase between slice locations 3 and 2 (27.0 cm2). For the younger men (age 50 years) in the sample, smaller increases were observed with similar increases in mean IAF area between slice locations 3 and 2 (14.6 cm2) and 2 and 1 (14.4 cm2), with a slightly smaller increase between slices 4 and 3 (12.5 cm2). Among the postmenopausal women, similar increases in mean IAF area were seen between slice locations 4 and 3 (6.3 cm2) and 3 and 2 (5.6 cm2), with a very small increase between slices 2 and 1 (1.4 cm2).
The random intercepts showed high between-person variation that deviated from the population average intercept for IAF. This existed in both genders but was more pronounced in the men. Among the men, the population average intercept was −198.08, with participant-specific IAF values deviating from the overall average by −127.7 to 97.87, causing the intercept to range from −325.78 to −100.21. For the women, the population average intercept was −102.45, with participant-specific values deviating from −63.02 to 87.97, causing the intercept to range from −165.47 to −14.48. Therefore, all models were adjusted for between-person differences in the association between torso level and IAF area.
DISCUSSION
This study was designed to assess whether there were differences in IAF area by torso level in a population-based sample using MRI imaging. We also aimed to examine the torso-level differences in IAF area by gender.
Our results showed that IAF area was significantly associated with torso level among men and postmenopausal women. This significant association was found even though IAF area at each torso level was highly correlated with that at the other torso levels. Despite the high correlations found in IAF area between torso levels, examination of the relation between torso level of measurement and IAF area quantified differences in IAF area.
The association between location of MRI along the spine and IAF area was not consistent by gender. This was expected, since men more often have the characteristic android body shape, with a higher waist:hip ratio and less subcutaneous fat than women. The men had a higher IAF area than women at each measurement location, which is in agreement with many studies (24, 38) concluding that men have a greater tendency to store fat within the abdominal cavity.
In addition to higher IAF at each measurement location in comparison with women, the men also had a steeper slope or a greater decrease in the amount of IAF per MRI slice as the imaging moved caudally. The women had a less extreme decrease in IAF area by torso level. The differences in IAF area by torso level among the women, though less pronounced, achieved statistical significance. These statistically significant results persisted in both genders after adjustment for body mass index.
The results of this study are in agreement with earlier results from Ross et al. (30). Their study included 57 young (mean age = 37 years) obese men and women and used MRI to measure IAF. Their results showed that IAF decreased significantly in both genders as the imaging moved inferiorly down the spine, with a more dramatic decrease being seen in the men (30). They also showed that the men had significantly greater IAF deposits than the women at all spinal levels. Our study had a larger sample, greater variation in body mass index, and older participants. This older age group may be the more appropriate age range for measuring IAF, because of the changes in fat accumulation that occur in middle age and beyond (15). Han et al. (25) found similar results in 16 male subjects but not in seven female subjects. These were all subjects with type 2 diabetes mellitus, and the low number of women in their study makes interpretation difficult.
The effect of torso level on IAF area was modified by age in the men but not in the women. Men had a higher IAF area at each slice location with increasing age, which is consistent with the findings of other studies (25, 39, 40), although those studies assessed IAF using one computerized tomography slice. Schwartz et al. (39) showed an increase in IAF and a decrease in peripheral fat that began in middle age and continued into older age among 32 men aged 18–85 years. Han et al. (25) studied 71 men aged 19–85 years and found that at a given waist circumference, men aged 50 years or more had significantly more IAF than men below age 50 years. Kotani et al. (40) also found, by studying 66 men aged 50 years or more, that IAF deposits increased with increasing age. The current study suggests that while women accumulate IAF with age, in men the effect of age leads to a greater increase at the more superior spinal levels.
The women in this study did not exhibit the same interaction between IAF and age, despite several studies that have shown a shifting of fat from more peripheral stores to visceral stores with aging (28, 40–42). This shift in fat stores may occur at or around the menopausal transition, which takes place at a younger age than that of our female participants. The 96 women in a study by Kotani et al. (40) had large increases in IAF after age 50 years, and the IAF increases in postmenopausal women equaled the IAF increases that occurred in men with aging. Our study results were in contrast to this marked increase in IAF with increasing age and were similar to the results obtained by other investigators (15, 43). Kanaley et al. (15) showed that age was not a significant predictor of IAF among 78 women aged 45–60 years, and there was not the expected dramatic increase in IAF with age. Another study showed no difference in the size of adipocytes in the intraabdominal deposits between nine premenopausal women and 10 postmenopausal women (43). Our results are unique in that we included only postmenopausal women within a relatively narrow age range and we examined changes occurring within the postmenopausal period, rather than comparing premenopause with postmenopause or evaluating change at the point of menopausal transition.
There was a significant amount of variation in the quantity of IAF that was not entirely explained by the fixed effects. The random intercepts showed fairly substantial participant-specific deviations from the population average, suggesting that both torso level and interindividual differences contribute to IAF deposition.
Our finding that the location of an MRI slice along the torso is associated with IAF area has important implications. Measures of IAF, quantified by MRI, computerized tomography, or waist circumference (as a surrogate), are often used in epidemiologic studies in an attempt to understand the relation between central fat distribution and chronic disease and disease risk factors. To our knowledge, this is the first study to examine differences in IAF area by location, as well as by age and gender. Because IAF area was so variable within location, and also differed by gender and by age within men, a single measure of IAF at a single location may not be sufficient to determine the effect of IAF on chronic disease risk.
Waist circumference is often used as a surrogate for IAF in population-based studies because of safety and cost issues. Many studies have shown high correlation between waist circumference and IAF area using computerized tomography or MRI with a single slice at L4–L5 (17, 22, 25–31); this study showed lower correlations. An easily identifiable anatomic landmark is typically used to measure waist circumference—usually the umbilicus, since that is thought to correspond to L4–L5. The results of this study also showed the lowest correlation between IAF area and waist circumference at the spinal location that corresponds to L4. Therefore, waist circumference measurements taken using the umbilicus as a landmark may not capture the level at which the greatest deposition of IAF occurs. With aging and obesity, there can be gravitational changes in the location of the umbilicus, altering the spinal level to which the umbilicus corresponds. Errors in measurement of IAF area can occur in some subgroups of people with these changes in the location of the umbilicus. The use of bony landmarks, such as the trochanter, iliac crest, or xiphisternum, rather than the umbilicus could increase the accuracy of these surrogate measurements.
Measurements using MRI or computerized tomography also rely on the umbilicus to signify the level of L4–L5 or use two thirds of the distance between the xiphisternum and the anterior iliac crest, which corresponds to L2–L3. There is no clear consensus on which spinal location is the most appropriate for measuring IAF, and it is dependent on what disease outcome is being studied. Understanding the differences in IAF area by spinal location, as shown in this study, gives further insight into the measurement of regional fat distribution.
We acknowledge that there are limitations to this study. This cohort consisted of middle-aged, predominantly White men and women, so it is unclear whether these results can be extended beyond this study group. However, the study sample was derived from a large, well-defined population-based sample, and a standardized protocol was followed for all participants.
In summary, the location of MRI along the spine or torso yields different quantities of IAF independently of body mass index for both men and postmenopausal women. These results suggest that measurement at L2 captures the largest amount of IAF and that the association between torso level and IAF is modified by age in men but not in women. Within genders, there is a substantial difference in the amount of IAF. Although IAF values are highly correlated between slices, the absolute values differ. This absolute quantity of visceral fat is likely to be differentially related to risk factors for cardiovascular disease, and these results provide additional information for guiding research in population-based IAF measurement using external circumference measures. Multiple circumference measures taken at different anatomic levels may help to better characterize persons at higher risk of atherosclerosis and its risk factors, particularly among men.
The Atherosclerosis Risk in Communities (ARIC) Study is carried out as a collaborative study supported by National Heart, Lung, and Blood Institute contracts N01-HC-55015, N01-HC-55016, N01-HC-55018, N01-HC-55019, N01-HC-55020, N01-HC-55021, and N01-HC-55022.
The authors thank the staff of the ARIC Study for their important contributions.
Conflict of interest: none declared.
References
Kaplan NM. The deadly quartet. Upper-body obesity, glucose intolerance, hypertrigylceridemia, and hypertension.
Frayn KN, Coppack SW. Insulin resistance, adipose tissue, and coronary heart disease.
Pi-Sunyer FX. Comorbidities of overweight and obesity: current evidence and research issues.
Lapidus L, Bengtsson C, Larsson B, et al. Distribution of adipose tissue and risk of cardiovascular disease and death: a 12 year follow up of participants in the population of women in Gothenburg, Sweden.
Ohlson L-O, Larsson B, Svardsudd K, et al. The influence of body fat distribution on the incidence of diabetes: 13-year follow-up of participants in the study of men born in 1913.
Bjorntorp P. “Portal” adipose tissue as a generator of risk factors for cardiovascular disease and diabetes.
Herd SL, Gower BA, Dashti N, et al. Body fat, fat distribution and serum lipids, lipoproteins and apolipoproteins in African-American and Caucasian-American prepubertal children.
Raji A, Seely EW, Arky RA, et al. Body fat distribution and insulin resistance in healthy Asian Indians and Caucasians.
Nguyen-Duy TB, Nichanam MZ, Church TS, et al. Visceral fat and liver fat are independent predictors of metabolic risk factors in men.
Hernandez-Ono A, Monter-Carreola A, Zamora-Ginzalez J, et al. Association of visceral fat with coronary risk factors in a population-based sample of postmenopausal women.
Peiris AN, Southman MS, Hoffman RG, et al. Adiposity, fat distribution, and cardiovascular risk.
Kissebah AH, Vydelingum N, Murray R, et al. Relation of body fat distribution to metabolic complications of obesity.
Kanaley JA, Sames C, Swisher L, et al. Abdominal fat distribution in pre- and postmenopausal women: the impact of physical activity, age, and menopausal status.
Pouliot MC, Despres JP, Nadeau A. Visceral obesity in men: association with glucose tolerance, plasma insulin, and lipoprotein levels.
Despres JP, Nadeau A, Tremblay A, et al. Role of deep abdominal fat in the association between regional adipose tissue distribution and glucose tolerance in obese women: importance of intra-abdominal fat.
Albu JB, Murphy L, Frager DH, et al. Visceral fat and race-dependent health risks in obese nondiabetic premenopausal women.
Matsuzawa Y, Shimonura I, Nakamura T, et al. Pathophysiology and pathogenesis of visceral fat obesity.
Despres JP, Moorjani S, Lupine PJ, et al. Regional distribution of body fat, plasma lipoproteins, and cardiovascular disease.
Kamel EG, McNeill G, Han TS, et al. Measurement of abdominal fat by magnetic resonance imaging, dual-energy X-ray absorptiometry and anthropometry in non-obese men and women.
Seidell JC, Bakker CJ, van der Kooy K. Imaging techniques for measuring adipose tissue distribution—a comparison between computed tomography and 1.5T magnetic resonance.
Sobol W, Rossner S, Hinson B, et al. Evaluation of a new magnetic resonance imaging method for quantifying adipose tissue areas.
Han TS, McNeill G, Seidell JC, et al. Predicting intra-abdominal fatness from anthropometric measures: the influence of stature.
Ashwell M, Cole TJ, Dixon AK. Ratio of waist circumference to height is strong predictor of intra-abdominal fat. (Letter).
Seidell JC, Perusse L, Despres JP, et al. Waist and hip circumferences have independent and opposite effects on cardiovascular risk factors: The Quebec Family Study.
Pascot A, Lemieux S, Lemieux I, et al. Age-related increase in visceral adipose tissue and body fat and the metabolic risk profile of premenopausal women.
Ross R, Shaw KD, Martel Y, et al. Adipose tissue distribution measured by magnetic resonance imaging in obese women.
Ross R, Shaw KD, Rissanen J, et al. Sex differences in lean and adipose tissue distribution by magnetic resonance imaging: anthropometric relationships.
Anderson PJ, Chan JC, Chan YL, et al. Visceral fat and cardiovascular risk: factors in Chinese NIDDM patients.
Hunter GR, Giger JN, Weaver M, et al. Fat distribution and cardiovascular risk in African-American women.
Solano MP, Perry AC, Wang V, et al. Insulin resistance but not visceral adipose tissue is associated with plasminogen activator inhibitor type 1 levels in overweight and obese premenopausal African-American women.
The ARIC Investigators. The Atherosclerosis Risk in Communities (ARIC) Study: design and objectives.
Heiss G, Sharrett AR, Barnes R, et al. Carotid atherosclerosis measured by B-wave ultrasound in populations: associations with cardiovascular risk factors in the ARIC Study.
Schreiner PJ, Terry JG, Evans GW, et al. Sex-specific associations of magnetic resonance imaging-derived intra-abdominal and subcutaneous fat areas with conventional anthropometric indices. The Atherosclerosis Risk in Communities Study.
Terry JG, Hinson WH, Evans GW, et al. Evaluation of magnetic resonance imaging for quantification of intra-abdominal fat in human beings by spin-echo and inversion-recovery protocols.
Lemieux S, Despres JP, Moorjani S, et al. Are gender differences in cardiovascular disease risk factors explained by the level of visceral adipose tissue?
Schwartz RS, Shuman WP, Bradbury VL, et al. Body fat distribution in healthy young and older men.
Kotani K, Tokunga K, Fujioka S, et al. Sexual dimorphism of age-related changes in whole-body fat distribution in the obese.
Shimokata J, Andres R, Coon PJ, et al. Studies in the distribution of body fat. II. Longitudinal effects of changes in weight.
Lithell H, Boberg J. The lipoprotein lipase activity of adipose tissue from different sites in obese women and the relationship to the cell size.

