


Abstract
Recent studies have shown that people whose early growth is poor have an increased risk of sarcopenia. Sarcopenia is an important risk factor for falls, but it is not known whether poor early growth is related to falls. The authors investigated this association in the Hertfordshire Cohort Study (1998–2004), where 2,148 participants from the United Kingdom provided their history of falls. Grip strength was used as a marker of sarcopenia. Birth weight, weight at 1 year, and conditional infant growth were analyzed in relation to history of falls. The prevalence of any fall in the last year was 14.3% for men and 22.5% for women. Falls in the last year were inversely related to adult grip strength, height, and walking speed in men and women as well as to lower conditional infant growth in men (odds ratio = 1.27, 95% confidence interval: 1.04, 1.56 per standard deviation decrease in conditional infant growth; p = 0.02). This association was attenuated after adjustment for grip strength. These findings support an association between poor early growth and falls in older men that appears to be mediated partly through sarcopenia. The lack of a relation with birth weight suggests that postnatal rather than prenatal influences on muscle growth and development may be important regarding the risk of falls in later life.
The high prevalence and incidence of falls in community-dwelling older people has been reported for many years (1), and there is growing recognition of the serious health consequences in terms of disability, morbidity, and mortality as well as the economic cost (2–5). More than 400 potential risk factors for falling have been identified, but a consistent finding is the link with sarcopenia: loss of muscle mass and strength with age (6, 7). This finding has led to the inclusion of targeted exercise programs in multifactorial interventions to reduce the risk of falling by maximizing muscle function in older people (8–13). However, some difficulties remain in implementing effective secondary prevention programs, and progress in primary prevention in terms of developing both suitable screening tools and effective interventions has been slower (14, 15). At present, the best predictor of experiencing a fall is having had one previously.
Investigating the risk factors for sarcopenia is one approach to the primary prevention of falls. The most important modifiable influence is level of physical activity, but it is of note that muscle loss occurs even in elite athletes who maintain high levels of exercise in later life (16). There have been estimates of moderate heritability (17) with a number of candidate genes proposed (18–20), but considerable unexplained variation remains in both the muscle mass and strength of men and women in later life. Recent work has shifted attention away from adult influences on muscle and focused on factors operating earlier in the life course (21). A number of epidemiologic studies have now shown that men and women who grew less well in early life have lower adult muscle mass and strength independent of adult size (21–26). The underlying mechanism is not known but may reflect persisting altered muscle fiber type, proportion, or quality.
It is not known whether poor early growth is related to falls in later life. We investigated the interrelation between early growth, sarcopenia, and falls in a group of older men and women participating in the Hertfordshire Cohort Study.
MATERIALS AND METHODS
Study population
The Hertfordshire Cohort Study has been described in detail previously, including comparison with the nationally representative Health Survey for England (27). This comparison demonstrated broad similarities between the two cohorts, for example, with regard to socioeconomic, anthropometric, medical, and functional characteristics of the participants, although there was some evidence of a “healthy subject” effect. The historical background for the study originates in the period between 1911 and 1948, when midwives recorded information on birth weight and weight at 1 year for infants born in the English county of Hertfordshire. The records for people born in 1911–1930 have been used in a series of studies linking early growth to health in later life. In 1998, a younger cohort was recruited to participate in studies examining the interactions between early life, diet, adult lifestyle, and genetic factors as determinants of adult disease. A total of 3,822 men and 3,284 women born in Hertfordshire between 1931 and 1939 and still living in the county were traced with the aid of the National Health Service central registry in Southport and were confirmed as currently registered with a general practitioner in Hertfordshire. Fieldwork was conducted over a period of 5 years phased by region of Hertfordshire (East, North, West). Initial findings from this study were based on participants from East Hertfordshire (21, 22); this study includes participants from the whole county.
Permission to contact 3,126 (82 percent) men and 2,973 (91 percent) women was obtained from their general practitioners because registration with a state general practitioner is nearly universal in England. A total of 1,684 (54 percent) men and 1,541 (52 percent) women aged 59–73 years agreed to take part in a home interview, during which trained nurses collected information on participants' medical and social history, including self-reported walking speed (six categories: unable to walk, very slow, stroll at an easy pace, normal speed, fairly brisk, and fast), alcohol intake (units per week), smoking habit (three categories: never, former, and current smoker), and social class (classified by using the 1990 Office for Population Censuses and Surveys Standard Occupational Classification scheme for occupation and social class, where social class was identified on the basis of own current or most recent full-time occupation for men and never-married women and on the basis of the husband's occupation for ever-married women). A question about having had any falls in the past year was included in the home interview part way through the study; falls data were therefore available for only 941 men and 1,398 women. Eight hundred sixty-six (92 percent) of these men and 1,282 (92 percent) of these women subsequently attended a clinic for a number of investigations (median time between home interview and clinic: 5 weeks). Anthropometry included measurement of height and weight (28). Skinfold thickness was measured with Harpenden skinfold calipers in triplicate at the triceps, biceps, and subscapular and suprailiac sites on the nondominant side (29). Grip strength was measured three times on each side by using a Jamar handgrip dynamometer (30) as a marker of sarcopenia (31).
Intraobserver and interobserver studies were carried out at regular intervals during the fieldwork to ensure comparability of measurements within and between observers. The study had ethical approval from the Hertfordshire and Bedfordshire Local Research Ethics Committee, and all subjects gave written informed consent.
Statistical analysis
The best of the six grip measurements was coded for analyses. Body mass index was calculated as weight in kilograms divided by height in meters squared. The averages of the triplicate skinfold measures at each site were taken, and body fat percentage was derived from the four average skinfold measurements according to the method proposed by Durnin and Womersley (32). Fat mass was derived by multiplying body weight by body fat percentage. Nonfat mass was estimated by subtracting fat mass from body weight. Normality of variables was assessed, and body mass index and fat mass were loge transformed.
Sex-specific standard deviation scores were calculated for birth weight, weight at 1 year, and conditional infant growth (equivalent to a standard deviation score for weight at 1 year independent of birth weight) (33). The standard deviation score for conditional infant growth was free of the artifactual effects of regression to the mean and enabled the effects of birth weight and infant weight gain on falls risk to be clearly distinguished.
All analyses were carried out for men and women separately by using the Stata statistical software package, release 8.0 (Stata Corporation, College Station, Texas, 2003). The genders were analyzed separately because of a priori knowledge that both rate of falls and patterns of early growth differ between men and women, although there was no statistical evidence of an interaction between gender and early growth on history of falls in these data.
Subject characteristics were summarized for fallers and nonfallers by using means and standard deviations or frequency and percentage distributions. Two-sample t tests and chi-squared tests were used to test univariate relations between each subject characteristic and history of falls. Characteristics significantly associated with history of falls in univariate analyses were subsequently included in multivariate logistic regression models; results were presented as odds ratios for history of falls with associated 95 percent confidence intervals and p values. However, odds ratios were likely to overestimate the relative risk in this study because falls were common.
RESULTS
The characteristics of the 2,148 study participants are shown in table 1 according to history of falls. The prevalence of having had a fall in the past year was 14.3 percent in men and 22.5 percent in women (odds ratio for history of falls among women compared with men: 1.74, 95 percent confidence interval: 1.38, 2.19; p < 0.001). Men who had fallen in the past year had lower weight at 1 year and conditional infant growth, lower grip strength, and shorter stature and were more likely to report slower walking speeds. Women who had fallen in the past year had lower grip strength, shorter stature, and greater body mass index and were more likely to report slower walking speeds.
Subject characteristics according to gender and history of falls, Hertfordshire Cohort Study, United Kingdom, 1998–2004*
Characteristic | Fall in the past year | ||||||||||||||||||
|---|---|---|---|---|---|---|---|---|---|---|---|---|---|---|---|---|---|---|---|
| Men (n = 866) | Women (n = 1,282) | ||||||||||||||||||
| No (n = 742) | Yes (n = 124) | p value† | No (n = 993) | Yes (n = 289) | p value† | ||||||||||||||
| Birth weight (pounds‡) | 7.7 (1.2)§ | 7.7 (1.2) | 0.86 | 7.4 (1.1) | 7.4 (1.2) | 0.97 | |||||||||||||
| Weight at 1 year (pounds) | 22.7 (2.3) | 22.2 (2.2) | 0.04 | 21.5 (2.2) | 21.3 (2.3) | 0.15 | |||||||||||||
| Conditional infant growth (standard deviation score) | 0.12 (0.97) | –0.10 (0.97) | 0.02 | 0.09 (0.98) | –0.01 (1.00) | 0.13 | |||||||||||||
| Age (years) | 66.8 (2.6) | 66.9 (2.6) | 0.72 | 66.8 (2.6) | 66.9 (2.9) | 0.48 | |||||||||||||
| Grip strength (kg) | 44.3 (7.6) | 41.8 (8.0) | 0.009 | 26.7 (5.8) | 25.7 (5.8) | 0.01 | |||||||||||||
| Height (cm) | 174.4 (6.3) | 173.2 (6.3) | 0.05 | 161.0 (5.8) | 160.2 (6.0) | 0.06 | |||||||||||||
| Weight (kg) | 82.8 (12.6) | 82.3 (14.6) | 0.70 | 71.1 (13.3) | 72.5 (13.5) | 0.11 | |||||||||||||
| Fat mass (kg)¶ | 23.2 (1.4) | 22.4 (1.4) | 0.27 | 27.5 (1.3) | 28.4 (1.3) | 0.12 | |||||||||||||
| Nonfat mass (kg) | 58.5 (6.9) | 58.7 (8.2) | 0.81 | 42.3 (5.9) | 42.9 (6.0) | 0.13 | |||||||||||||
| Body mass index (kg/m2)¶ | 27.0 (1.10) | 27.1 (1.2) | 0.73 | 27.0 (1.2) | 27.7 (1.2) | 0.01 | |||||||||||||
No. | % | No. | % | No. | % | No. | % | ||||||||||||
| Walking speed | |||||||||||||||||||
| Very slow | 26 | 3.5 | 13 | 10.6 | 54 | 5.4 | 36 | 12.5 | |||||||||||
| Stroll at an easy pace | 174 | 23.5 | 37 | 30.1 | 182 | 18.3 | 74 | 25.6 | |||||||||||
| Normal speed | 300 | 40.4 | 35 | 28.5 | 0.001 | 467 | 47.0 | 110 | 38.1 | <0.001 | |||||||||
| Fairly brisk | 212 | 28.6 | 35 | 28.5 | 231 | 23.3 | 57 | 19.7 | |||||||||||
| Fast | 30 | 4.0 | 3 | 2.4 | 59 | 5.9 | 12 | 4.2 | |||||||||||
| Social class# at birth | |||||||||||||||||||
| I-IIINM | 107 | 14.4 | 20 | 16.1 | 144 | 14.5 | 50 | 17.3 | |||||||||||
| IIIM-V | 594 | 80.1 | 96 | 77.4 | 0.79 | 788 | 79.4 | 215 | 74.4 | 0.18 | |||||||||
| Armed services/unclassified | 41 | 5.5 | 8 | 6.5 | 61 | 6.1 | 24 | 8.3 | |||||||||||
| Adult social class# | |||||||||||||||||||
| I-IIINM | 308 | 41.5 | 55 | 44.4 | 430 | 43.3 | 113 | 39.1 | |||||||||||
| IIIM-V | 427 | 57.6 | 68 | 54.8 | 0.83 | 562 | 56.6 | 176 | 60.9 | 0.38 | |||||||||
| Smoking habit | |||||||||||||||||||
| Never | 254 | 34.2 | 41 | 33.1 | 627 | 63.3 | 169 | 58.5 | |||||||||||
| Former | 385 | 51.9 | 67 | 54.0 | 268 | 27.0 | 95 | 32.9 | |||||||||||
| Current | 103 | 13.9 | 16 | 12.9 | 0.90 | 96 | 9.7 | 25 | 8.7 | 0.15 | |||||||||
| Alcohol intake (units per week) | |||||||||||||||||||
| ≤21 for men, ≤14 for women | 549 | 80.8 | 95 | 76.6 | 943 | 95.0 | 271 | 93.8 | |||||||||||
| >21 for men, >14 for women | 142 | 19.2 | 29 | 23.4 | 0.27 | 50 | 5.0 | 18 | 6.2 | 0.43 | |||||||||
Grip strength data missing for two men and three women. Height data missing for one man and two women. Weight data missing for two men and one woman. Walking speed missing for one man. Adult social class unclassified for eight men and one woman. Smoking data missing for one woman. Alcohol intake data missing for one man.
p values for differences in characteristics according to history of falls obtained from two-sample t tests (for continuously distributed variables) or chi-squared tests (for categorical variables).
One pound = 0.454 kg.
Except as noted, values in this part of the table are expressed as mean (standard deviation).
In this row, values are expressed as geometric mean (standard deviation).
Social class categories: I, professional occupations; II, managerial and technical occupations; III, skilled occupations; IIIN, nonmanual; IIIM, manual; IV, partly skilled occupations; V, unskilled occupations.
Birth weight, adult weight, fat mass and nonfat mass, social class, smoking habit, and alcohol intake were not related to history of falls in men or women and were not considered further in analyses. Chronologic age was not associated with history of falls in men or women, but this variable was included in mutually adjusted analyses. Conditional infant growth was more strongly related to history of falls in men than weight at 1 year and was therefore included in mutually adjusted analyses. Conditional infant growth was also included in mutually adjusted models for women owing to a priori interest in its relation with falls risk in adulthood.
Multivariate analyses were used to investigate the relation between history of falls and conditional infant growth after adjustment for adult grip strength, height, age, and walking speed in men and after adjustment for adult grip strength, height, age, walking speed, and body mass index in women. Among men, grip strength and walking speed remained strongly associated with a history of falls, but the associations between conditional infant growth or adult height and history of falls were attenuated (table 2). Walking speed was the only characteristic associated with history of falls in the mutually adjusted model for women (table 2). Figure 1 displays the univariate and mutually adjusted odds ratios for history of falls in men. Consideration of effect size in a sequence of three separate multivariate models for men (for conditional infant growth and grip strength, conditional infant growth and walking speed, and finally conditional infant growth and adult height as predictors of history of falls) suggested that attenuation of the association between conditional infant growth and history of falls was slightly greater after adjusting for grip strength than after adjusting for walking speed or adult height, although all factors reduced the effect size (odds ratios for history of falls per standard deviation decrease in conditional infant growth: 1.21, 95 percent confidence interval: 0.98, 1.48, p = 0.08 adjusted for grip strength; 1.24, 95 percent confidence interval: 1.00, 1.52, p = 0.05 adjusted for walking speed; and 1.23, 95 percent confidence interval: 0.99, 1.52; p = 0.06 adjusted for adult height). There were no quadratic relations between early growth and falls.
Odds ratios for history of falls in the past year in relation to early-life and adult characteristics, Hertfordshire Cohort Study, United Kingdom, 1998–2004
History of falls in the past year in relation to | Men | Women | ||||||||||||||||||||
|---|---|---|---|---|---|---|---|---|---|---|---|---|---|---|---|---|---|---|---|---|---|---|
| Univariate OR* | 95% CI* | p value | Mutually adjusted OR | 95% CI | p value | Univariate OR | 95% CI | p value | Mutually adjusted OR | 95% CI | p value | |||||||||||
| Conditional infant growth (per SD* decrease) | 1.27 | 1.04, 1.56 | 0.02 | 1.18 | 0.95, 1.47 | 0.13 | 1.11 | 0.97, 1.27 | 0.13 | 1.08 | 0.94, 1.25 | 0.27 | ||||||||||
| Grip strength (per SD decrease) | 1.36 | 1.13, 1.64 | 0.001 | 1.23 | 1.00, 1.52 | 0.05 | 1.18 | 1.04, 1.34 | 0.01 | 1.06 | 0.92, 1.22 | 0.43 | ||||||||||
| Height (per SD decrease) | 1.21 | 1.00, 1.47 | 0.05 | 1.03 | 0.82, 1.28 | 0.81 | 1.14 | 0.99, 1.30 | 0.06 | 1.07 | 0.93, 1.24 | 0.35 | ||||||||||
| Body mass index (per SD decrease) | Not included | 1.17 | 1.03, 1.33 | 0.02 | 1.06 | 0.92, 1.22 | 0.43 | |||||||||||||||
| Walking speed | ||||||||||||||||||||||
| Very slow | 5.00 | 1.28, 19.50 | 4.13 | 1.04, 16.43 | 3.28 | 1.55, 6.94 | 2.76 | 1.24, 6.14 | ||||||||||||||
| Stroll at an easy pace | 2.13 | 0.62, 7.34 | 2.00 | 0.57, 6.99 | 2.00 | 1.02, 3.93 | 1.81 | 0.90, 3.66 | ||||||||||||||
| Normal speed | 1.17 | 0.34, 4.02 | 1.21 | 0.35, 4.22 | 1.16 | 0.60, 2.23 | 1.08 | 0.56, 2.10 | ||||||||||||||
| Fairly brisk | 1.65 | 0.48, 5.70 | 1.76 | 0.50, 6.10 | 1.21 | 0.61, 2.41 | 1.18 | 0.59, 2.35 | ||||||||||||||
| Fast | Baseline | Baseline | Baseline | Baseline | ||||||||||||||||||
| p for trend = 0.008 | p for trend = 0.05 | p for trend < 0.001 | p for trend = 0.001 | |||||||||||||||||||
| Age (per year increase) | 1.01 | 0.94, 1.09 | 0.72 | 0.99 | 0.92, 1.07 | 0.88 | 1.02 | 0.97, 1.07 | 0.48 | 1.00 | 0.95, 1.05 | 0.95 | ||||||||||
OR, odds ratio; CI, confidence interval; SD, standard deviation.
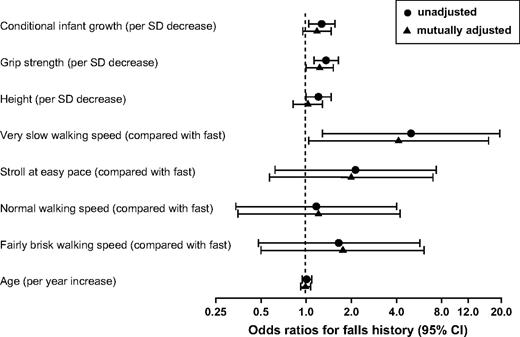
History of falls in men in relation to conditional infant growth, adult grip strength, height, walking speed, and age, Hertfordshire Cohort Study, United Kingdom, 1998–2004. SD, standard deviation; CI, confidence interval.
DISCUSSION
To our knowledge, this study is the first to demonstrate an association between poor growth in early life and falls in older people. We have shown that lower conditional infant growth is significantly associated with a history of falls in older men. There was a similar, but nonsignificant relation for the women. However, we found no relation between birth weight and falls for either men or women. The other significant predictors of falls in this population were gender, height, grip strength, and walking speed. Body mass index was associated with falling only in the women, and neither fat mass nor nonfat mass was related to falls in either gender. Age within the narrow range studied was not significantly associated with history of falls in men or women.
Multivariate analyses enabled further investigation of the relation between conditional infant growth and history of falls in the men. In particular, low social class was a potential alternative explanation for the relation between poor early growth and increased falls. However, social class, ascertained either at birth or in adulthood, was not related to a history of falls; furthermore, social class was not significantly associated with infant growth, although we found a relation with adult walking speed. The association was also not explained by height but was attenuated after adjustment for grip strength and walking speed. The contribution of low grip strength to the relation between poor conditional infant growth and falls is consistent with findings from previous studies demonstrating a relation between poor early growth and reduced adult muscle strength (21, 23, 24). It suggests that early environmental influences may not only result in long-term impaired muscle function but also impact the important clinical sequelae of falls. Supportive evidence for the link with falls comes from a study reporting an association between poor childhood growth and risk of hip fracture in later life (34). Sarcopenia and increased falls risk, as well as reduced bone mass, may lie on the causal pathway.
Associations between early growth and adult health have been explained by the phenomenon of programming, which is the persisting influence of exposures occurring at critical periods of early development on long-term organ structure, function, and regulation (35). Programming is an example of developmental plasticity, which is the ability of a single phenotype to produce more than one alternative form of structure, physiologic state, or behavior in response to environmental conditions (36). This plasticity enables the production of phenotypes better suited to their environment than would be possible if the same phenotype was produced regardless of environmental conditions (37). The consequences of developmental plasticity for human health were the subject of a recent paper by Bateson et al. (38).
Programming of muscle has been documented in animal models, for example, in the field of animal husbandry, where prenatal nutritional manipulation of muscle growth and quality is of particular interest to the meat industry. Prenatal undernutrition has been associated with reduced neonatal muscle weight but not fiber number in the sheep (39) and a reduction in postnatal muscle fiber number in the pig (40), guinea pig (41), and rat (42). There is evidence that these effects persist (43). Evidence suggests that the muscle phenotype can also be influenced by postnatal nutrition (44), and the observations from this study linking history of falls with conditional infant growth rather than birth weight suggest that postnatal rather than prenatal influences on muscle growth and development may be more important for risk of falls in later life.
The relation between conditional infant growth and falls appeared to be stronger for the men than the women, although there was no statistical evidence for different associations between the genders. Health care utilization is known to differ between men and women, but the use of self-reported falls data in this study avoided information bias due to differential recording of falls in medical records. Gender differences in programming have been described previously, associated with differing growth trajectories and susceptibility to environmental influences between male and female fetuses (45). However, differences in adult body composition may also be relevant. Women have a lower muscle-to-fat ratio than men, and the relatively lower proportion of muscle may attenuate associations between growth in early life and adult muscle function in women. The weaker, although still significant relation between grip strength and falls in women supports the concept that gender differences in body composition are relevant in understanding the differing patterns of associations.
There are a number of potential caveats to interpreting our findings. We did not have prospective falls data and had to use history of falls in the last year to characterize fallers. This approach can lead to underreporting because of problems with recall but is unlikely to have affected differentially those with different patterns of early growth, so no observation bias should have been introduced. In contrast, response bias may have occurred because of losses to follow-up that occurred during tracing and in gaining consent to participate. However, we were able to address this problem by characterizing those who did not take part in the study in a number of ways. There were no substantial differences in birth weight, weight at 1 year, or conditional infant growth between subjects who were traced and eligible to participate in the study but did not and those who had a home interview. Furthermore, there were no major differences in age, social class, alcohol intake, or activity level between interviewed subjects who did or did not attend clinic.
The proportion of current smokers was lower among interview subjects who did come to clinic than those who declined, suggesting that there may have been a “healthy subject” effect in this study. However, our comparisons were internal; therefore, unless the relation between early size and history of falls differed between those who did and did not come to clinic, no bias should have been introduced (27). We used muscle strength rather than muscle mass to define sarcopenia. The latter approach has been reported more commonly in the literature, but there is growing support for the use of strength because of its greater functional relevance to physical performance in older people (31).
The potential relevance of these findings to clinical practice needs to be considered. At the population level, poor early growth appears to be a risk factor for falls. Knowledge of early growth and muscle strength may contribute to risk stratification tools for primary prevention of falls in the future. Greater understanding of the mechanisms underlying the association between early growth, sarcopenia, and increased falls risk may also facilitate development of beneficial interventions across the life course to preserve muscle function and prevent falls. Our findings support an association between poor growth in early life and falls in older men. This relation appears to be mediated partly through sarcopenia. The weaker, nonsignificant association for women may reflect gender differences in body composition. The absence of a relation with birth weight suggests that postnatal rather than prenatal influences on muscle growth and development may be important for risk of falls in later life.
Conflict of interest: none declared.
References
Tinetti ME, Speechley M, Ginter SF. Risk factors for falls among elderly persons living in the community.
Stel VS, Smit JH, Pluijm SM, et al. Consequences of falling in older men and women and risk factors for health service use and functional decline.
Scuffham P, Chaplin S, Legood R. Incidence and costs of unintentional falls in older people in the United Kingdom.
Kannus P, Parkkari J, Niemi S, et al. Fall-induced deaths among elderly people.
Guideline for the prevention of falls in older persons. American Geriatrics Society, British Geriatrics Society, and American Academy of Orthopaedic Surgeons Panel on Falls Prevention.
Wickham C, Cooper C, Margetts BM, et al. Muscle strength, activity, housing and the risk of falls in elderly people.
Ory MG, Schechtman KB, Miller JP, et al. Frailty and injuries in later life: the FICSIT trials.
Tinetti ME, Baker DI, McAvay G, et al. A multifactorial intervention to reduce the risk of falling among elderly people living in the community.
Chang JT, Morton SC, Rubenstein LZ, et al. Interventions for the prevention of falls in older adults: systematic review and meta-analysis of randomised clinical trials.
Close J, Ellis M, Hooper R, et al. Prevention of falls in the elderly trial (PROFET): a randomised controlled trial.
Gregg EW, Pereira MA, Caspersen CJ. Physical activity, falls, and fractures among older adults: a review of the epidemiologic evidence.
Kannus P, Khan KM. Prevention of falls and subsequent injuries in elderly people: a long way to go in both research and practice.
Wiswell RA, Hawkins SA, Jaque SV, et al. Relationship between physiological loss, performance decrement, and age in master athletes.
Arden NK, Spector TD. Genetic influences on muscle strength, lean body mass, and bone mineral density: a twin study.
Seibert MJ, Xue QL, Fried LP, et al. Polymorphic variation in the human myostatin (GDF-8) gene and association with strength measures in the Women's Health and Aging Study II cohort.
Roth SM, Schrager MA, Ferrell RE, et al. CNTF genotype is associated with muscular strength and quality in humans across the adult age span.
Geusens P, Vandevyver C, Vanhoof J, et al. Quadriceps and grip strength are related to vitamin D receptor genotype in elderly nonobese women.
Sayer AA, Syddall HE, Gilbody HJ, et al. Does sarcopenia originate in early life? Findings from the Hertfordshire Cohort Study.
Sayer AA, Syddall HE, Dennison EM, et al. Birth weight, weight at one year and body composition in older men: findings from the Hertfordshire Cohort Study.
Kuh D, Bassey J, Hardy R, et al. Birth weight, childhood size, and muscle strength in adult life: evidence from a birth cohort study.
Sayer AA, Cooper C, Evans JR, et al. Are rates of ageing determined in utero?
Gale CR, Martyn CN, Kellingray S, et al. Intrauterine programming of adult body composition.
Phillips DIW. Relation of fetal growth to adult muscle mass and glucose tolerance.
Syddall HE, Sayer AA, Dennison EM, et al. Cohort profile: the Hertfordshire Cohort Study.
Lohman TG, Roche AF, Martorell R, eds. Anthropometric standardization reference manual. Champaign, IL: Human Kinetic Books,
Fidanza F. Anthropometric methodology. In: Fidanza F, ed. Nutritional status assessment. London, United Kingdom: Chapman Hall,
Weiner JS, Lourie JA, eds. International biology: a guide to field methods. Oxford, United Kingdom: Blackwell Scientific Publications,
Lauretani F, Russo CR, Bandinelli S, et al. Age-associated changes in skeletal muscles and their effect on mobility: an operational diagnosis of sarcopenia.
Durnin JV, Womersley J. Body fat assessed from total body density and its estimation from skinfold thickness: measurements on 481 men and women aged from 16 to 72 years.
Cole TJ. Conditional reference charts to assess weight gain in British infants.
Cooper C, Eriksson JG, Forsen T, et al. Maternal height, childhood growth and risk of hip fracture in later life: a longitudinal study.
Lucas A. Programming by early nutrition in man. In: Bock GR, Whelan J, eds. The childhood environment and adult disease. Ciba Foundation Symposium 156. Chichester, United Kingdom: John Wiley & Sons,
Aihie Sayer A, Barker D. The early environment, developmental plasticity and aging.
West-Eberhard MJ. Phenotypic plasticity and the origins of diversity.
Bateson P, Barker D, Clutton-Brock T, et al. Developmental plasticity and human health.
Greenwood PL, Hunt AS, Hermanson JW, et al. Effects of birth weight and postnatal nutrition on neonatal sheep: II. Skeletal muscle growth and development.
Dwyer CM, Stickland NC, Fletcher JM. The influence of maternal nutrition on muscle fiber number development in the porcine fetus and on subsequent postnatal growth.
Dwyer CM, Madgwick AJ, Ward SS, et al. Effect of maternal undernutrition in early gestation on the development of fetal myofibres in the guinea-pig.
Wilson SJ, Ross JJ, Harris AJ. A critical period for formation of secondary myotubes defined by prenatal undernourishment in rats.
Pond WG, Yen JT, Mersmann HJ, et al. Reduced mature size in progeny of swine severely restricted in protein intake during pregnancy.
White P, Cattaneo D, Dauncey MJ. Postnatal regulation of myosin heavy chain isoform expression and metabolic enzyme activity by nutrition.

