


Abstract
Population surveys have observed decreases in cigarette use over time among smokers. These decreases have probably been influenced by tobacco control measures implemented over the past several decades, but few data exist on whether smokers have also reduced their nicotine intake. The authors examined data from two cross-sectional National Health and Nutrition Examination Surveys (NHANES), conducted in 1988–1994 and 1999–2002. Laboratory, examination, and interview data from current smokers not reporting nicotine intake from other sources were examined. From NHANES III (1988–1994) to NHANES 1999–2002, the average number of cigarettes smoked per day (CPD) fell by nearly 15% (three cigarettes), while the mean serum cotinine level fell by 13% (30 ng/ml). Finer breakdowns of CPD data in each time period suggested that most of the change occurred in the lower (<10 CPD) and higher (≥20 CPD) smoking categories. These data suggest that CPD may represent a proxy for exposure to nicotine and perhaps other tobacco smoke constituents on the population level, since the decline in serum cotinine levels observed among smokers closely paralleled the decline in self-reported CPD between 1988–1994 and 1999–2002. In addition, these data are inconsistent with the hypothesis that the remaining population of smokers is becoming more dependent on nicotine over time.
Smokers smoke cigarettes because they are addicted to nicotine (1, 2). Commercial cigarettes deliver sufficient nicotine to the smoker to maintain addiction (3), with approximately 80–90 percent of the available nicotine in smoke being absorbed (1). Many cigarettes are designed to be elastic, allowing smokers to regulate the dose of nicotine they receive (4–7). Elastic cigarettes are those that facilitate compensatory smoking, or the ability to achieve higher exposures to tar and nicotine than would be predicted in a standard smoking-machine test. There is substantial evidence that smokers alter how they smoke to regulate their nicotine intake, such that smokers who reduce the amount smoked daily and/or switch to a lower-machine-yield brand of cigarettes do not substantially change their actual exposure to nicotine (8–14) or carcinogens (15, 16). Harris (17) has suggested that even if compensation is incomplete for smokers who might be persuaded to switch from to a regular filtered cigarette brand to a so-called light cigarette brand, it is unlikely that the reduction in smoke toxins would be sufficient to yield any substantial reduction in disease risk.
As progress has been made in tobacco control, a number of studies have demonstrated a reduction in the number of cigarettes smoked per day among smokers (18–22). Analysis of National Health Interview Survey data from 1965 to 1998 showed that the average number of cigarettes smoked per day has dropped from its peak of 21.5 in 1980 to 17.5 in 1998 (19). Similarly, among smokers in the Cancer Prevention Survey I cohort, the mean number of cigarettes per day (CPD) peaked at 21.5 in 1981 and had fallen to just over 17.0 by 1998 (20). Data from the COMMIT cohort (18) showed that between 1988 and 1993, the percentage of smokers smoking 25 or more CPD dropped by five percentage points (from 30 percent to 25 percent), while the percentage who reported smoking 5–14 CPD rose by 4 percentage points (from 24 percent to 28 percent). Similar findings have been noted in survey data from California (20) and Massachusetts (21). There has also been a concomitant shift in the United States toward increased nondaily and low-rate daily smoking (23–27). Many factors have contributed to the steady decline in cigarette use in the United States since the mid-1960s, including a better informed public, rising cigarette prices (due to tax increases), large-scale adoption of smoke-free policies, and improved access to smoking cessation treatments (28, 29).
Given what is known about smoker compensation for reduced machine yield, a presumption is made that reductions in CPD will not result in decreasing nicotine intake, since smokers will simply increase their nicotine intake per cigarette, titrating their exposure to maintain a daily dose (30). However, because population-based longitudinal or repeated cross-sectional data that include measures of nicotine intake are rare, this presumption has yet to be tested. Cotinine, nicotine's major metabolite, is typically used to assess nicotine intake because of its relatively longer half-life (averaging 20 hours as opposed to 2 hours for nicotine) (31–33). Data from the National Health and Nutrition Examination Survey (NHANES) (34–36) can address whether contemporary smokers in a representative US population sample are smoking fewer cigarettes than smokers of years past and, if so, whether they are also taking in less nicotine. Other investigators have reported on serum cotinine levels among both smokers and nonsmokers using NHANES data (37–39), but to our knowledge, none have examined trends over time.
In the current analysis, we had two objectives: 1) to examine changes in average serum cotinine level and CPD among smokers at two different time points using the NHANES samples from 1988–1994 and 1999–2002 and 2) to compare whether the change in serum cotinine level observed over time paralleled that seen for CPD. On the basis of other findings reported in the literature (18–22), we would expect to see a decline in self-reported CPD when comparing NHANES samples from 1988–1994 and 1999–2002. However, it is less clear whether serum cotinine levels would change to a similar degree. If changes in serum cotinine levels closely paralleled changes in CPD, this would provide evidence that CPD is a reasonably accurate proxy measure for population-level changes in exposure to nicotine and other tobacco smoke constitutes. On the other hand, if serum cotinine levels remained stable while CPD declined, this would provide evidence in support of the hypothesis that the remaining population of smokers ingests more nicotine per cigarette and may be more nicotine-dependent.
MATERIALS AND METHODS
NHANES data collection
Details on the methods used in the NHANES surveys are available from the National Center for Health Statistics (http://www.cdc.gov/nchs/nhanes.htm). Participants complete a household interview, followed several days later by an interview conducted at a mobile examination center (MEC) and collection of a blood sample. In the Third NHANES (NHANES III; 1988–1994) 17,705 persons aged 17 years or more completed the MEC interview and provided a blood sample; in NHANES 1999–2002, 12,060 persons aged 17 years or more were interviewed in the MEC and provided blood (33–35). We limited our analyses to participants aged 25 years or more to avoid those who were in the uptake phase of smoking initiation. We classified smokers by gender, age (25–39, 40–54, or ≥55 years), race/ethnicity (non-Hispanic White, non-Hispanic Black, Mexican-American, or “other”), body mass index (weight (kg)/height (m)2; underweight (<18.5), normal weight (18.5–24.9), overweight (25.0–29.9), or obese (≥30.0)) (40), education (less than high school, high school graduate, or more than high school), and number of smokers in the household (0, 1, or ≥2). Number of smokers in the household was used as a proxy for secondhand smoke exposure.
Tobacco-use measures
Because the half-life of cotinine averages 20 hours (31), we used smoking-related information from the NHANES MEC interview, as opposed to the household interview, in our analyses. One exception was CPD, where we also examined the household interview responses to determine whether systematic bias existed in interview responses versus MEC responses. For NHANES III, MEC participants were asked how many cigarettes they had smoked in total over the past 5 days, which necessitated the calculation of CPD. For NHANES 1999–2002, participants were asked whether they had smoked any cigarettes over the past 5 days (including the day of the MEC interview) and, if so, 1) on how many days they had smoked, 2) how many cigarettes they had smoked on each day, and 3) on which day they had smoked their last cigarette (today, yesterday, or 3–5 days ago). For both surveys, CPD values less than 1 were coded as 1 and values greater than 95 were coded as 95. In the household interview component, participants were asked to report “about” (NHANES III) or “on average” (NHANES 1999–2002) how many cigarettes they had smoked per day.
In both surveys, participants were asked separate questions to assess use of pipes or cigars, smokeless tobacco products, and nicotine replacement products in the past 5 days. Regarding nicotine replacement products, the NHANES III questionnaire asked only about use of nicotine gum in the past 5 days, while the NHANES 1999–2002 questionnaire asked about use of gum, patches, inhalers, nasal sprays, or any other sources of nicotine.
Cotinine analysis
Blood samples obtained during the MEC portion of NHANES were examined for serum cotinine using high performance liquid chromatography/atmospheric-pressure ionization tandem mass spectrometry (32). This method has been continuously maintained in a single laboratory at the Centers for Disease Control and Prevention, which has analyzed serum cotinine levels in NHANES samples since 1988. Blind and bench serum pools are routinely included with analytic runs as a quality assurance method, and additional pools spiked with known amounts of cotinine perchlorate are analyzed periodically to confirm the accuracy and precision of the method. Because of interest in monitoring population trends, efforts have been made to assure stability over time. Three quality-control pools at cotinine levels of 0.268 ng/ml, 1.86 ng/ml, and 207 ng/ml have been measured periodically from 1990 through 2004 and have shown no systematic drift in the measurement of cotinine over time.
Subsample selection
As expected, the prevalence of cigarette smoking in the past 5 days had dropped significantly from NHANES III (30.6 percent; 95 percent confidence interval (CI): 29.9, 32.4) to NHANES 1999–2002 (22.7 percent; 95 percent CI: 21.1, 24.4). To remove the influence of other sources of nicotine on serum cotinine levels, we examined the tobacco and nicotine use patterns of persons aged 25 years or more who reported using any nicotine-containing product in the past 5 days (see table 1). Over 80 percent of nicotine users in both samples reported cigarettes as their only source of nicotine, though the proportion of exclusive cigarette use was slightly lower in the 1999–2002 sample. Approximately 3 percent of cigarette smokers in both surveys reported concurrent use of cigarettes and other tobacco products or nicotine replacement products. We limited our subsequent analyses to participants aged 25 years or more who used cigarettes exclusively.
Distribution of nicotine sources among participants aged 25 years or more who had used tobacco and/or nicotine-containing products in the past 5 days, National Health and Nutrition Examination Survey, 1988–1994 and 1999–2002
NHANES* III (1988–1994) | NHANES 1999–2002 | |||||||||
|---|---|---|---|---|---|---|---|---|---|---|
| No.† | % | 95% CI* | No.† | % | 95% CI | |||||
| Cigarettes only | 3,750 | 87.5 | 85.6, 89.1 | 1,674 | 83.3 | 81.1, 85.3 | ||||
| Cigarettes and other nicotine sources | ||||||||||
| Plus other tobacco products‡ | 102 | 2.3 | 1.7, 3.0 | 27 | 1.8 | 1.2, 2.8 | ||||
| Plus nicotine replacement§ | 22 | 0.4 | 0.2, 0.8 | 9 | 0.8 | 0.4, 1.7 | ||||
| Cigarettes plus all | 3 | 0.01 | 0.00, 0.04 | 0 | ||||||
| Other nicotine sources only | ||||||||||
| Other tobacco products only | 428 | 9.4 | 8.0, 11.1 | 237 | 13.4 | 11.3, 15.8 | ||||
| Nicotine replacement only | 17 | 0.4 | 0.2, 0.9 | 9 | 0.6 | 0.2, 1.7 | ||||
| Both | 6 | 0.03 | 0.01, 0.09 | 0 | ||||||
NHANES, National Health and Nutrition Examination Survey; CI, confidence interval.
Numbers are actual numbers of participants. Percentages are weighted to the US national population.
“Other tobacco products” includes use of pipes, cigars, chewing tobacco, or snuff.
For NHANES III, “nicotine replacement” refers only to nicotine gum, while in NHANES 1999–2002, it refers to gum, patches, inhalers, or nasal sprays.
Data analysis
Data were analyzed using SUDAAN 9.0.1 (Research Triangle Institute, Cary, North Carolina), running under SAS 9.1 (SAS Institute, Inc., Cary, North Carolina), to account for the complex sampling design (41, 42). Comparisons were made by examining the overlap of 95 percent confidence intervals around percentages and by t tests of mean values using standard errors derived from SUDAAN. Analysis of variance was used to assess the relation between serum cotinine level and CPD (categorized as 1–5, 6–9, 10, 11–14, 15–19, 20, 21–29, and ≥30), adjusting for person-level factors (age, sex, race, education, body mass index, and number of smokers in the household). Logarithmically transformed serum cotinine values were examined in the analysis-of-variance model to normalize the distribution and ease interpretation. All p values presented are from two-tailed tests.
RESULTS
Demographic factors
Table 2 shows the demographic characteristics of current exclusive cigarette smokers in 1988–1994 and 1999–2002. No differences were seen for sex or race categories across the two surveys. There were proportionately more participants with more than a high school education in the 1999–2002 survey. The more recent sample also contained fewer persons aged 25–39 years and more persons aged 40–54 years. As has been described elsewhere (43), the proportion of Americans who were overweight or obese increased significantly between the two periods. On the whole, the two samples were demographically comparable.
Demographic distribution of subjects aged 25 years or more who had smoked in the past 5 days and had not used other nicotine-containing products in the past 5 days, National Health and Nutrition Examination Survey, 1988–1994 and 1999–2002
NHANES* III (1988–1994) | NHANES 1999–2002 | |||||||||
|---|---|---|---|---|---|---|---|---|---|---|
| No.† | % | 95% CI* | No.† | % | 95% CI | |||||
| Gender | ||||||||||
| Male | 2,017 | 52.6 | 50.6, 54.2 | 955 | 53.3 | 50.7, 55.9 | ||||
| Female | 1,733 | 47.4 | 45.8, 49.1 | 719 | 46.7 | 44.1, 49.4 | ||||
| Race/ethnicity‡ | ||||||||||
| Non-Hispanic White | 1,396 | 75.9 | 72.7, 78.9 | 779 | 69.8 | 65.1, 74.2 | ||||
| Non-Hispanic Black | 1,353 | 13.2 | 11.5, 15.2 | 412 | 12.9 | 10.1, 16.4 | ||||
| Mexican-American | 870 | 4.0 | 3.4, 4.7 | 345 | 6.1 | 4.4, 8.5 | ||||
| Highest level of education | ||||||||||
| Less than high school | 1,603 | 30.7 | 27.7, 34.0 | 690 | 30.9 | 27.9, 34.0 | ||||
| High school graduate | 1,289 | 39.7 | 37.1, 42.5 | 434 | 31.1 | 27.8, 34.5 | ||||
| More than high school | 827 | 29.5 | 26.8, 32.4 | 547 | 38.1 | 34.1, 42.3 | ||||
| Age group (years) | ||||||||||
| 25–39 | 1,671 | 49.8 | 47.2, 52.5 | 597 | 42.3 | 39.4, 45.3 | ||||
| 40–54 | 1,049 | 29.9 | 27.3, 32.6 | 605 | 38.0 | 35.1, 41.0 | ||||
| ≥55 | 1,030 | 20.3 | 18.3, 22.4 | 472 | 19.6 | 17.0, 22.6 | ||||
| Body mass index§ | ||||||||||
| <18.5 (underweight) | 117 | 3.1 | 2.3, 4.2 | 43 | 2.5 | 1.7, 3.5 | ||||
| 18.5–24.9 (normal) | 1,596 | 46.4 | 43.7, 49.1 | 588 | 37.7 | 34.7, 40.8 | ||||
| 25.0–29.9 (overweight) | 1,251 | 31.8 | 29.6, 34.1 | 546 | 33.7 | 30.6, 37.0 | ||||
| ≥30.0 (obese) | 786 | 18.7 | 17.0, 20.6 | 436 | 26.1 | 23.2, 29.3 | ||||
| No. of cigarettes smoked per day in the past 5 days | ||||||||||
| 0–14 | 2,126 | 41.7 | 38.7, 44.7 | 956 | 47.8 | 44.6, 51.0 | ||||
| 15–24 | 1,135 | 36.7 | 34.5, 39.1 | 523 | 36.6 | 33.3, 40.0 | ||||
| ≥25 | 489 | 21.6 | 18.8, 24.7 | 195 | 15.6 | 12.9, 18.8 | ||||
| No. of smokers in the household | ||||||||||
| 0 | 547 | 13.7 | 11.7, 16.1 | 553 | 32.2 | 28.9, 35.7 | ||||
| 1 | 1,797 | 43.5 | 40.5, 46.6 | 588 | 33.0 | 29.9, 36.4 | ||||
| ≥2 | 1,401 | 42.8 | 39.9, 45.6 | 510 | 34.8 | 30.7, 39.0 | ||||
NHANES, National Health and Nutrition Examination Survey; CI, confidence interval.
Numbers are actual numbers of participants. Percentages are weighted to the US national population.
The NHANES data analysis manual suggests omitting persons in the “other race/ethnicity” category because of small numbers and imprecise estimates; thus, percentages do not sum to 100.
Weight (kg)/height (m)2.
Changes in mean cotinine level and CPD
Figure 1 shows significant drops in both mean serum cotinine level and CPD among exclusive cigarette smokers in NHANES. Between the 1988–1994 survey and the 1999–2002 survey, mean serum cotinine dropped by 30.3 ng/ml, or 13.2 percent, a significant decrease (p < 0.0001). During the same period, average CPD in the past 5 days dropped by 2.8 cigarettes, or 15.1 percent (p < 0.0002). Similarly, reported CPD from the household interview dropped by 12.6 percent (20.5 CPD vs. 17.9 CPD; p < 0.0004). Table 2 shows that the percentage of respondents smoking 25 or more CPD dropped over time as well, with a corresponding increase in the percentage smoking 1–14 CPD, which is similar to the findings of Hyland and Cummings (18).
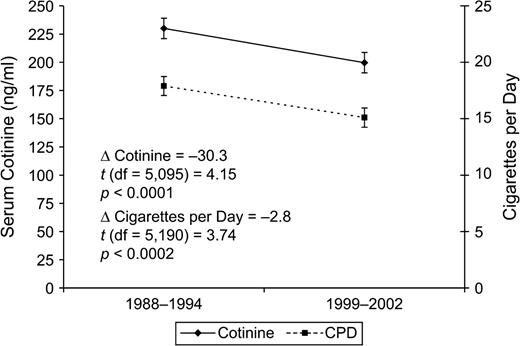
Changes in mean serum cotinine level and number of cigarettes smoked per day (CPD) in the past 5 days among participants aged 25 years or more who had smoked in the past 5 days and had not used other nicotine-containing products in the past 5 days, National Health and Nutrition Examination Survey, 1988–1994 and 1999–2002. Bars, 95% confidence interval.
Mean cotinine levels and CPD values (for both the household interview and the MEC interview) were also broken out by the various demographic categories to determine whether any subgroup of smokers showed alternative patterns of change. Results of the subgroup analyses (table 3) were consistent—no group showed a significant rise in either cotinine or CPD, and the rates of decline were substantially similar. This was true even among the heaviest smokers (≥25 CPD), whose average serum cotinine level dropped 11.0 percent while their average cigarette use dropped by 9.3 percent. One notes that the household interview values for CPD are uniformly higher than the MEC interview values for reported CPD in the past 5 days. However, the patterns of change are approximately parallel for the two measures. In NHANES III, interview and MEC CPD reports correlated at r = 0.81, while in NHANES 1999–2002, the measures correlated at r = 0.82 (Spearman rank correlations).
Mean serum cotinine level, number of cigarettes smoked per day, and cotinine level per cigarette smoked among participants aged 25 years or more who had smoked in the past 5 days and had not used other nicotine-containing products in the past 5 days, National Health and Nutrition Examination Survey, 1988–1994 and 1999–2002
Serum cotinine level (ng/ml) | CPD* (household interview) | CPD (MEC* interview) (past 5 days) | Cotinine level/CPD (past 5 days) | |||||||||||||||||||||||||
|---|---|---|---|---|---|---|---|---|---|---|---|---|---|---|---|---|---|---|---|---|---|---|---|---|---|---|---|---|
| NHANES* III (1988–1994) | NHANES 1999–2002 | NHANES III (1988–1994) | NHANES 1999–2002 | NHANES III (1988–1994) | NHANES 1999–2002 | NHANES III (1988–1994) | NHANES 1999–2002 | |||||||||||||||||||||
| Mean | 95% CI* | Mean | 95% CI | Mean | 95% CI | Mean | 95% CI | Mean | 95% CI | Mean | 95% CI | Mean | 95% CI | Mean | 95% CI | |||||||||||||
| Total | 230.0 | 221.0, 239.0 | 199.7 | 190.6, 208.7 | 20.5 | 19.6, 21.3 | 17.9 | 16.9, 18.8 | 17.9 | 16.9, 18.8 | 15.1 | 14.3, 15.9 | 19.2 | 17.8, 20.5 | 18.1 | 16.8, 19.4 | ||||||||||||
| Gender | ||||||||||||||||||||||||||||
| Male | 237.0 | 225.2, 248.7 | 210.2 | 198.3, 222.1 | 21.6 | 20.5, 22.8 | 19.2 | 18.0, 20.5 | 19.1 | 17.9, 20.3 | 16.1 | 15.0, 17.3 | 17.8 | 16.5, 19.1 | 17.4 | 15.7, 19.1 | ||||||||||||
| Female | 222.0 | 209.5, 234.6 | 187.5 | 177.3, 197.8 | 19.2 | 18.2, 20.2 | 16.4 | 15.3, 17.5 | 16.5 | 15.4, 17.6 | 13.9 | 13.0, 14.8 | 20.7 | 18.3, 23.0 | 18.9 | 17.1, 20.6 | ||||||||||||
| Race/ethnicity | ||||||||||||||||||||||||||||
| Non-Hispanic White | 235.3 | 225.3, 245.2 | 208.4 | 197.9, 219.0 | 22.6 | 21.6, 23.6 | 19.9 | 18.9, 21.0 | 20.1 | 19.1, 21.2 | 17.4 | 16.4, 19.4 | 15.8 | 14.3, 17.3 | 15.3 | 14.3, 16.4 | ||||||||||||
| Non-Hispanic Black | 265.7 | 254.7, 276.6 | 252.7 | 236.5, 268.8 | 14.3 | 13.7, 14.9 | 13.1 | 11.7, 14.5 | 11.4 | 10.9, 11.9 | 11.1 | 10.3, 11.9 | 38.5 | 34.8, 42.2 | 32.5 | 29.2, 35.9 | ||||||||||||
| Mexican-American | 117.1 | 103.5, 130.6 | 108.1 | 93.6, 122.7 | 9.5 | 8.3, 10.7 | 9.9 | 8.6, 11.1 | 7.5 | 6.5, 8.4 | 7.2 | 6.4, 7.9 | 19.6 | 17.8, 21.3 | 16.9 | 14.6, 19.2 | ||||||||||||
| Highest level of education | ||||||||||||||||||||||||||||
| Less than high school | 238.1 | 222.3, 253.9 | 212.3 | 197.4, 227.2 | 21.1 | 19.7, 22.5 | 18.9 | 17.0, 20.7 | 18.0 | 16.5, 19.5 | 15.5 | 14.1, 16.9 | 22.9 | 19.9, 25.9 | 18.4 | 16.3, 20.4 | ||||||||||||
| High school graduate | 243.1 | 231.7, 254.6 | 212.2 | 198.2, 226.2 | 21.2 | 20.0, 22.5 | 18.6 | 16.8, 20.4 | 19.2 | 17.9, 20.4 | 16.0 | 14.6, 17.4 | 17.5 | 16.0, 19.0 | 18.6 | 16.1, 21.0 | ||||||||||||
| More than high school | 204.9 | 190.6, 219.2 | 180.3 | 166.3, 194.4 | 18.6 | 17.3, 19.9 | 16.4 | 15.3, 17.5 | 16.1 | 15.1, 17.1 | 14.0 | 13.0, 15.1 | 17.5 | 15.7, 19.3 | 17.5 | 15.1, 19.9 | ||||||||||||
| Age group (years) | ||||||||||||||||||||||||||||
| 25–39 | 219.2 | 208.1, 230.3 | 186.8 | 174.0, 199.6 | 18.7 | 17.6, 19.9 | 15.7 | 14.6, 16.8 | 16.7 | 15.4, 18.0 | 13.6 | 12.6, 14.6 | 18.6 | 16.8, 20.5 | 18.7 | 16.5, 20.9 | ||||||||||||
| 30–54 | 248.5 | 233.7, 263.3 | 211.1 | 194.9, 227.2 | 22.9 | 21.3, 24.5 | 19.3 | 17.9, 20.6 | 19.6 | 18.2, 21.0 | 15.9 | 14.7, 17.1 | 17.5 | 16.3, 18.8 | 17.3 | 16.1, 18.6 | ||||||||||||
| ≥55 | 228.9 | 220.4, 237.3 | 205.9 | 192.8, 219.0 | 21.1 | 20.2, 22.0 | 19.7 | 18.0, 21.5 | 18.2 | 17.1, 19.3 | 16.8 | 15.3, 18.3 | 22.9 | 20.3, 25.5 | 18.0 | 15.7, 20.4 | ||||||||||||
| Body mass index† | ||||||||||||||||||||||||||||
| <18.5 (underweight) | 253.8 | 219.1, 288.6 | 234.5 | 212.4, 266.5 | 21.2 | 18.4, 24.0 | 17.5 | 11.2, 23.7 | 18.3 | 15.7, 20.8 | 15.9 | 12.4, 19.4 | 23.3 | 17.1, 29.4 | 22.6 | 16.2, 29.0 | ||||||||||||
| 18.5–24.9 (normal) | 241.2 | 228.3, 254.1 | 219.9 | 204.7, 235.1 | 19.6 | 18.5, 20.8 | 18.6 | 17.4, 19.8 | 17.4 | 16.2, 18.5 | 15.5 | 14.6, 16.4 | 19.9 | 18.3, 21.5 | 19.7 | 17.4, 22.0 | ||||||||||||
| 25.0–29.9 (overweight) | 228.9 | 216.6, 241.2 | 196.1 | 178.4, 213.8 | 21.1 | 19.9, 22.3 | 17.3 | 15.9, 18.7 | 17.9 | 15.6, 19.2 | 14.7 | 13.3, 16.2 | 18.8 | 16.2, 21.4 | 16.6 | 14.7, 18.4 | ||||||||||||
| ≥30.0 (obese) | 200.8 | 185.6, 216.1 | 175.7 | 158.9, 192.5 | 21.3 | 19.3, 23.3 | 17.9 | 16.3, 19.4 | 19.0 | 17.2, 20.8 | 15.2 | 14.0, 16.3 | 17.4 | 14.8, 20.0 | 17.0 | 14.4, 19.6 | ||||||||||||
| No. of cigarettes smoked per day | ||||||||||||||||||||||||||||
| 0–14 | 151.3 | 141.4, 161.3 | 144.0 | 132.7, 155.2 | 10.8 | 9.9, 11.6 | 9.5 | 8.8, 10.2 | 6.3 | 6.1, 6.6 | 6.3 | 5.9, 6.6 | 29.3 | 26.5, 32.0 | 25.0 | 22.6, 27.4 | ||||||||||||
| 15–24 | 276.6 | 263.2, 290.0 | 243.8 | 232.5, 255.2 | 20.8 | 20.2, 21.3 | 18.9 | 18.4, 19.5 | 19.5 | 19.3, 19.7 | 18.6 | 18.4, 18.8 | 14.2 | 13.5, 14.9 | 13.3 | 12.6, 14.0 | ||||||||||||
| ≥25 | 299.6 | 289.8, 309.4 | 266.6 | 247.6, 285.6 | 35.4 | 34.3, 36.6 | 32.1 | 30.4, 33.8 | 37.3 | 36.4, 38.2 | 34.0 | 32.8, 35.2 | 8.4 | 8.1, 8.7 | 8.2 | 7.5, 8.8 | ||||||||||||
| No. of smokers in the household | ||||||||||||||||||||||||||||
| 0 | 123.8 | 102.5, 145.1 | 141.9 | 127.7, 156.2 | 11.7 | 8.8, 14.6 | 14.0 | 12.6, 15.4 | 8.4 | 6.8, 10.0 | 9.8 | 8.8, 10.9 | 24.7 | 18.3, 31.1 | 19.4 | 16.0, 22.7 | ||||||||||||
| 1 | 236.6 | 225.1, 248.1 | 221.0 | 209.8, 232.3 | 20.2 | 19.0, 21.3 | 18.3 | 16.9, 19.7 | 17.9 | 16.9, 19.0 | 16.8 | 15.7, 17.9 | 19.2 | 17.7, 20.7 | 17.8 | 16.2, 19.3 | ||||||||||||
| ≥2 | 257.6 | 245.9, 269.5 | 233.7 | 217.6, 249.7 | 22.5 | 21.3, 23.8 | 19.8 | 18.4, 21.3 | 20.9 | 19.7, 22.1 | 18.4 | 16.9, 20.0 | 17.0 | 15.8, 18.2 | 17.3 | 15.1, 19.4 | ||||||||||||
CPD, cigarettes per day; MEC, mobile examination center; NHANES, National Health and Nutrition Examination Survey; CI, confidence interval.
Weight (kg)/height (m)2.
Cotinine level per cigarette smoked was determined by dividing each participant's cotinine value by reported CPD over the past 5 days. The overall change was marginal, and the subgroup analyses showed similar results; that is, no subgroup showed cotinine level per cigarette smoked to be increasing over time. If one applies the Benowitz and Jacob (32) conversion factor (K = 0.08) to the cotinine level, one finds that the daily dose of nicotine dropped from 18.4 mg in NHANES III to 16.0 mg in NHANES 1999–2002. When CPD are taken into account, this reflects a slight increase of 0.04 mg of nicotine per cigarette.
We also conducted analyses in an “age-cohort” fashion—for example, comparing persons who were aged 30–40 years in NHANES III with those who were aged 40–50 years in NHANES 1999–2002. We saw similar drops in CPD and cotinine level (data not shown).
Analysis of variance
To assess the relation between change in CPD and change in cotinine, we constructed analysis-of-variance models predicting cotinine level with a multicategory CPD variable. One analysis was carried out for the NHANES III data and a second one was carried out for the NHANES 1999–2002 data; the results are plotted in figure 2. One notes two effects. First, above approximately 20 CPD, cotinine levels flatten out, which is consistent with previous findings (38). Second, one notices that the drops in cotinine between the two surveys are seen in two groups of smokers: those smoking fewer than 10 CPD and those smoking 20 or more CPD. Among those smoking 1–9 CPD, serum cotinine fell from a mean of 123.6 ng/ml (95 percent CI: 112.1, 135.1) to 104.6 ng/ml (95 percent CI: 95.0, 114.2), which falls just short of statistical significance but represents a 15-ng/ml decline. Among those smoking 20 or more CPD, serum cotinine dropped from a mean of 292.0 ng/ml (95 percent CI: 283.0, 300.9) to 252.2 ng/ml (95 percent CI: 240.1, 264.5), a significant 14 percent drop. Those reporting smoking 10–19 CPD showed no significant drop in cotinine levels between the two surveys (220.7 ng/ml vs. 227.5 ng/ml).
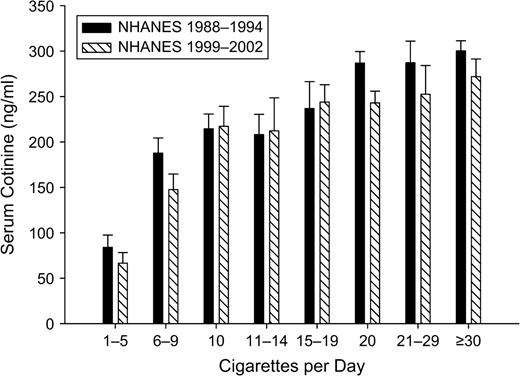
Mean serum cotinine level according to number of cigarettes smoked per day (in categories) among participants aged 25 years or more who had smoked in the past 5 days and had not used other nicotine-containing products in the past 5 days, National Health and Nutrition Examination Survey (NHANES), 1988–1994 and 1999–2002. Bars, 95% confidence interval.
We constructed a second model adjusting for sociodemographic factors associated with CPD and/or cotinine level (age, sex, race/ethnicity, education, body mass index, and number of smokers in the household) to determine whether adjusting for these factors changed the relation between CPD and cotinine. After adjustment for these covariates, mean values and the pattern of results did not change significantly, suggesting that the relation between cotinine and CPD is stable when other factors are accounted for (data not shown). That is, shifts in demographic factors, such as an increase in the percentage of respondents with a high school education, do not explain away the observed effect.
DISCUSSION
Several earlier studies have documented a drop in CPD among smokers in the recent past (18–22); however, this is the first study we are aware of to examine whether population-level changes in cigarette use are correlated with population-level changes in nicotine intake. As anticipated, we found that smokers in the more recent NHANES survey (1999–2002) reported smoking nearly three fewer CPD, representing a 15 percent drop in average cigarette use. Consistent with the reported decline in CPD observed between the two samples, we found that smokers' average cotinine levels decreased by an average of 30 ng/ml or 13 percent. These changes cannot be accounted for by population shifts toward substantially lower-nicotine-yield cigarettes, since the market share of ultralight cigarettes (cigarettes with <6 mg of tar (as measured by the Federal Trade Commission method), on which complete compensation for nicotine is more difficult (9–13)) increased by only 1.2 percentage points during the period 1988–2002: from 12.1 percent averaged over 1988–1994 to 13.3 percent averaged over 1999–2002 (44). Market share for cigarettes yielding 15 mg of tar or less increased from 62.4 percent to 85.1 percent during the same period (44). These data suggest that CPD may be an adequate proxy for population-level changes in exposure to nicotine, since the decline in serum cotinine levels closely paralleled the decline in self-reported CPD, even though the relation between cotinine and CPD has been observed to be nonlinear (38). These data also complement recent reports suggesting significant correlations between self-reported CPD and cotinine levels (45–47).
While some might see such a finding as contradicting the body of literature on smoker compensation, it is worth noting that nicotine regulation need not be precisely controlled (48). Under a “boundary” model of nicotine regulation, smokers regulate their intake not to achieve a particular set point but to avoid aversive states of “too much” or “too little” nicotine (48). Under such a model, smokers have some degree of latitude to regulate their daily intake of nicotine. Given that most investigators reporting on compensation report incomplete compensation (8–14) on a per-cigarette basis, it is not surprising that smokers are not perfectly calibrating their nicotine intakes to account for reduced CPD. It is possible that with larger decreases in CPD, compensation might become apparent. Obviously, we could not directly test hypotheses about individual-level smoker compensation in this analysis, since the results were based on a comparison of two independent cross-sectional samples of smokers, not a cohort of smokers tracked over time.
The “hard-core smoker” hypothesis states that as societal tobacco control continues, a group of smokers that is increasingly unwilling or unable to quit will remain (49, 50). The data from this study failed to provide any evidence to support this hypothesis, since serum cotinine levels declined in approximately the same proportion as reported CPD. Some have argued that the smoker population could be “hardening” even if a drop in CPD were seen, since smoking restrictions and price influences could cause a drop in total CPD but smokers could compensate on a per-cigarette basis (28, 30). The results from this study refute this hypothesis; both CPD and cotinine levels dropped, suggesting little compensation for the reduction in total cigarettes smoked, at least on a population level. The relation between cotinine and CPD has remained stable over time, suggesting no significant per-cigarette compensation for reduced consumption. Finally, the overall variance in CPD and cotinine level did not increase between the two surveys, which ought to have occurred if some smokers were compensating for the reduced number of CPD while others were not.
Nondaily smoking has been of interest in recent years (23–27). It is unknown how much nondaily smoking increased in this population between the two survey waves, but the more it did, the greater the potential for explaining the changes in cotinine and CPD. The results from the 1999–2002 data indicated that a substantial proportion of smokers had not smoked on all of the previous 5 days, which is consistent with other national survey findings (25–27). Note that 26 percent of self-reported “everyday” smokers, as determined by the household interview item “Do you smoke every day, some days, or not at all?,” reported that their last cigarette had been smoked on the day before the MEC interview; this indicates that they may have abstained from smoking on the day of their examination, inflating the estimate of nondaily smoking. It might be thought that the decreased smoking and nicotine intake we observed could be due primarily to the increase in nondaily smoking. However, we observed decreased smoking and nicotine intake even among persons who smoked 25 or more CPD, who are least likely to be nondaily smokers—in NHANES 1999–2002, 82.6 percent of these heavy smokers indicated that they had smoked on each of the preceding 5 days. Thus, the increase in nondaily smoking accounts for only part of the decrease in smoking and nicotine intake: Smoking and nicotine intake are decreasing even among daily smokers.
Another way in which dependent smokers might be hypothesized to compensate for reductions in smoking would be to adopt the use of other products that deliver nicotine. However, as table 1 shows, there has been no substantial increase in the use by smokers of other tobacco products or nicotine replacement products, even though the latter have become much more available as a result of being licensed for sale without prescription since 1996 (51).
While the continuing decline in CPD over the past several decades is a positive trend and an indicator of efforts by smokers to quit, it is unlikely that cutting back a few CPD will translate into any positive health benefit (52–54). Hecht et al. (55) have reported that reduced cigarette use (50–75 percent in a clinical trial) is related to a concomitant but comparatively small decrease in urinary levels of tobacco-specific nitrosamine metabolites (30–40 percent). These findings are similar to those reported earlier by Benowitz et al. (56)—an 86 percent reduction in consumption (from 37 CPD to 5 CPD) led to a decrease of only about 50 percent in carbon monoxide and tar exposure. Smoking reductions of 50 percent or more may be predictive of later cessation (57–59). The cigarette use changes reported here were on the order of 10–15 percent, much smaller than those in these other studies.
An interesting methodological observation in these data is the consistent difference in self-reported CPD by the same persons in the household interview and the MEC interview. On average, smokers reported smoking two more CPD in the household interview than in the MEC interview, and this held up over time and across various demographic categories (see table 3). This consistency suggests that the observed change in self-reported consumption is real and not a function of measurement differences between survey waves. However, from a measurement standpoint, a systematic difference in reported consumption between “on average” and “over the past 5 days” has implications for survey research on tobacco use. We cannot evaluate which measure is a more accurate reflection of actual consumption in these data, since both correlate significantly with each other and with serum cotinine, and both change similarly over time.
A limitation of the NHANES data is the lack of specific questions about intentions or desires to quit smoking, so we could not assess these possible contributors to the changes in smoking behavior. We compared data from two surveys conducted nearly a decade apart in different samples, with some questions (e.g., use of nicotine replacement products) changing over time. However, given that each sample was a nationally representative sample, the conclusions should be applicable to the US national population. Importantly, the NHANES data cannot directly address the issue of nicotine dependence. Nicotine intake is only modestly correlated with nicotine dependence (60), which is a complex pattern of behavior marked by drug-seeking, loss of control over drug-taking, craving, and withdrawal (61).
In conclusion, data from two recent NHANES surveys suggest that contemporary smokers are smoking fewer CPD and taking in less nicotine, as reflected in lower cotinine levels. The relation between cotinine and CPD appears to be stable across the two surveys, particularly when potential confounders such as race and body mass index are accounted for. The ratio of cotinine level to cigarettes smoked also appears to be declining proportionally over time, suggesting that CPD might be a useful proxy measure for estimating population-level changes in exposure to nicotine and other tobacco smoke constituents. In addition, these data are inconsistent with the hypothesis that the remaining population of smokers is becoming more dependent on nicotine over time.
Dr. Gary Giovino was supported by a Robert Wood Johnson Foundation Innovators Combating Substance Abuse grant. Dr. Lynn Kozlowski received funding from the National Cancer Institute and the Robert Wood Johnson Foundation.
These data were presented in part at the 2005 National Conference on Tobacco or Health (Chicago, Illinois, May 4–6, 2005) and at the 30th Annual Meeting of the American Society of Preventive Oncology (Bethesda, Maryland, February 26–28, 2006).
The findings and conclusions in this report are those of the authors and do not necessarily represent the views of the Centers for Disease Control and Prevention. Use of trade names and commercial sources is for identification only and does not constitute endorsement by the US Department of Health and Human Services or the Centers for Disease Control and Prevention.
Dr. Saul Shiffman is Senior Scientific Advisor for Pinney Associates (Pittsburgh, Pennsylvania), which provides consulting services for makers of nicotine replacement products, including GlaxoSmithKline (London, United Kingdom). Dr. Shiffman has a direct interest in a nicotine replacement product currently under development (JSR LLC, Bethesda, Maryland).
References
Office on Smoking and Health, National Center for Chronic Disease Prevention and Health Promotion, Centers for Disease Control and Prevention. Nicotine addiction. A report of the Surgeon General. Atlanta, GA: Centers for Disease Control and Prevention,
Royal College of Physicians. Nicotine addiction in Britain: a report of the Tobacco Advisory Group of the Royal College of Physicians. London, United Kingdom: Royal College of Physicians,
Benowitz NL, Henningfield JE. Establishing a nicotine threshold for addiction—the implications for tobacco regulation.
Chaiton MO, Collishaw NE, Callard AJ. Smoker preference for “elastic cigarettes” in the Canadian cigarette market.
Kozlowski LT, Dreschel NA, Stellman SD, et al. An extremely compensatible cigarette by design: documentary evidence on industry awareness and reactions to the Barclay filter design cheating the tar testing system.
Kozlowski LT, O'Connor RJ, Sweeney CT. Cigarette design. In: Burns DM, Benowitz NL, eds. Risks associated with smoking cigarettes with low machine-measured yields of tar and nicotine. (Smoking and tobacco control monograph no. 13). Bethesda, MD: National Cancer Institute,
Byrd GD, Davis RA, Caldwell WS, et al. A further study of FTC yield and nicotine absorption in smokers.
Kozlowski LT, O'Connor RJ. Cigarette filter ventilation is a defective design because of misleading taste, bigger puffs, and blocked vents.
Byrd GD, Robinson JH, Caldwell WS, et al. Comparison of measured and FTC-predicted nicotine uptake in smokers.
Gori GB, Lynch CJ. Smoker intake from cigarettes in the 1-mg Federal Trade Commission tar class.
Gori GB, Lynch CJ. Analytical cigarette yields as predictors of smoke bioavailability.
Jarvis MJ, Boreham R, Primatesta P, et al. Nicotine yield from machine-smoked cigarettes and nicotine intakes in smokers: evidence from a representative population survey.
Woodward M, Tunstall-Pedoe H. Self-titration of nicotine: evidence from the Scottish Heart Health Study.
Ueda K, Kawachi I, Nakamura M, et al. Cigarette nicotine yields and nicotine intake among Japanese male workers.
Benowitz NL, Jacob P III, Bernert JT, et al. Carcinogen exposure during short-term switching from regular to “light” cigarettes.
Hecht SS, Murphy SE, Carmella SG, et al. Similar uptake of lung carcinogens by smokers of regular, light, and ultralight cigarettes.
Harris JE. Incomplete compensation does not imply reduced harm: yields of 40 smoke toxicants per milligram nicotine in regular filter versus low-tar cigarettes in the 1999 Massachusetts Benchmark Study.
Hyland A, Cummings KM. Changes in measures of nicotine dependence using cross-sectional and longitudinal data from COMMIT. In: Marcus SE, ed. Those who continue to smoke: is achieving abstinence harder and do we need to change our interventions? (Smoking and tobacco control monograph no. 15). Bethesda, MD: National Cancer Institute,
Burns DM, Major JM, Shanks TG. Changes in number of cigarettes smoked per day: cross-sectional and birth cohort analyses using NHIS. In: Marcus SE, ed. Those who continue to smoke: is achieving abstinence harder and do we need to change our interventions? (Smoking and tobacco control monograph no. 15). Bethesda, MD: National Cancer Institute,
Burns DM, Major JM, Anderson CM, et al. Changes in cross-sectional measures of cessation, numbers of cigarettes smoked per day, and time to first cigarette—California and national data. In: Marcus SE, ed. Those who continue to smoke: is achieving abstinence harder and do we need to change our interventions? (Smoking and tobacco control monograph no. 15). Bethesda, MD: National Cancer Institute,
Celebucki CC, Brawarsky P. Hardening of the target: evidence from Massachusetts. In: Marcus SE, ed. Those who continue to smoke: is achieving abstinence harder and do we need to change our interventions? (Smoking and tobacco control monograph no. 15). Bethesda, MD: National Cancer Institute,
Hassmiller KM, Warner KE, Mendez D, et al. Nondaily smokers: who are they?
Wortley PM, Husten CG, Trosclair A, et al. Nondaily smokers: a descriptive analysis.
Trosclair A, Caraballo R, Malarcher A, et al. Cigarette smoking among adults—United States, 2003.
Husten C, Jackson K, Lee C. Cigarette smoking among adults—United States, 2002.
Porter S, Jackson K, Trosclair A, et al. Prevalence of current cigarette smoking among adults and changes in prevalence of current and some day smoking—United States, 1996–2001.
Evans WN, Farrelly MC. The compensating behavior of smokers: taxes, tar, and nicotine.
Cummings KM. Programs and policies to discourage the use of tobacco products.
Hughes JR. The case for hardening of the target. In: Marcus SE, ed. Those who continue to smoke: is achieving abstinence harder and do we need to change our interventions? (Smoking and tobacco control monograph no. 15). Bethesda, MD: National Cancer Institute,
Benowitz NL, Jacob P. Nicotine and cotinine elimination pharmacokinetics in smokers and nonsmokers.
Bernert JT Jr, Turner WE, Pirkle JL, et al. Development and validation of sensitive method for determination of serum cotinine in smokers and nonsmokers by liquid chromatography/atmospheric pressure ionization tandem mass spectrometry.
Benowitz NL, Jacob P III. Metabolism of nicotine to cotinine studied by a dual stable isotope method.
National Center for Health Statistics, Centers for Disease Control and Prevention. National Health and Nutrition Examination Survey. NHANES III data files. Hyattsville, MD: National Center for Health Statistics,
National Center for Health Statistics, Centers for Disease Control and Prevention. National Health and Nutrition Examination Survey. NHANES 1999–2000. Hyattsville, MD: National Center for Health Statistics,
National Center for Health Statistics, Centers for Disease Control and Prevention. National Health and Nutrition Examination Survey. NHANES 2001–2002. Hyattsville, MD: National Center for Health Statistics,
Pirkle JL, Flegan KM, Bernert J, et al. Exposure of the U.S. population to environmental tobacco smoke. The Third National Health and Nutrition Examination Survey, 1988–1991.
Caraballo RS, Giovino GA, Pechacek TF, et al. Racial and ethnic differences in serum cotinine levels of cigarette smokers: Third National Health and Nutrition Examination Survey, 1988–1991.
Caraballo RS, Giovino GA, Pechacek TF, et al. Factors associated with discrepancies between self-reports on cigarette smoking and measured serum cotinine levels among persons aged 17 years or older: Third National Health and Nutrition Examination Survey, 1988–1994.
National Heart, Lung, and Blood Institute. Clinical Guidelines on the Identification, Evaluation, and Treatment of Overweight and Obesity in Adults: the evidence report. (NIH publication no. 98-4083). Bethesda, MD: National Heart, Lung, and Blood Institute,
National Center for Health Statistics, Centers for Disease Control and Prevention. Analytic and reporting guidelines: The Third National Health and Nutrition Examination Survey, NHANES III (1988–94). Hyattsville, MD: National Center for Health Statistics,
National Center for Health Statistics, Centers for Disease Control and Prevention. NHANES analytic guidelines—June 2004 version. Hyattsville, MD: National Center for Health Statistics,
Caban AJ, Lee DJ, Fleming LE, et al. Obesity in U.S. workers: The National Health Interview Survey, 1986 to 2002.
Federal Trade Commission. Federal Trade Commission cigarette report for 2003. Washington, DC: Federal Trade Commission,
Mustonen TK, Spencer SM, Hoskinson RA Jr, et al. The influence of gender, race, and menthol content on tobacco exposure measures.
Pickett KE, Rathouz PJ, Kasza K, et al. Self-reported smoking, cotinine levels, and patterns of smoking in pregnancy.
Woodward M, Moohan M, Tunstall-Pedoe H. Self-reported smoking, cigarette yields and inhalation biochemistry related to the incidence of coronary heart disease: results from the Scottish Heart Health Study.
Kozlowski LT, Herman CP. The interaction of psychosocial and biological determinants of tobacco use: more on the boundary model.
Warner KE, Burns DM. Hardening and the hard-core smoker: concepts, evidence, and implications.
Shiffman S, Gitchell J, Pinney JM, et al. Public health benefit of over-the-counter nicotine medications.
Godtfredsen NS, Osler M, Vestbo J, et al. Smoking reduction, smoking cessation, and incidence of fatal and non-fatal myocardial infarction in Denmark 1976–1998: a pooled cohort study.
Prescott E, Scharling H, Osler M, et al. Importance of light smoking and inhalation habits on risk of myocardial infarction and all cause mortality. A 22 year follow up of 12 149 men and women in the Copenhagen City Heart Study.
Godtfredsen NS, Holst C, Prescott E, et al. Smoking reduction, smoking cessation, and mortality: a 16-year follow-up of 19,732 men and women from the Copenhagen Centre for Prospective Population Studies.
Hecht SS, Murphy SE, Carmella SG, et al. Effects of reduced cigarette smoking on the uptake of a tobacco-specific lung carcinogen.
Benowitz NL, Jacob P III, Kozlowski L, et al. Influence of smoking fewer cigarettes on exposure to tar, nicotine, and carbon monoxide exposure.
Hyland A, Levy D, Rezaishiraz H, et al. Reduction in amount smoked predicts future cessation.
Hughes JR, Carpenter MJ. The feasibility of smoking reduction: an update.
Hughes JR. Reduced smoking: an introduction and review of the evidence.
Shiffman S, Waters A, Hickcox M. The Nicotine Dependence Syndrome Scale: a multidimensional measure of nicotine dependence.

