


Abstract
Short-term effects of air pollution on common morbidity are largely unknown. The authors explored links between daily levels of air pollution (nitrogen dioxide, ozone, and particulate matter less than 10 μm in diameter (PM10)) and medical home visits made for diverse reasons in Bordeaux, France, during 2000–2006. Daily numbers of visits were obtained from a network of general practitioners. The excess relative risk (ERR) of a visit for each indicator associated with increased pollutant levels was estimated by fitting a Poisson regression model, controlling for well-known confounding factors and temporal trends. Positive and significant associations were found between air pollution and most health indicators. A 10-μg/m3 increase in PM10 levels was associated with increases in visits for upper and lower respiratory diseases (ERRs were 1.5% (95% confidence interval (CI): 0.3, 2.7) and 2.5% (95% CI: 0.5, 4.4), respectively), headache and asthenia (ERR = 3.5%, 95% CI: 1.3, 5.9), and skin rash and conjunctivitis (ERR = 3.2%, 95% CI: −0.2, 6.8). Significant associations were also found between nitrogen dioxide and ozone and several health indicators. Distributed-lag models showed no harvesting effect, and some effects persisted up to 15 days after exposure increased. These results suggest that considering only the most severe effects of air pollution leads to underestimation of its impact on public health.
The health effects of air pollution have been subject to intense epidemiologic and experimental study during the past 2 decades. It is now well-documented that day-to-day variations in air pollutant levels are associated with cardiorespiratory morbidity and mortality (1), and several biologic hypotheses have been proposed to explain air pollutant effects, mainly involving acute pulmonary inflammation and oxidative stress (2). These effects have been widely studied for particulate air pollution, but there is also substantial evidence concerning gaseous pollutants such as ozone and nitrogen dioxide. The exposure-risk relations observed are usually described as linear without any threshold (3, 4), or results suggest that the threshold above which no effect would be observed is far below the concentrations observed in urban areas (5). Furthermore, the severity of these effects is widely variable, and they can affect more or fewer people; indeed, short-term effects of air pollution are often represented as a pyramid, with the mildest but not uncommon effects at the bottom and the least common but more severe effects at the top (Figure 1).
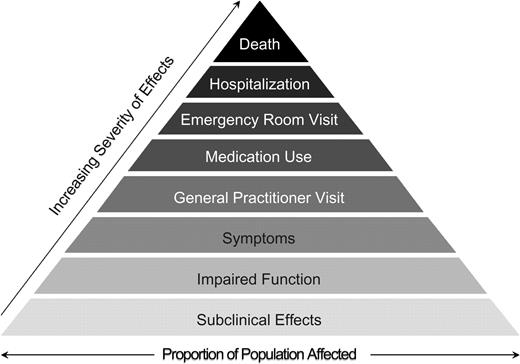
Pyramidal representation of the hypothesized short-term effects of air pollution on health.
Most epidemiologic studies conducted to date have focused on severe events such as mortality, hospitalizations, and emergency room visits. On the other hand, more common effects have been less well described, mainly because of the unavailability of reliable indicators of primary-care setting, symptoms, or medication use. A few studies showed a significant association between air pollutant levels and general practitioner home visits in Paris, France (6), London, United Kingdom (7–9), and Hong Kong, China (10), but those studies focused on respiratory diseases; other symptoms have rarely been investigated.
In Bordeaux, a mid-sized metropolitan area in southwestern France, a network of 60 general practitioners has been collecting data on the practitioners’ activities for many years, allowing us to link their activity with air pollutant levels measured over the Bordeaux area. Therefore, our aim in this study was to explore the links between daily levels of air pollution indicators (nitrogen dioxide, ozone, and particulate matter less than 10 μm in diameter (PM10)) and daily numbers of medical home visits made for nonsevere reasons, some of which are known to be associated with air pollution (respiratory diseases) and others of which have a less well described association with air pollution (headache, asthenia, conjunctivitis, and skin rash) in this area.
MATERIALS AND METHODS
Study population and period
This study was conducted during the period 2000–2006 in the area of Bordeaux, France. It included Bordeaux and 21 other neighboring cities where urbanization and background air pollutant levels could be considered homogeneous, representing a total population of approximately 600,000 inhabitants.
Estimates of pollution exposure
The local air quality monitoring network, AIRAQ (http://www.airaq.asso.fr/), provided data on daily levels of ambient air pollutants measured within the study area: nitrogen dioxide, PM10, and ozone. We used measurements from the 4 background monitoring stations available in the study area, because they are not influenced by occasional sources of pollution, since they are located some distance away from major roads and industries.
For each air pollutant, we calculated correlation coefficients for correlations between the different stations in order to ensure that they all measured the same type of pollution (r > 0.60); the daily level of each air pollution indicator was then computed as the arithmetic mean of the daily levels recorded by the stations (for PM10 and nitrogen dioxide) or the arithmetic mean of the daily maximum of 8-hour moving averages (for ozone).
Health outcomes
SOS Médecins is the primary emergency and health-care network in France, providing home medical visits by general practitioners in response to private house calls 24 hours a day, 7 days a week. In the urban area of Bordeaux, SOS Médecins comprises 60 general practitioners who make more than 400 visits per day, operating in an area of approximately 800,000 inhabitants. Characteristics concerning each visit are logged into a local database; all symptoms and/or complaints reported by the patients are coded and recorded according to the International Classification of Primary Care, Second Edition (11), as well as the final diagnosis. From this database, we extracted daily numbers of visits made to people living in the study area for the following reasons: upper and lower respiratory diseases, asthma, asthenia, headache, conjunctivitis, and skin rash (Table 1). In order to evaluate any bias in the analysis, we also extracted and modeled daily numbers of visits made for lumbago, which is unrelated to air pollution a priori, according to the same method.
Health Indicators and Corresponding ICPC-2 Codes Used in a Study of Air Pollutant Effects, Bordeaux, France, 2000–2006
| Health Indicator | Corresponding Syndrome(s) and/or Symptom(s) | ICPC-2 Code(s) |
| Upper respiratory diseases | Tonsillitis, sinusitis, rhinitis, nasopharyngitis, pharyngitis, laryngitis, tracheitis | R75, R76, R77, R83, R97 |
| Lower respiratory diseases | Bronchitis, bronchiolitis, chronic obstructive pulmonary disease, cough | R78, R79, R95, R05 |
| Asthma | Asthma | R96 |
| Asthenia | Asthenia | A04 |
| Headache | Headache | N01, N89 |
| Conjunctivitis | Conjunctivitis | F70, F71 |
| Skin rash | Dermatitis, eczema, urticaria, skin rash | S07, S87, S98 |
Abbreviation: ICPC-2, International Classification of Primary Care, Second Edition (11).
Potentially confounding factors
Data on the following potentially confounding factors were collected: ambient temperature measured at the Bordeaux meteorologic station, obtained from the national meteorologic institute (Météo-France); periods of influenza epidemics, obtained from the SOS Médecins database (according to a local influenza epidemic threshold that usually allows monitoring of the disease in the area); pollen counts measured at the Bordeaux pollen monitoring station, obtained from the French surveillance system for pollen counts (Réseau National de Surveillance Aérobiologique); and dates of holidays, obtained from the French Ministry of Education.
Statistical analysis
Daily numbers of medical home visits were analyzed with time-series methods, using generalized additive Poisson regression models allowing for overdispersion (12). Each air pollution indicator was included in the model as a linear term, and different lags were tested: pollutant levels on the current day and up to 3 days before (lags of 0, 1, 2, and 3 days) and mean levels during the current day and the previous 1, 2, or 3 days (lags of 0–1, 0–2, and 0–3 days). The lag that minimized Akaike's Information Criterion (13) was retained. Adjustments were made for possible confounders—including long-term trends, seasonality, days of the week, holidays, minimum temperature on the current day and maximum temperature on the previous day, and influenza epidemics—following the methods of the APHEA-2 [Air Pollution And Health: A European Approach] Study (14). Long-term trends and seasonality were modeled using penalized cubic regression splines. The degree of smoothing of the spline function was chosen to remove seasonal and long-term temporal trends by minimizing the autocorrelation in the residuals. Dummy variables for days of the week and holidays were included as other independent variables. Temperature and influenza epidemics were modeled using natural splines with 3 degrees of freedom for each. The lack of residual autocorrelation was checked through the partial autocorrelation, and the Bartlett test was used to check that white noise was obtained.
A term for interaction between ozone and season was introduced into the regression models to specifically assess the effect of ozone during the warmer months (April–September).
All results are presented as the excess relative risk (ERR) of a medical home visit (expressed as a percentage) associated with a 10-μg/m3 increase in air pollution indicator level. To determine whether there were any effects in subgroups of the population, we also performed analyses on specific age groups, when the number of events was large enough, notably to estimate specific ERRs for frail populations such as children under age 15 years (15) and people aged 65 years or more (16).
This model could not be used for ozone, because the term for interaction between ozone and season led to many breaks in the pollutant series.
RESULTS
The study area comprised 22 cities and more than 600,000 inhabitants, of whom 15.5% were less than 15 years of age and 15.7% were aged 65 years or older. Descriptive results for daily air pollutant levels and health indicators are shown in Table 2.
Daily Air Pollutant Levels and Daily Numbers of General Practitioners’ Visits Made for Different Health Indicators, Bordeaux, France, 2000–2006
| Air Pollution or Health Indicator | Mean | Minimum | 5th Percentile | 50th Percentile | 95th Percentile | Maximum |
| Pollutant Level, μg/m3 | ||||||
| Nitrogen dioxide | 21.9 | 3.8 | 8.0 | 20.3 | 41.3 | 80.3 |
| Ozone | 69.3 | 2.7 | 32.5 | 68.2 | 111.8 | 142.7 |
| Ozone in spring and summera | 84.8 | 37.5 | 48.7 | 81.5 | 117.1 | 142.7 |
| PM10 | 21.1 | 5.0 | 10.3 | 18.8 | 38.5 | 88.2 |
| No. of Visits | ||||||
| Upper respiratory diseases | 57.6 | 8 | 25 | 56 | 96 | 149 |
| Lower respiratory diseases | 16.4 | 0 | 4 | 14 | 38 | 77 |
| Asthma | 3.5 | 0 | 0 | 3 | 8 | 19 |
| Asthenia | 2.2 | 0 | 0 | 2 | 5 | 11 |
| Headache | 4.1 | 0 | 1 | 4 | 8 | 18 |
| Conjunctivitis | 0.6 | 0 | 0 | 0 | 2 | 8 |
| Skin rash | 3.5 | 0 | 0 | 3 | 8 | 15 |
| Lumbago (control) | 5.7 | 0 | 2 | 5 | 11 | 20 |
Abbreviation: PM10, particulate matter less than 10 μm in diameter.
April 1–September 30.
Bordeaux is a moderately polluted area, with annual mean levels of nitrogen dioxide and PM10 that are largely below the current French annual guidelines (40 μg/m3) (18), but PM10 levels are slightly above the 2005 World Health Organization guidelines (20 μg/m3) (19). Daily maximum levels of 8-hour moving averages of ozone overtook the threshold for health protection (120 μg/m3) during less than 5% of the study period.
During the 7-year study period, a total of 895,710 medical home visits were made by SOS Médecins Bordeaux, corresponding to a daily mean of 350 visits. Visits for respiratory diseases represented approximately 20% of the activity of the general practitioners. Since the numbers of visits for the 4 other indicators were quite low, we grouped together the indicators asthenia and headache, which correspond to a general health impairment without another diagnosed disease, and conjunctivitis and skin rash, which can be related to irritation and atopy.
As Figure 2 shows, the general practitioners’ activity showed important day-of-the-week and seasonal variations. The daily number of visits increased on weekends and during the winter.
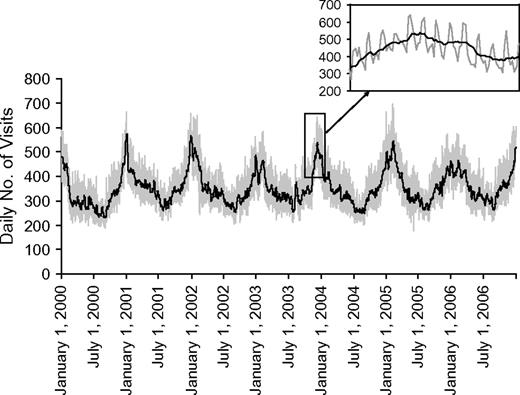
Seasonal (main graph) and daily (inset) numbers of medical home visits (gray line) made to persons in the Bordeaux metropolitan area and 7-day moving averages (black line), Bordeaux, France, 2000–2006.
We constructed specific models for each health indicator and each air pollution indicator. The mean of the lag 0–3 days led to the best model for all indicators except headache/asthenia, for which a lag of 0 was considered for every air pollution indicator. Table 3 presents the ERR of a medical home visit associated with a 10-μg/m3 increase in air pollutant levels for each health indicator.
Excess Relative Risk (%) of a Medical Home Visit Associated With a 10-μg/m3 Increase in Air Pollutant Levels, Bordeaux, France, 2000–2006
| Diagnosis | Nitrogen Dioxide | PM10 | Ozone | |||
| ERR | 95% CI | ERR | 95% CI | ERR | 95% CI | |
| Upper respiratory diseasesa | 0.8 | −0.7, 2.3 | 1.5 | 0.3, 2.7 | −0.6 | −1.7, 0.5 |
| Lower respiratory diseasesa | 2.6 | 0.2, 4.9 | 2.5 | 0.5, 4.4 | −0.4 | −2.5, 1.7 |
| Asthmaa | 1.1 | −3.0, 5.2 | 0.5 | −3.1, 4.1 | −0.8 | −3.9, 2.3 |
| Headache or astheniab | 2.8 | 0.4, 5.3 | 3.5 | 1.3, 5.9 | 1.7 | 0.2, 3.3 |
| Skin rash or conjunctivitisa | 0.3 | −3.3, 4.2 | 3.2 | −0.2, 6.8 | 3.0 | 0.4, 5.7 |
| Lumbago (control)a | −0.3 | −3.4, 2.9 | 0.5 | −2.3, 3.5 | 0.5 | −1.6, 2.6 |
Abbreviations: CI, confidence interval; ERR, excess relative risk; PM10, particulate matter less than 10 μm in diameter.
Lag of 0–3 days.
Lag of 0 days.
The risk of a visit for upper respiratory diseases was significantly increased by 1.5% (95% confidence interval (CI): 0.3, 2.7) during the 3 days following a 10-μg/m3 increase in PM10 levels; a similar but nonsignificant trend was also observed for an increase in nitrogen dioxide levels. Similarly, the risks of consulting a general practitioner for lower respiratory diseases increased by 2.6% (95% CI: 0.2, 4.9) and 2.5% (95% CI: 0.5, 4.4) following 10-μg/m3 increases in nitrogen dioxide and PM10 levels, respectively. Asthma was not associated with any of the indicators considered, and no trend was found, nor was an association found between visits made for respiratory diseases and ozone.
The daily number of visits made for headache or asthenia was significantly associated with the 3 air pollution indicators considered; same-day ERRs were 2.8% (95% CI: 0.4, 5.3), 3.5% (95% CI: 1.3, 5.9), and 1.7% (95% CI: 0.2, 3.3) for 10-μg/m3 increases in nitrogen dioxide, PM10, and ozone levels, respectively. The risk of a visit for skin rash or conjunctivitis was also increased during the 3 days following increases in PM10 (ERR = 3.2%, 95% CI: −0.2, 6.8 (close to significance)) and ozone (ERR = 3.0%, 95% CI: 0.4, 5.7) levels.
Lastly, the daily number of visits made for lumbago, which we chose as the control outcome in order to evaluate any bias in the analyses, was not associated with any of the pollutant indicators considered.
Results from complementary analyses of specific age groups are illustrated in Figure 3. Although the confidence intervals overlapped, central estimates of ERR were much higher in the elderly for respiratory diseases (upper and lower), regardless of the type of pollutant, suggesting a higher effect in this subgroup. This difference was particularly important for upper respiratory diseases, with ERRs of 12.3% (95% CI: 4.9, 19.7) and 8.3% (95% CI: 2.0, 14.7) being associated with 10-μg/m3 increases in nitrogen dioxide and PM10 levels, respectively, in this subgroup. In the other age groups, effects were close to each other.
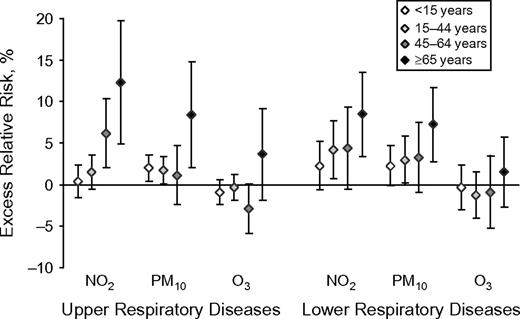
Excess relative risk (%) of a medical home visit for upper and lower respiratory diseases associated with a 10-μg/m3 increase in air pollutants, Bordeaux, France, 2000–2006. NO2, nitrogen dioxide; O3, ozone; PM10, particulate matter less than 10 μm in diameter. Bars, 95% confidence interval.
For asthma, in addition to the whole population, no association was observed in children.
When distributed-lag models were used, no harvesting effect was observed, regardless of which health indicator was considered. Figure 4 compares the results from initial models and from distributed-lag models, in which up to 15 days of lag time between the exposure and health effects were considered. Taking into account lags over 15 days did not lead to larger associations between PM10 and numbers of home visits, whatever the diagnosis considered, whereas estimates for nitrogen dioxide were much higher when the effects of lags of up to 15 days on upper respiratory diseases (global ERR = 5.7%, 95% CI: 2.7, 8.8) and lower respiratory diseases (global ERR = 9.4%, 95% CI: 4.7, 14.3) were considered. It is also noteworthy that there was a much higher effect of nitrogen dioxide on visits for skin rash and conjunctivitis when delayed effects were considered, even though the excess risk was not significant because of a large confidence interval.
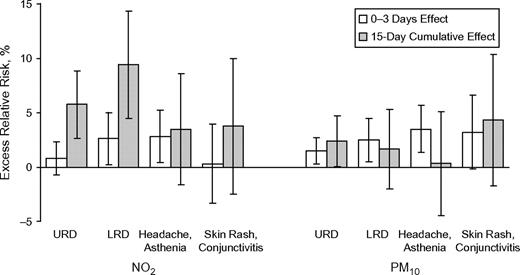
Comparison of excess relative risks (%) of a medical home visit obtained using a lag time of 0–3 days with excess relative risks obtained using distributed-lag models (15-day cumulative effect), Bordeaux, France, 2000–2006. LRD, lower respiratory diseases; NO2, nitrogen dioxide; PM10, particulate matter less than 10 μm in diameter; URD, upper respiratory diseases. Bars, 95% confidence interval.
The persistence of nitrogen dioxide effects over 15 days is illustrated in Figure 5, which represents the ERR of a visit for upper respiratory diseases estimated for each lag up to 14 days through distributed-lag models. This ERR started to decrease progressively about 10 days after exposure and was significant up to a lag of 11 days.
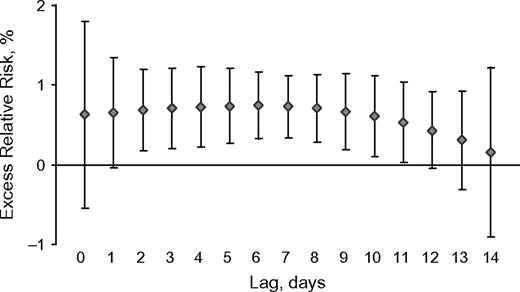
Excess relative risk (%) of a medical home visit for upper respiratory diseases associated with a 10-μg/m3 increase in nitrogen dioxide levels, by lag time, Bordeaux, France, 2000–2006. Bars, 95% confidence interval.
DISCUSSION
This study is one of the few to have investigated short-term relations between air pollution and morbidity through diagnoses made by general practitioners. It underlines that the health effects of air pollution are not restricted to the cardiorespiratory system but can also increase the risks of other conditions that have rarely been described as being associated with air pollution, such as headache, asthenia, conjunctivitis, and skin rash.
The main strength of this study was the availability of reliable health data reflecting the activity of general practitioners in the general population, which is usually hard to monitor. Indeed, anyone in need of a medical visit can call SOS Médecins, which therefore makes visits in the general population by definition. The medical diagnoses are recorded by the physicians themselves after every visit, using standardized codes for each disease. This is not the case for similar organizations in France, which have only been collecting information on the complaints, symptoms, and infections reported by the patients. That is the reason for the main limitation of this study: It was a unicentric study because of the lack of similar available data from other cities covering the past several years. The population served by SOS Médecins might have changed during the study period, which was quite long, and it might also have changed according to season, since the study area has a high level of tourism. However, the adjustment for season and long-term trends allowed us to take into account those variations, as well as variations in the general practitioners’ activity. Concerning exposure, all of the monitoring stations were selected in accordance with local experts who considered them representative of the background exposure within the study area. Although levels measured by these stations do not accurately reflect individual levels of exposure, published research has shown that their day-to-day variations are well correlated with variations in individual exposure (20).
Our results for respiratory diseases are globally in agreement with those of the few studies that have investigated relations between air pollution and general practitioner activity, and are supported by biologic hypotheses. Indeed, almost all of the studies that investigated the association between PM10 and general practitioners’ visits for upper (6, 9, 10) and/or lower (6, 21) respiratory diseases observed such a relation; the exception was 1 study focusing on children, for which the study period was very short (22). Concerning nitrogen dioxide, most of the studies found an association between this indicator and consultations for respiratory diseases (10, 21–23); this was not found in the latest period of a study based on visits made by SOS Médecins in the Greater Paris area (6). The associations between PM10 and nitrogen dioxide, on the one hand, and respiratory diseases, on the other hand, were higher in the elderly. It is probable that air pollution exacerbates preexisting conditions that are more likely to affect elderly people. Furthermore, aging is characterized by a decrease in antioxidant defenses, and the elderly may constitute a group at high risk of suffering from oxidation phenomena induced by air pollution (24). Like other investigators (6, 21), we did not find any association between respiratory diseases and ozone, although this pollutant is well-known for its oxidative properties and was significantly associated with respiratory medical visits in London and Hong Kong (8, 10).
The most innovative results of this study concern the association between air pollution and conjunctivitis and skin rash, in relation to a potential atopic etiology of these 2 diseases, as well as the association between air pollution and headache and asthenia, which reflects general health impairment without a clearly diagnosed disease. To our knowledge, no experimental study has shown such an association, because these symptoms cannot be objectively measured and therefore are diagnosed on a declarative basis. However, a link between air pollution and physicians’ visits for headache was observed in the Evaluation des Risques de la Pollution Urbaine sur la Santé (ERPURS) program (23), with ERRs slightly lower than but in the same range as those in the current study. Szyszkowicz (25) also found a link between several air pollutant indicators and emergency visits for headache in Montreal, Canada; several lag times were tested, and the highest ERRs associated with pollutant level increases were observed for the same day, just as in the present study, and were within the same range. Thus, air pollutants could have a very short-term effect on unspecific syndromes like asthenia and/or headache—conditions which are not very severe but can be painful and affect many people.
Conjunctivitis and skin rash were also significantly associated with PM10 and ozone levels, confirming the potential link between air pollution and allergic diseases other than respiratory diseases. Indeed, exposure to air pollutants is able to trigger an immunoglobulin E response and to induce oxidative protein damage in the stratum corneum, leading to the disruption of barrier function and exacerbation of atopic dermatitis (26). In the ERPURS program (22), eye conditions were found to be exclusively related to ozone levels; the concordance of results from both our study and the ERPURS study strongly favors an association between eye diseases and ozone, which could be explained by its well-known irritant and oxidant properties. Ocular inflammation and dryness were also shown to be related to high concentrations of atmospheric pollutants in patients suffering from eye discomfort syndrome (27). Lastly, 2 other studies comparing prevalences of atopic eczema (28) or atopic dermatitis and allergic rhinoconjunctivitis (29) showed that prevalences were higher in the most polluted areas. Our results are therefore in accordance with those of the few published studies available, which all suggest the existence of a link between air pollutant exposure and dermatitis and/or eye diseases. Furthermore, results found for more commonly studied indicators are totally in accordance with results from the literature, which also favors a robustness of our analyses with regard to these innovative health indicators.
Also favoring the robustness of our results is the lack of any significant relation between air pollution and visits made for lumbago, the outcome chosen as the control health indicator, since it is not related a priori to air pollution.
In addition, we used distributed-lag models which have been recently used in environmental epidemiology in order to quantify the so-called “mortality displacement effect” (17). In our study, distributed-lag models produced effect estimates similar to or higher than those of models using 3-day moving averages, suggesting that 1) the effect of air pollution is not simply advanced by a few days, since no obvious harvesting effect is observed, and 2) effects associated with increases in nitrogen dioxide levels persist for 2 weeks after exposure for both upper and lower respiratory diseases. The fact that the use of distributed-lag models led to higher effect estimates for nitrogen dioxide and several health indicators (respiratory diseases, conjunctivitis, and skin rash) but not for other pollution and health indicators suggests that different pollutants can have more or less delayed effects. However, it is difficult to know whether these different types of effects are really linked to the pollutant itself or whether the pollutant acts as a surrogate for other exposures.
The lack of association between air pollution and asthma can be considered surprising in the context of results existing in the literature (30–32). However, studies using data on general practitioner activity are more controversial: In the London study, visits for asthma were associated with several air pollution indicators (7); in the ERPURS program in Paris, this was also the case during the 1991–1995 period (23), but such an association was no longer observed during 2000–2003 (6). Thus, the lack of association could be explained, on the one hand, by the lower number of daily events in comparison with the previous period (representing only 1% of all visits) and, on the other hand, by the fact that asthma treatment has changed, and the context of crisis that motivates general practitioners’ visits might have been consequently modified. Indeed, asthma patients often treat themselves if a crisis occurs and might go directly to the emergency room (without calling a general practitioner) if the crisis cannot be controlled using their usual medication.
In conclusion, we found evidence of an association between air pollutant levels and daily numbers of general practitioners’ visits for various syndromes. This study proves the relevance of such data for epidemiologic research in the field of environmental health. Furthermore, the results of this study will sensitize doctors to the importance of giving as precise a diagnosis as possible, and this will probably help to further increase data quality; better precision in diagnosis will allow us to obtain more specific data on health indicators in the future. The links observed with conjunctivitis, skin rash, headache, and asthenia are very innovative, since few studies have shown relations with them because of the lack of suitable data. They strongly suggest that cardiorespiratory diseases are not the only conditions that can be induced or exacerbated by air pollution and show that focusing on very severe events leads to underestimation of air pollution effects. In terms of public health, this study suggests that a large number of medical visits are attributable to air pollution in Bordeaux, where current levels of air pollutants are globally close to European air quality guidelines for health protection. This is one more convincing argument for promoting all measures aimed at reducing pollutant emissions, on both the individual and collective levels, even in moderately polluted areas.
Abbreviations
- CI
confidence interval
- ERPURS
Evaluation des Risques de la Pollution Urbaine sur la Santé
- ERR
excess relative risk
- PM10
particulate matter less than 10 μm in diameter
Author affiliations: French Institute of Public Health Surveillance, Bordeaux, France (Sophie Larrieu, Gaëlle Gault, Laurent Filleul); French Institute of Public Health Surveillance, Saint Maurice, France (Agnès Lefranc); SOS Médecins, Bordeaux, France (Franck Couvy, Bernard Jouves); and Regional Observatory of Health Ile-de-France, Paris, France (Edouard Chatignoux).
The authors thank SOS Médecins Bordeaux and AIRAQ for their collaboration in providing data and their very useful participation.
Conflict of interest: none declared.

