


Abstract
Background and aims Colour is one of the main floral traits used by pollinators to locate flowers. Although pollinators show innate colour preferences, the view that the colour of a flower may be considered an important predictor of its main pollinators is highly controversial because flower choice is highly context-dependent, and initial innate preferences may be overridden by subsequent associative learning. Our objective is to establish whether there is a relationship between flower colour and pollinator composition in natural communities.
Methods We measured the flower reflectance spectrum and pollinator composition in four plant communities (85 plant species represented by 109 populations, and 32 305 plant–pollinator interactions in total). Pollinators were divided into six taxonomic groups: bees, ants, wasps, coleopterans, dipterans and lepidopterans.
Key Results We found consistent associations between pollinator groups and certain colours. These associations matched innate preferences experimentally established for several pollinators and predictions of the pollination syndrome theory. However, flowers with similar colours did not attract similar pollinator assemblages.
Conclusions The explanation for this paradoxical result is that most flower species are pollination generalists. We conclude that although pollinator colour preferences seem to condition plant–pollinator interactions, the selective force behind these preferences has not been strong enough to mediate the appearance and maintenance of tight colour-based plant–pollinator associations.
INTRODUCTION
Pollinators use flower traits, such as odour, shape, size and colour, as cues to locate pollen–nectar sources and discriminate between different flower species (Chittka and Raine, 2006). Although ultimate flower choice undoubtedly depends on a combination of stimuli, various studies have demonstrated that some pollinators rely strongly on colour to make their foraging decisions (Dafni et al., 1990; Heiling et al., 2003; Ômura and Honda, 2005; Dötterl et al., 2014).
Diurnal pollinators have well-developed colour vision, which in most cases covers a wider range of the spectrum than human vision. The vast majority of pollinators in temperate regions are insects, and different visual models have been developed for different groups (Chittka, 1992; Troje, 1993). The best-studied species are the western honey bee, Apis mellifera, and the bumblebee Bombus terrestris, which share a similar trichromatic system. The visual system of the honey bee, which is usually used as a model for all bees, ranges between 300 and 700 nm, with three types of photoreceptors peaking in the UV, blue and green regions of the spectrum (corresponding to 344, 438 and 560 nm, respectively). Most other insects studied so far also have a trichromatic system, but there are also species with dichromatic (certain flies and coleopterans) and tetrachromatic (mostly butterflies) systems (Briscoe and Chittka, 2001). The trichromatic state is supposed to be ancestral, and the loss or gain of photoreceptor types would be secondary (Briscoe and Chittka, 2001). Insect colour vision appeared long before the emergence of the angiosperms (Chittka, 1997). For this reason, it is believed that flowers tuned their visual signals to the sensory system of pollinators, thus becoming as conspicuous and attractive as possible to them. In support of this view, some pollinator species have been found to show innate preferences for certain colours (Lunau and Maier, 1995; Raine et al., 2006; Raine and Chittka, 2007; Willmer, 2011).
To this extent, colour constitutes one of the main traits used in pollination syndrome theory (Faegri and Van der Pijl, 1979). According to this theory, unrelated plant species adapted to the same pollinators should show convergence of floral traits, including colour. For example, bee-visited flowers are expected to be blue or violet, and beetle-visited flowers are expected to be white or cream (Faegri and Van der Pijl, 1979). Accordingly, some studies have shown that colour changes among related plant species or between populations within the same species are sometimes accompanied by changes in pollinator composition (Bradshaw and Schemske, 2003; Rodríguez-Gironés and Santamaría, 2004; Wolfe and Sowell, 2006). Other studies have shown pollinator colour preferences through experimental manipulations of flower colour (Campbell et al., 2010). Ultimately, flower colour could be considered an important predictor of pollinator group (Fenster et al., 2004). However, other studies do not support this view. Colour preferences predicted by pollination syndromes are not always matched by innate colour preferences (Lunau and Maier, 1995), which in many cases are displayed at a finer taxonomic level, such as genus or species, rather than functional group (Raine et al., 2006). Other studies report that changes in flower colour are not always associated with distinct pollinator assemblages (Cooley et al., 2008).
Even if pollinators show innate preferences for certain colours, actual flower choice in natural communities may not reflect these preferences for two reasons. First, in a natural setting, flower choice may be influenced by the presence and abundance of other co-pollinators potentially competing for flower resources (Waser, 1983; Lázaro et al., 2009). Second, colours may also be used by pollinators as signals of floral rewards, so that initial innate preferences may be modulated by subsequent associative learning (Gumbert, 2000; Goyret et al., 2008). Individual pollinators show remarkable plasticity and are known to switch plants in response to changes in pollen or nectar levels (Heinrich, 1979). Thus, the role of colour in determining ultimate flower choice will depend on the interaction between innate and learned preferences. A handful of studies have analysed the influence of floral colour on pollinator partitioning in plant communities, and most of them conclude that floral colour is an important cue (McCall and Primack, 1992; Bosch et al., 1997; Hingston and McQuillan, 2000; Wolfe and Sowell, 2006; Lázaro et al., 2008). However, colours in these studies were categorized as perceived by humans. Waser et al. (1996) characterized colour based on wavelength measures that were incorporated into the visual model of the honey bee to generate colour categories. In their study, the association between floral colour category and pollinator composition narrowly failed significance. Clearly, further research on this topic is needed.
The aim of this study is to establish whether there is a relationship between flower colour and pollinator visitation in natural communities. To do this, we studied the flower reflectance spectrum and flower visitor assemblages in four plant communities comprising 85 species and 109 plant populations. The four communities are located in the same geographical region, and therefore have similar climatic conditions and share the same regional pool of pollinators. Because the association between flower colour and pollinator composition may be affected by phylogeny, our analyses account for phylogenetic relatedness. We ask two questions: (1) Do different pollinator groups show preferences for certain flower colours? (2) Do plant species with similar colours attract similar pollinator assemblages? Although apparently similar, these two questions address colour–pollinator relationships from two different and complementary perspectives. The first question addresses plant–pollinator relationships from the pollinator’s point of view and the second from the plant’s perspective. The existence of colour preferences by different pollinator groups does not necessarily imply that plants with the same colour attract similar pollinator assemblages. For example, dipterans may preferentially visit flowers with high levels of reflectance in the yellow region of the spectrum, but different yellow flowers may be visited by different pollinator assemblages. The distinction is important because pollination syndrome theory relies on the assumption that plants with similar traits have evolved to attract similar pollinators.
MATERIALS AND METHODS
Study area
We conducted our study in four Mediterranean communities near Barcelona (north-east Spain), whose geographical coordinates are given in Table 1. Distance between sites ranged from 10 to 66 km. The climate is Mediterranean, with a strong sea influence. Summers are dry and most precipitation occurs in spring and autumn. Weather conditions are very similar across the four sites (Table 1). We studied the vast majority of the entomophilous species in each community, without selecting species based on their flower traits or pollinator visitation patterns (Table 1). Therefore our plant sample was unbiased and representative of the flora of the region. Some species were present in more than one community. In these cases, we sampled flower colour and pollinator composition of each population separately (a total of 85 species, 109 populations).
Descriptors of the four communities studied, including vegetation type, dominant species, location, elevation, mean annual precipitation, mean annual temperature and number of species sampled
| Community | Vegetation | Dominant species | Location | Elevation (m.a.s.l.) | Mean annual precipitation (mm) | Mean annual temperature (°C) | Plant species studied |
|---|---|---|---|---|---|---|---|
| CA | Grassland | Hyparrhenia hirta, Brachypodium retusum | Canet de Mar | 50 | 590 | 16·1 | 17 |
| 41°35′ N, 2°34′ E | |||||||
| CO | Open scrubland | Hyparrhenia hirta, Foeniculum vulgare, Cistus monspeliensis | Collserola | 280 | 630 | 14·8 | 46 |
| 41°24′ N, 2°6′ E | |||||||
| GA | Scrubland | Quercus coccifera, Rosmarinus officinalis, Pistacia lentiscus | Garraf | 330 | 580 | 15·7 | 25 |
| 41°16′ N, 1°55′ E | |||||||
| PA | Scrubland | Quercus coccifera, Ulex parviflorus, Pistacia lentiscus | El Papiol | 150 | 628 | 15·4 | 21 |
| 41°27′ N, 2°0′ E |
Pollinator assemblages
Pollinator data were obtained throughout the main general flowering period in the study area (February–July). Very few species bloom in August. Each species was surveyed on several days covering its entire flowering period. In two communities (CA and CO), pollinator surveys were carried out by slowly walking along 25 or 50 m long × 1 m wide vegetation transects. This was done several times throughout the day, from early morning to evening. In the other two communities (GA and PA), selected individuals of each plant species in bloom were observed during 4- or 5-min periods every 1–2 h. All insects observed contacting the reproductive organs of flowers were identified by sight and recorded. Pollinators were assigned to one of six taxonomic groups: bees, ants, wasps, coleopterans, dipterans and lepidopterans. From these surveys, we characterized the pollinator assemblage of each plant species in each of the four communities as the proportion of visits from each pollinator group.
Flower colour measurement
Flowers of each species were collected and transported with a portable cooler to the laboratory, where they were temporarily placed in a cold room at 4 °C. Flower reflectance spectra were measured using an USB4000 spectrometer with a USB-DT deuterium tungsten halogen source (Ocean Optics, Dunedin, FL, USA) connected to a computer running SpectraSuite (Ocean Optics). The light spectrum analysed ranged from 300 to 700 nm, divided into 0·22-nm intervals, and the spectrometer sensor was fixed at an angle of 45° from the measuring area. Petals were mounted on an adhesive tape to obtain a flat surface, thus minimizing reflectance variability due to uneven distances between the petals and the sensor. For small flowers, we had to use several petals from different flowers to cover the entire measuring area. Some species had corollas displaying two or more clearly different colours. When these different colours were largely separated (for example, some Fabaceae in which the keel is clearly differently coloured from the wings and the standard), we took colour measurements of the different parts separately and calculated a weighted mean (according to the surface occupied by each part in the corolla), thus obtaining a single colour value. In corollas showing only small colour markings, such as nectar guides or small dots, a single measurement was taken.
Spectrometer readings incorporate a certain degree of noise. We used Avicol (Gomez, 2006) to clean this noise, thus smoothing the reflectance spectra. This correction (triangular smoothing) is based on a floating mean with weights and a window size of 15 nm. We measured four or five flowers per species, except for three species for which we could only obtain one measure. Different measures were averaged to obtain a single value per species and community.
Colour characterization
We characterized flower colour using two sets of variables: colour descriptors and ‘colour composition’. Colour descriptors (brightness, chroma and hue) are physical properties of colours extracted directly from the reflectance spectrum (Endler, 1990; Smith, 2014). Brightness is a measure of the total intensity of light reflected by a surface; chroma is a measure of purity or saturation of a colour, and it is a function of how rapidly intensity changes with wavelength; hue represents the usual meaning of colour (such as red, pink and yellow), and it is a function of the shape of the spectrum. These three colour descriptors were calculated following Smith (2014). To obtain colour composition, we divided the reflectance spectrum into four broad bands of 100 nm each (300–400, 400–500, 500–600, 600–700 nm; Chittka et al., 1994). Breakpoints delimiting bands were chosen assuming that the majority of the inflection points in floral reflectance spectra are located near 400, 500 and 600 nm (Chittka and Menzel, 1992). Roughly, the first band corresponds to the UV part of the spectrum, the second to the blue–violet, the third to the green–yellow and the fourth to the orange–red (henceforth U, B, Y and R bands). We calculated the proportion of the reflectance spectrum attributable to each band, obtained by dividing the brightness of each band by the total brightness of the sample. By using the proportion, instead of the raw values of brightness of each band, we avoid differences between chromatically equivalent spectra, i.e. spectra with the same shape but different brightness (Endler, 1990). It is important to note that flower colours result from the combination of reflectance levels across the spectrum. For example, white flowers reflect from 400 to 700 nm and yellow flowers from 500 to 700 nm. Lilac–pink flowers reflect in the blue and red regions with a variable proportion in the yellow region, and purple flowers reflect in the UV, blue and red regions of the spectrum (Supplementary Data Table S1).
Data analysis
Phylogenetic signal of colour variables
To establish whether colour was phylogenetically constrained, we built a phylogenetic tree of the 85 species using Phylocom (Webb et al., 2008), with family names following the Angiosperm Phylogeny Group classification (The Angiosperm Phylogeny Group 2009). We used the bladj function in Phylocom to achieve an ultrametric rooted tree. Polytomies generated by the program were hand-resolved. All distances between families (assessed as millions of years of divergence) and some distances between genera were obtained from the database www.timetree.org (Hedges et al., 2006). Additional distances between genera and distances between species were extracted from the literature [Allan and Porter, 2000; Lavin et al., 2005 (Fabaceae); Barres et al., 2013 (Cardueae); Bremer, 2009 (Ericales); Guzmán and Vargas, 2009 (Cistaceae); Mansion et al., 2009 (Boraginaceae); Couvreur et al., 2010 (Brassicaceae); Bendiksby et al., 2011; Drew and Sytsma, 2012 (Lamiaceae); Koopman and Baum, 2008 (Malvaceae); Ruiz-Sanchez et al., 2012 (Papaveraceae); Riina et al., 2013 (Euphorbiaceae); Banasiak et al., 2013 (Apiaceae)]. The resulting tree is shown in Supplementary Data Fig. S1.
We tested for the presence of phylogenetic signal in brightness, chroma and hue with Blomberg’s K test (Blomberg et al., 2003) using the phylosig function of the R package phytools (Revell, 2012). This was done for each community separately and for the 85 species together. We also tested for the presence of phylogenetic signal in flower colour composition. To do this, we divided the colour spectrum into 40 bands of 10 nm each and obtained the mean reflectance value of each band. We used 40 bands instead of the four bands used to define colour composition to increase the resolution of this analysis. We then used the generalized K statistic described by Adams (2014), Kmult, specifically developed for high-dimensional multivariate data. This analysis was performed with the function physignal of the package geomorph for R (Adams and Otarola-Castillo, 2013). Again, we conducted this analysis for each community separately and for the 85 species together.
Association between pollinator groups and regions of the colour spectrum
We explored possible preferences of the different pollinator groups for certain regions of the colour spectrum by means of canonical correspondence analyses (CCAs), including the pollinator assemblage of each population and relative brightness of the four above-mentioned colour bands (U, B, Y and R). This was done again for the four communities separately and for all species together. CCAs were performed using the function CCorA in the R package vegan (Oksanen et al., 2015).
Relationship between flower colour and pollinator assemblages
To test whether flowers with similar colours had similar pollinator assemblages, we conducted a partial Mantel test between distance matrices of colour composition (combination of the proportion of the four colour bands) and pollinator assemblages, including the phylogenetic distance matrix as covariable. We then followed the same approach to test the association between pollinator assemblages and the other colour variables (brightness, chroma, hue). We used Bray–Curtis distances between pairs of species for pollinator composition and colour composition, and Euclidean distances between species for brightness, chroma and hue. These analyses were done for each community separately and for the four communities lumped together. In the latter case, because the same species may attract different pollinators in different communities, we maintained all 109 populations. For plant species present in more than one community, we assigned a very low value of divergence (1000 years) between conspecific populations. These analyses were performed with the function mantel.partial in the R package vegan.
RESULTS
We recorded 32 305 plant–pollinator interactions. The number of interactions recorded in each community ranged from 3505 (CA) to 13673 (CO) (Supplementary Data Table S2). Mean number of interactions per population was 206 in CA (range 43–1454), 297 in CO (range 42–1911), 364 in GA (range 26–1730) and 307 in PA (range 31–1359). Overall, 88·5 % of the populations surveyed had more than 50 recorded interactions. Most of the pollinators recorded were bees, accounting for 48·9 % of the flower visits. The second most frequent group was coleopterans (21·5 % of the interactions), followed by ants (14·7 %), dipterans (8·8 %), lepidopterans (3·5 %) and wasps (2·5 %). Bees and coleopterans were the two most abundant groups in all four communities, except CA, which was largely dominated by ants (Table S2).
The four communities showed a high degree of similarity in flower colours. The most common floral colour in the four communities was lilac–pink (30–50 % of the species), followed by white (16–29 %) (Table S1). UV–yellow flowers were also well represented (14–24 %), although they were lacking in GA. Yellow (12–15 %), purple (4–9 %) and green (4–6 %) flowers were less frequent. The association between colour categories and pollinator composition is shown in Supplementary Data Table S3.
Phylogenetic signal of colour variables
All colour descriptors considered showed significant phylogenetic signal when the four communities were pooled (Table 2). In most cases, however, significance was lost when the communities were analysed separately, possibly due to small sample sizes. In all cases, K and Kmult values were <1, indicating that related species were less similar than expected under the Brownian motion evolution model.
Analyses of phylogenetic signal for colour descriptors brightness, chroma, hue (Blomberg’s K values) and colour composition (Kmult values) in the four study communities separately and lumped together. Significant results (P < 0·05) in bold
| Community | Number of species | Brightness | Chroma | Hue | Colour composition |
|---|---|---|---|---|---|
| CA | 17 | 0·73 | 0·78 | 0·85 | 0·48 |
| CO | 46 | 0·35 | 0·57 | 0·71 | 0·33 |
| GA | 25 | 0·26 | 0·61 | 0·44 | 0·25 |
| PA | 21 | 0·34 | 0·52 | 0·76 | 0·26 |
| CA+CO+GA+PA | 85 | 0·57 | 0·60 | 0·71 | 0·38 |
Association between pollinator groups and regions of the colour spectrum
The CCAs revealed clear associations between certain pollinator groups and certain colours (Figs 1and 2). Visual inspection of the resulting biplots revealed that some of these patterns were relatively consistent across the four communities (Fig. 1, Table 3).
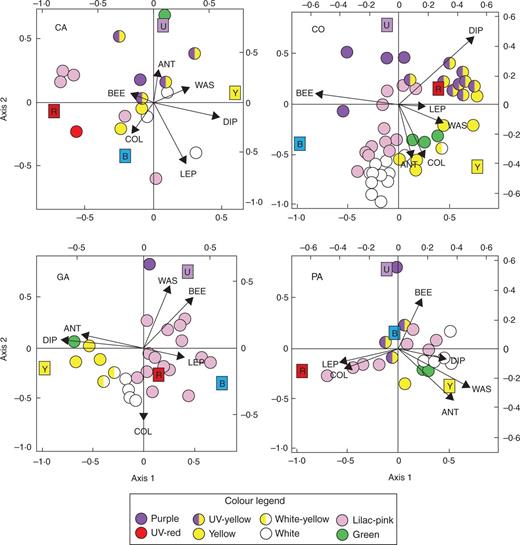
CCA biplots of pollinator groups and bands of the colour spectrum (coloured squares) corresponding to UV, blue, yellow and red in each of the four communities (CA, CO, GA, PA). Each dot represents a plant population and dot colours correspond to the flower colour categories shown in the legend (for example spectra of each category, see Table S1). BEE, bees; ANT, ants; WAS, wasps; DIP, dipterans; COL, coleopterans; LEP, lepidopterans.
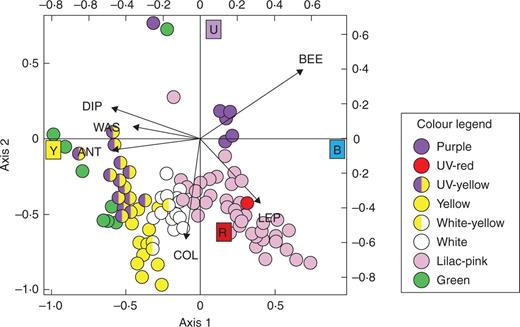
CCA biplot of pollinator groups and bands of the colour spectrum (coloured squares) corresponding to UV, blue, yellow and red (data from the four communities lumped together). Each dot represents a plant population and dot colours correspond to the flower colour categories shown in the legend (for example spectra of each category, see Table S1). BEE, bees; ANT, ants; WAS, wasps; DIP, dipterans; COL, coleopterans; LEP, lepidopterans.
R values of phylogenetically controlled partial Mantel tests between colour descriptors and pollinator composition in the four communities and overall (data of the four communities lumped together). All results are non-significant
| Community | Brightness | Chroma | Hue | Colour composition |
|---|---|---|---|---|
| CA | −0.089 | 0.096 | 0.199 | 0.158 |
| CO | −0.002 | −0.031 | 0.015 | −0.080 |
| GA | −0.025 | 0.115 | −0.082 | −0.038 |
| PA | −0.103 | −0.063 | −0.035 | 0.051 |
| Overall | 0.021 | −0.023 | 0.019 | 0.006 |
| Community | Brightness | Chroma | Hue | Colour composition |
|---|---|---|---|---|
| CA | −0.089 | 0.096 | 0.199 | 0.158 |
| CO | −0.002 | −0.031 | 0.015 | −0.080 |
| GA | −0.025 | 0.115 | −0.082 | −0.038 |
| PA | −0.103 | −0.063 | −0.035 | 0.051 |
| Overall | 0.021 | −0.023 | 0.019 | 0.006 |
Overall, bees were associated with purple flowers and ants with UV–yellow and green flowers. Wasps and dipterans were mostly associated with UV–yellow flowers. Coleopterans were associated with white and yellow flowers and lepidopterans with pink flowers (Table 4, Fig. 2).
| Community | Bees | Ants | Wasps | Coleopterans | Dipterans | Lepidopterans |
|---|---|---|---|---|---|---|
| CA |
|
| UV–yellow |
|
|
|
| CO | Purple |
| Yellow |
|
|
|
| GA |
|
| Purple |
|
| Pink |
| PA |
|
| White | Pink |
| Pink |
| Overall | Purple |
| UV–yellow |
| UV–yellow | Pink |
| Community | Bees | Ants | Wasps | Coleopterans | Dipterans | Lepidopterans |
|---|---|---|---|---|---|---|
| CA |
|
| UV–yellow |
|
|
|
| CO | Purple |
| Yellow |
|
|
|
| GA |
|
| Purple |
|
| Pink |
| PA |
|
| White | Pink |
| Pink |
| Overall | Purple |
| UV–yellow |
| UV–yellow | Pink |
| Community | Bees | Ants | Wasps | Coleopterans | Dipterans | Lepidopterans |
|---|---|---|---|---|---|---|
| CA |
|
| UV–yellow |
|
|
|
| CO | Purple |
| Yellow |
|
|
|
| GA |
|
| Purple |
|
| Pink |
| PA |
|
| White | Pink |
| Pink |
| Overall | Purple |
| UV–yellow |
| UV–yellow | Pink |
| Community | Bees | Ants | Wasps | Coleopterans | Dipterans | Lepidopterans |
|---|---|---|---|---|---|---|
| CA |
|
| UV–yellow |
|
|
|
| CO | Purple |
| Yellow |
|
|
|
| GA |
|
| Purple |
|
| Pink |
| PA |
|
| White | Pink |
| Pink |
| Overall | Purple |
| UV–yellow |
| UV–yellow | Pink |
Relationship between flower colour and pollinator assemblages
Results from the partial Mantel test showed no significant association between flower colour and pollinator assemblages (Table 4). Plants with similar colour descriptors, including colour composition, did not attract similar pollinator assemblages in any of the communities, and similar results were obtained when data from the four communities were lumped together.
DISCUSSION
We traced the phylogenetic signal of floral colour under a neutral evolution model (Brownian motion). In this model, changes occur slowly and gradually along phylogenetic branches, and character similarity between species is related to phylogenetic proximity (Blomberg et al., 2003). Phylogenetic signal for flower colour was mostly lacking when we analysed the four communities separately, but when all species were lumped together all colour properties measured showed significant phylogenetic signal (related species were more similar in colour than expected from a random association between species and colours). Notwithstanding this influence of phylogeny on flower colour, the fact that all K values were <1 indicates that similarity among related species tends to be lower than expected under Brownian motion. Most previous studies have found lack of phylogenetic signal in flower colour (Smith et al., 2008; Arnold et al., 2009; McEwen and Vamosi, 2010). However, one recent study on four Himalayan plant communities (Shrestha et al., 2014) obtained results similar to ours (significant phylogenetic signal with K values <1). A corollary of our phylogenetic analysis is that the different colour categories considered are widely spread across the phylogenetic tree. This outcome is in agreement with reports showing important changes in flower colour as a result of relatively simple genetic changes (Rausher, 2008).
We analysed the colour preferences of the pollinator groups present in our communities. Results of the CCAs showed notable coincidences among communities and provided compelling evidence for the association between pollinator groups and certain colours. These associations were less clear in the communities with lower numbers of plant species, but were very apparent when the results of all 109 populations were lumped together (Fig. 2). Importantly, these associations are notably congruent with innate colour preferences found for specific pollinators (Lunau and Maier, 1995; Willmer, 2011). For example, inexperienced Eristalis tenax hoverflies were found to land only on artificial flowers with yellow stimuli in the range of 520–600 nm (Lunau and Maier, 1995). Naive honey bees showed preference for stimuli reflecting between 410 and 530 nm (Giurfa et al., 1995), and bumblebees preferred artificial flowers reflecting in one or two of the three colour bands corresponding to their photoreceptor types (ultraviolet, blue, green) (Lunau, 1992). Papilio demoleus butterflies selected blue, green and red colours while neglecting yellow (Ilse and Vaidya, 1956) and Pieris brassicae preferred artificial flowers reflecting at 450 and 600 nm (Scherer and Kolb, 1987). The hawkmoth Macroglossum stellatarum was shown to have a strong preference for wavelengths around 440 nm and a weaker preference for wavelengths of 540 nm (Kelber, 1997; Telles et al., 2014).
Importantly, the above-mentioned pollinator–colour associations found in our study are consistent with colour preferences described in pollination syndromes, according to which bees favour blue, flies yellow and white, lepidopterans pink and red, coleopterans white and cream, and wasps brown and yellow flowers (Faegri and Van der Pijl, 1979; Willmer, 2011). Waser et al. (1996) explored the association between pollinator groups and bands of the colour spectrum in a natural community in Germany. Their results narrowly failed significance, but the observed trends were also consistent with associations predicted by pollination syndromes. Other community studies using more subjective (human-perceived) colour measures also found associations that were more or less consistent with pollination syndromes (McCall and Primack, 1992; Wolfe and Sowell, 2006; Lázaro et al., 2008).
However, our results cannot be interpreted as supporting pollination syndrome theory because flowers with similar colours did not attract similar pollinators (Table 3). That is, pollinator preferences are a necessary but not sufficient condition for the establishment of colour-based pollination syndromes. The lack of relationship between flower colour and pollinator composition can be explained by the influence of other traits, or trait combinations, on flower choices. Some studies have found phenology (Herrera, 1988), pollen/nectar rewards (Bosch et al., 1997) or corolla depth (Stang et al., 2007) to be the main drivers of pollinator partitioning in flower communities. A second factor contributing to the lack of relationship between flower colour and pollinator composition is pollinator generalization. As in most temperate systems (Herrera, 1996; Waser et al., 1996), the majority of plant species in our study are pollinator generalists (with two or more pollinator groups each accounting for >10 % of the observed visits), and therefore cannot be readily assigned to a given pollination syndrome. Even then, we could have found a correspondence between certain flower colours and pollinator assemblages (rather than single pollinator groups), but this was clearly not the case.
Our results are in agreement with the findings of Rezende et al. (2007), who found that plant–pollinator networks are more strongly associated with animal than with plant phylogeny. That is, related animal species are more likely to share host plants than related plant species are to share pollinator visitors. This result is attributed to pollinator mobility (Bascompte and Jordano, 2007), which allows pollinators to play a more active role in the definition of interaction identity.
Recently, Renoult et al. (2014) have used a novel approach to analyse the association between flower colour and generalization in pollinators. They argue that pollinators should preferentially visit flowers that are most conspicuous to them, and that colour perception should be analysed as a measure of colour conspicuousness between emitters (flowers) and receivers (insects). They measure flower and background colour, and use evidence from various sources to assign one of 11 described visual systems to each pollinator species. Then they calculate ‘colour matching’ for each plant–pollinator pair as a measure of how a floral colour stands out from the environment for each visual system. They find that colour matching influences generalization in one of three regions studied. However, they also find that other factors (spatiotemporal overlap and co-abundance between plants and pollinators) play a greater role as determinants of plant generalization. The results of Renoult et al. (2014) in general, and the strong influence of these other factors in particular, support our conclusion that even though pollinator colour preferences seem to be conditioning plant–pollinator interactions, the selective force behind these preferences may not be strong enough to mediate the appearance and maintenance of tight colour-based plant–pollinator associations.
ACKNOWLEDGEMENTS
Many people (including A. Bonet, A. Rodrigo, S. Osorio, H. Barril-Graells, C. Primante, A. Martín González and V. Flo) helped during pollinator surveys. We are also grateful to C. Hernández-Castellano, M. Escolà, A. Torné-Noguera, R. Molowny-Horas, G. Bagaria and M. Galbany-Casals for their assistance during different phases of the study. We also thank two anonymous reviewers for their valuable comments. This study was supported by the Spanish MICINN, projects CICYT CGL2005-00491, CICYT CGL2009-12646, MICINN CGL2012-34736, Junta de Andalucía P11-RNM-7676 and CONSOLIDER CSD2008-0040.
LITERATURE CITED
