


Abstract
A recent method used to test for local adaptation is a common garden experiment where analyses are calibrated to the environmental conditions of the garden. In this study the calibrated common garden approach is used to test for patterns of adaptation to climate in accessions of Arabidopsis thaliana .
Seedlings from 21 accessions of A. thaliana were planted outdoors in College Park, MD, USA, and development was monitored during the course of a growing season. ANOVA and multiple regression analysis were used to determine if development traits were significant predictors of plant success. Previously published data relating to accessional differences in genetic and physiological characters were also examined. Historical records of climate were used to evaluate whether properties of the site of origin of an accession affected the fitness of plants in a novel environment.
By calibrating the analysis to the climatic conditions of the common garden site, performance differences were detected among the accessions consistent with a pattern of adaptation to latitude and climatic conditions. Relatively higher accession fitness was predicted by a latitude and climatic history similar to that of College Park in April and May during the main growth period of this experiment. The climatic histories of the accessions were better predictors of performance than many of the life-history and growth measures taken during the experiment.
It is concluded that the calibrated common garden experiment can detect local adaptation and guide subsequent reciprocal transplant experiments.
INTRODUCTION
The adaptive differentiation of plant populations in response to differing climates is considered to be a major factor in the generation of plant diversity. It would be particularly interesting to understand the evolutionary processes underlying such population differentiation in genetic model organisms. For many model organisms, such as Arabidopsis thaliana , collections have been made from many different populations worldwide, creating an easily accessed source of potentially diversified genotypes. When combined with the extensive knowledge base available for model organisms, study of such a collection of population samples would appear to be ideal for the identification of specific genetic and developmental changes underlying local adaptation ( Cushman and Bohnert, 2000 ; Kuittinen et al. , 2002 ; Koorneef et al. , 2004 ; Mitchell-Olds and Schmitt, 2006 ). In the case of A. thaliana , its model organism status has also encouraged historical biogeographic research on both the species and genus Arabidopsis , which is useful for identifying environmental factors as selective agents for adaptive differentiation ( Hoffmann, 2002 , 2005 ; Hoffmann et al. , 2005 ).
One of the most successful methodologies for detecting the signature of adaptive differentiation in extant populations has been the reciprocal transplant experiment. In a reciprocal transplant experiment, a genotype is grown in both its home and a foreign environment alongside a counterpart genotype derived from the foreign environment ( Clausen et al. , 1940 ; Antonovics and Bradshaw, 1970 ; Snaydon, 1970 ; Davies and Snaydon, 1976 ; Schemske, 1984 ; Niewiarowski and Roosenburg, 1993 ; Bernardo, 1994 ; reviewed in Primack and Kang, 1989 ; Linhart and Grant, 1996 ; Schmitt, 1999 ). Reciprocal transplant experiments offer the power of direct comparisons of performance in ‘home’ and ‘away’ conditions, with superior fitness of all genotypes in their home conditions being consistent with local adaptation. Reciprocal transplants require experimentation at multiple localities and often require large sample sizes and extensive replication to detect statistically significant effects. However, as far as is known there has been only a single study in a model organism utilizing the reciprocal transplant approach to test hypotheses of local adaptation. The study by Callahan and Pigliucci (2002) used A. thaliana. Even in this study, the investigators were limited to transplanting within North America, where A. thaliana has only recently been introduced. Thus, studies of adaptation by model organisms to local environmental conditions within their native distribution, where most of the evolutionary history lies, is often beyond the abilities of the investigator.
A novel alternative to reciprocal transplant experiments has been applied recently by Montalvo and Ellstrand (2000) . Their method involves growing diverse ecotypes in a single common garden and accounting for environmental differences between the common garden site and the site of origin of the ecotypes. Hypotheses about relative performances of the ecotypes are then calibrated to the degree of environmental difference between the home site and the common garden site. Hereafter, this type of experiment is described as a calibrated common garden experiment.
The results of a study in A. thaliana are reported in which the calibrated common garden experiment has been used to test the hypothesis that populations of A. thaliana have locally adapted to their climatic conditions. A common garden approach is used, but also the climate conditions of the test site are used as a calibration point. A clinal pattern in fitness is tested for, based upon deviation from the climate conditions of the test site. In the present analysis, calibration is to individual climatic variables and also multivariate methods are used to analyse several climatic variables simultaneously to account for the high correlation among these variables. The focus is on adaptation to climatic variables for several reasons. First, the expansion of A. thaliana from glacial refugia into heterogeneous environments throughout Europe and central Asia is likely to have imposed selection to local environmental conditions resulting in population differentiation ( Sharbel et al. , 2000 ; Schmuths et al. , 2004 ; Hoffmann, 2005 ). Secondly, it is not easy to control or test for adaptation to important biotic interactions that may be occurring at the accessions' home sites in a single common garden. Furthermore, calibrating to climatic conditions may allow the interaction of prior adaptation to later environmental changes, such as those expected from global climate change patterns, to be estimated. Finally, it is suspected that adaptation to climatic variables has been sufficiently strong that the present analyses of the calibrated climatic data will be robust to variation due to other uncalibrated factors, such as life history variation among accessions.
It is hypothesized that A. thaliana populations have adapted to their local climatic conditions and genotypes that performed best in the test site would be those from populations with historic climatic conditions most similar to those that occurred during the experiment at the test site in Maryland, USA. Rather than examining specific differences in phenology and life history between ecotypes, which may reflect both historical adapatation and complex interactions with photoperiod and temperature, this study focuses on total fitness differences between ecotypes. To test for an overall effect of historical adaptation on performance the experiment was carried out in a common garden. The contribution of phenology and life history differences to variation in total fitness can then be evaluated in subsequent studies.
MATERIALS AND METHODS
Seed sources
Arabidopsis thaliana seeds were collected from three Norwegian populations located in ( a ) Storesand, Hvaler, ( b ) Skatval, Stjørdal and ( c ) Ørnes, Meløy ( Stenøien et al. , 2002 ). Seed from one population in Gronsvik (Northern Sweden) was collected by J. Agren. The remaining accessions used in these experiments were provided by the Arabidopsis Biological Resource Center (ABRC), and location information is given in the Appendix. Seeds were stored in refrigerated conditions until the beginning of the experiment. Although this method of obtaining seed made work with accessions with a wide range of geographic origins possible, it also meant that there may be differences between seed age among ecotypes as described below in the Discussion. The geographic distribution of the accessions is illustrated in Fig. 1 .
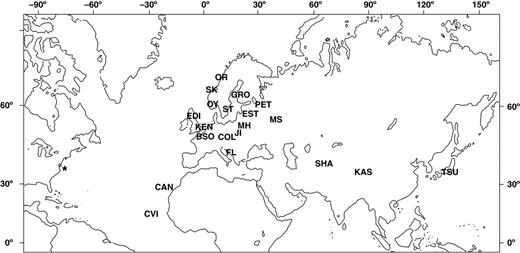
Geographic distribution of collection sites for the A. thaliana accessions used in this study. Latitude and longitude data are from ABRC or from accession collectors. Abbreviations: Canary Isands, CAN; Columbia and Landsberg, COL; Cape Verde Islands, CVI; Edinburgh, EDI; Estland, EST; Kashmir, KAS; Moscow, MS; Oystese, OY; Petergof, PET; Muhlen, MH; Pamiro-Alay, SHA; Tsu, TSU; Vranov u Brna, JI; Florence, FL; Kent, KEN; Bretagny Sur Orge, BSO; Gronsvik, GRO; Ørnes, OR; Storesand, ST; Skatval, SK. College Park, Maryland is marked with an asterisk.
Germination and field planting
Forty seeds from each of the 21 accessions were sown into moist germination soil (Sunshine # 3) in 2·5-inch (6·4-mm) square pots (ten seeds in each of four pots per accession). Pots were randomly distributed across three flats, and flats were placed in an unlit growth chamber at 4 °C for 10 d. After removal from the growth chamber, the flats were mist watered for 15 d until most plants had two true leaves. Germination of all ecotypes was high (>80 %), and 18 seedlings from each of the 21 ecotypes were randomly chosen for planting in the field.
Seedlings were planted in April 2002 in a common garden adjacent to the glasshouses of the University of Maryland. April corresponds to the time when wild A. thaliana grows rapidly and begins to bolt in the College Park vicinity. Since the scope of the present study was restricted to quantifying adaptation of A. thaliana to climatic conditions and did not include measuring adaptation to biotic conditions, the effects of above-ground interactions were removed by laying a plastic landscape cloth over the site to minimize the growth of weeds. The landscape cloth was permeable to air and water, although it may have altered soil moisture conditions. The plot was fenced to exclude mammalian herbivores. Seedlings were planted in holes in the landscape cloth 50 cm apart, in 18 spatial blocks. Each accession was represented in each block, and the position of the accessions within each block was randomized. The plants were watered the first week after planting to reduce transplant shock. Approximately 4 % of plants died within 1–2 d of transplant. These plants were replaced with replicate plants from the same ecotype when possible. After the 1-week watering period, the plants experienced natural climatic conditions and were not replaced if they died.
The number of rosette leaves at the time of bolting, the date of emergence of the bolting stem, the date of first flowering and the date of complete senescence of the plant were noted. If a plant did not bolt, the rosette leaf number was measured at the time of senescence. All plants had senesced by 1 July, at which point the plants were harvested. The total number of fruit produced by each plant was counted. Fruit number is highly correlated with seed production in A. thaliana ( Westerman and Lawrence, 1970 ; Mauricio et al. , 1997 ).
Analysis
To determine if specific traits contributed to accession performance in the present study, ANOVA was used to evaluate whether accessions varied in their rosette leaf number, their timing of bolting, flowering and senescence date or their total fruit production. A multiple regression of rosette leaf number at bolting, bolting time, flowering time, and days to senescence on fitness (fruit production) was performed to evaluate whether any of these traits were significant predictors of plant success. All accessions were used in the analysis, except for two accessions that did not bolt or flower.
Because of its status as a model organism, relatively more information is known about the genetic and physiological mechanisms that might underlie adaptive differentiation in A. thaliana . Thus previously published data on accessional differences in δC 13 , a physiological parameter known to predict water use efficiency and thus adaptation to drought stress, was utilized. Also advantage was taken of sequence data that quantifies the presence or absence of a functional FRIGIDA or FLOWERING LOCUS C ( FLC ) allele, known to influence flowering time. In a separate analysis, an evaluation was carried out to determine if the presence of a functional FRIGIDA or FLC allele was a predictor of accession performance. Fourteen of the accessions in the present study had been quantified previously for δC 13 values ( McKay et al. , 2003 ), and 13 accessions from the present study that had been genotyped for either the FRIGIDA or FLC loci as reported by Werner et al. (2005) . Because the measurements represent the means across a number of individuals within each ecotype (δC 13 values were not measured for each replicate in the present experiment), the conservative approach of analysing the relationship by regressing mean δC 13 value for each accession on its mean fitness in College Park was taken. A t -test was used to determine if fitnesses differed between accessions with functional loci and those with nonfunctional loci, with sample size reflecting number of accessions and not number of individuals within accessions.
To evaluate whether properties of the site of origin of an accession affected its fitness in the novel environment of Maryland, historical climate data for the collection sites of the accessions were obtained. Latitude and longitude for all of the accessions were obtained (Fig. 1 and the Appendix). Columbia and Landsberg were considered to have the same site of origin, as ABRC lists Columbia as having been founded from a Landsberg line, making the present test of adaptation more conservative as these two lines may have diverged since founding. For each site, average climatic data for April–June were obtained using a global climate dataset developed by New et al. (2002) . This dataset extrapolates data from weather stations from 1961–1990 to create a grid of weather information subdivided by calendar month with 10′ latitude/longitude resolution. For each site, the weather information from the grid point closest to the historical site of origin of the accession was used. Populations were sufficiently distant that no two populations shared a reference grid point.
The present study focused on three major components of climate that have been associated with variation in Arabidopsis performance ( Millar, 1999 ; Meyre et al. , 2001 ; McKay et al. , 2003 ; Stinchcombe et al. , 2004 ): mean temperature, mean precipitation and diurnal temperature range (DTR). The dataset of New et al. (2002) contains several other climatic variables (relative humidity, hours of sunlight, number of rainy days per month, etc.). For the locations used in the present study, each of these other variables was highly correlated with one or more of mean temperature, mean precipitation and DTR. Thus the present analyses were restricted to these three climate components. To establish a reference point for calibration purposes, the mean temperature, precipitation and diurnal temperature range for the planting site in College Park, MD were estimated for April–June 2002 by using weather data collected at the weather station at Ronald Reagan Washington National Airport near Washington, DC, 17 km south-west of College Park. For Maryland, the actual data from the experimental period were used rather than data from the global climate dataset because the actual data represent the challenge faced by the experimental plants. The data obtained from the global climate dataset is used as a proxy for the historical conditions that may have led to adaptive changes. The historical conditions in Maryland are not relevant as no genotypes are included from populations that have recently established in Maryland.
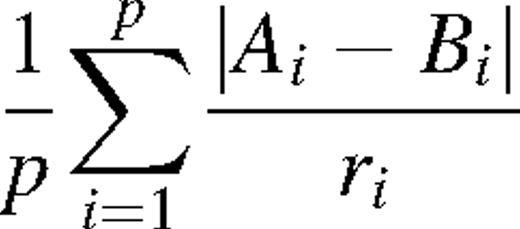
The present analyses focused on the differences between the climate at the site of origin and the climate in College Park in 2002. The absolute value of the difference between the College Park value and the accession site origin value were calculated for all of the climatic variables for April, May and June, as well as for latitude. These differences were used as the predictors of accession success in Maryland, and are what are later referred to as ‘calibrated climatic variables’. The raw climatic data are referred to as ‘uncalibrated climatic variables’. We reason that plants that originate from conditions that differ considerably from those of Maryland will have lower fitness than plants that originate from conditions similar to Maryland. The response variable was the mean fruit production (square-root transformed) of each ecotype across the entire common garden. Although transformation of a fitness variable for statistical purposes is inappropriate for analyses that make quantitative predictions about expected changes in gene frequency (such as analyses used to estimate selection gradients) or compare fitness across environments ( Lande and Arnold, 1983 ; Stanton and Thiede, 2005 ), transformation to address non-normally distributed residuals is appropriate in a study such as the present one where the goal is simply to assess relative performance among ecotypic accessions in a single environment and make qualitative statements about the relationship of climatic variables and performance. To determine which of the variables are important predictors of fruit production, a series of individual regressions of characteristics of the home site were performed on fitness in Maryland ( SAS Institute, 2004 ). In lieu of a multivariate analysis, individual regressions were used because multiple regression approaches would use over-parameterized models. However, multivariate approaches are described below that allowed all factors to be examined simultaneously. In addition to latitude, there were nine climatic predictor variables: the mean temperature, precipitation, and DTR for the months of April, May and June. Note that DTR is a measure of temperature variability, and the calibrated measures of the diurnal temperature ranges thus represent differences between Maryland and other environments in their daily climatic variability. A sequential Bonferroni correction was conducted within each set of ten regressions.
RESULTS
Trait variation among ecotypes
Detailed information about accession characteristics and fitness can be found in the Appendix. Accessions planted in an outdoor common garden in College Park, MD varied significantly in all characters measured, including fruit production (Table 1 ). Thus there is genetic variation between these ecotypes sufficient to generate phenotypic variation in morphological, life history and fitness characters in the common garden.
Accession identity as a predictor of Arabidopsis thaliana trait values measured in a common garden
| Trait | d.f. | F -value | P |
|---|---|---|---|
| Rosette leaf number at bolting | 20 | 12·45 | <0·0001 |
| Bolting date | 19 | 101·30 | <0·0001 |
| Flowering date | 19 | 85·03 | <0·0001 |
| Senescence date | 20 | 7·39 | <0·0001 |
| Fruit number | 20 | 5·63 | <0·0001 |
| Trait | d.f. | F -value | P |
|---|---|---|---|
| Rosette leaf number at bolting | 20 | 12·45 | <0·0001 |
| Bolting date | 19 | 101·30 | <0·0001 |
| Flowering date | 19 | 85·03 | <0·0001 |
| Senescence date | 20 | 7·39 | <0·0001 |
| Fruit number | 20 | 5·63 | <0·0001 |
Each trait was analysed separately after removal of the effects of spatial block, and fruit number was square root transformed to meet assumptions of ANOVA. Two of the ecotypes did not bolt in sufficient number to be included in the analyses of bolting date and flowering date.
Of the measured characters, only the date of senescence was a significant predictor of our fitness measure, fruit number (Table 2 ). Plants that lived longer produced more fruit. Individuals of one accession (Skatval, Norway) persisted as rosettes but did not bolt before dying with the onset of summer temperatures. Most individuals of two other accessions (Gronsvik, Sweden and Ørnes, Norway) also did not form bolting stems during the experiment. The accessions with the highest fitness averaged between 200 and 300 fruits per plant. Listing the mean fruit number in parentheses, the five accessions with the highest fitness were: Kent (289), Columbia (214), Moscow (210), Tsu (202) and Kashmir (202). The five accessions with the lowest fitness all had fewer than 80 fruits per plant, and included the three accessions with little or no bolting: Skatval (0), Gronsvik (0), Ørnes (12), Canary Islands (21) and the Cape Verde Islands (72).
Common garden results of Arabidopsis thaliana characters as predictors of total fruit production (square root transformed), for all plants that flowered and after removal of effects of spatial block
| Character | d.f. | Parameter estimate | Standardized estimate | F -value | P |
|---|---|---|---|---|---|
| Rosette leaf number at bolting | 1 | −0·018 | −0·0023 | 0·10 | 0·76 |
| Bolting date | 1 | 0·029 | 0·0038 | 0·07 | 0·79 |
| Flowering date | 1 | −0·109 | −0·0144 | 1·22 | 0·27 |
| Senescence date | 1 | 0·137 | 0·0181 | 20·19 | <0·0001 |
| Error | 339 |
Effect of climate history on performance in Maryland
Differences between the climate in Maryland in 2002 and the historic climate of the accessions' sites of origin proved to be significant predictors of accession performance in Maryland (Tables 3 and 4 ). A greater absolute difference in latitude, April DTR and May DTR between the home site and Maryland resulted in lower fruit production in Maryland. Because most of the growth, the initiation of reproduction and the production of the majority of the bolting stem occurred in April and May, environmental conditions in this time period may be of particular importance to plant success. In the uncalibrated model, there was a direct relationship between April diurnal temperature range and fruit production (Table 3 , April DTR effect), suggesting that plants with broad temperature tolerances during early growth were most successful in the Maryland planting. The April diurnal temperature range was the only significant predictive climatic effect in the model with uncalibrated climatic variables.
Test of Arabidopsis thaliana populations to local abiotic conditions as measured in a calibrated common garden experiment
| Site-of-origin factor | Parameter estimate | F -value | P |
|---|---|---|---|
| Calibrated latitude | −0·319 | 6·99 | 0·0160* |
| Calibrated April temperature | −0·139 | 0·39 | 0·54 |
| Calibrated May temperature | −0·150 | 0·39 | 0·54 |
| Calibrated June temperature | −0·084 | 0·13 | 0·72 |
| Calibrated April precipitation | −0·012 | 0·04 | 0·85 |
| Calibrated May precipitation | −0·012 | 0·10 | 0·76 |
| Calibrated June precipitation | 0·009 | 0·11 | 0·74 |
| Calibrated April DTR | −1·614 | 7·85 | 0·0114* |
| Calibrated May DTR | −1·528 | 6·66 | 0·0183* |
| Calibrated June DTR | −1·085 | 3·32 | 0·08 |
| Latitude | −0·072 | 0·75 | 0·40 |
| April temperature | 0·043 | 0·06 | 0·80 |
| May temperature | 0·056 | 0·09 | 0·77 |
| June temperature | 0·052 | 0·07 | 0·80 |
| April precipitation | −0·004 | 0·02 | 0·89 |
| May precipitation | −0·007 | 0·07 | 0·80 |
| June precipitation | 0·010 | 0·29 | 0·60 |
| April DTR | 1·238 | 6·1 | 0·0233* |
| May DTR | 0·949 | 4·25 | 0·0531 |
| June DTR | 0·660 | 2·16 | 0·16 |
| Gower's environmental distance | −2·771 | 6·15 | 0·0227* |
This table presents the regression of accession site-of-origin characteristics on the square root of total fruit production, including all plants and after removal of the effects of spatial block.
Regression on each factor was performed independently. The regression of Gower's environmental distance statistic is presented at the bottom. All models had 20 degrees of freedom.
DTR, Daily temperature range.
*Values are significant after sequential Bonferroni correction.
The first two principal components of latitude and climatic variables for the sites of origin of the Arabidopsis thaliana accessions: (A) loadings using uncalibrated climatic data; (B) loadings using calibrated climatic data
| PC 1 | PC 2 | |
|---|---|---|
| (A) Uncalibrated climatic data | ||
| Latitude | −0·33508 | 0·10387 |
| April temperature | 0·4422996 | 0·259163 |
| May temperature | 0·432090 | −0·224204 |
| June temperature | 0·421939 | −0·182346 |
| April precipitation | −0·310449 | −0·258991 |
| May precipitation | −0·335544 | −0·223903 |
| June precipitation | −0·315465 | −0·214989 |
| April DTR | 0·029086 | 0·435281 |
| May DTR | 0·063648 | 0·488185 |
| June DTR | 0·113446 | 0·497298 |
| (B) Calibrated climatic data | ||
| Latitude difference | −0·133560 | 0·389558 |
| April temperature difference | −0·366394 | 0·306957 |
| May temperature difference | −0·329747 | 0·325338 |
| June temperature difference | −0·379463 | 0·240226 |
| April precipitation difference | 0·334009 | 0·092603 |
| May precipitation difference | 0·377745 | 0·097140 |
| June precipitation difference | 0·411995 | 0·029593 |
| April DTR difference | 0·097649 | 0·426165 |
| May DTR difference | 0·229438 | 0·483063 |
| June DTR difference | 0·330183 | 0·395745 |
DTR, Daily temperature range.
Two multivariate indicators of environmental differences between Maryland and the historic home site were also consistent with the hypothesis that plant fitness was highest when historical conditions were similar to experimental conditions. There was a significant negative relationship between Gower's environmental distance metric and fruit production in Maryland (Table 3 ; P < 0·0071). The principal component analysis using the uncalibrated climatic data detected no significant effect of the first two principal components. However, a principal component analysis with the calibrated climatic data found a negative relationship between the second principal component and fruit production (Table 5 ). All calibrated climatic variables contributed a positive loading to the second principal component (Table 4 ), suggesting that the second principal component was a general index of environmental difference between Maryland and an accession's historical climate. The first principal component, which represented a trade-off between temperature differences and a combination of precipitation and diurnal temperature ranges, was not a significant predictor of fruit production.
Regression of the first two principal components (reported in Table 4 ) on the square root of total fruit production: (A) regression results using the principal components derived from uncalibrated climatic data; (B) regression results using the principal components derived from calibrated climatic data
| Principal component | Parameter value | F -value | P |
|---|---|---|---|
| (A) Uncalibrated climatic data | |||
| 1 | 0·003 | 0·00 | 0·96 |
| 2 | −0·010 | 0·01 | 0·92 |
| (B) Calibrated climatic data | |||
| 1 | 0·035 | 1·22 | 0·28 |
| 2 | −0·353 | 5·99 | 0·0249 |
| Principal component | Parameter value | F -value | P |
|---|---|---|---|
| (A) Uncalibrated climatic data | |||
| 1 | 0·003 | 0·00 | 0·96 |
| 2 | −0·010 | 0·01 | 0·92 |
| (B) Calibrated climatic data | |||
| 1 | 0·035 | 1·22 | 0·28 |
| 2 | −0·353 | 5·99 | 0·0249 |
On average, the three Scandinavian accessions that did not bolt or rarely bolted had greater differences in latitude, temperature and diurnal temperature range than the average accession in the present sample. In addition, these three accessions had a higher value of Gower's environmental distance metric than the average accession in the present sample. It is worth noting that two Scandinavian populations did bolt and fruit: Storesand (collected by Stenøien and Fenster) and Oystese (obtained from ABRC). In natural populations of Arabidopsis thaliana , wild plants do flower and fruit during the months in which this experiment occurred. In northern Sweden and Norway plants flower from mid-May to early June and fruit by late June. In southern Norway plants flower in mid-May and fruit by mid-June. The two accessions that are derived from the same population (Landsberg and Columbia) did not differ significantly in their mean fruit production ( P = 0·20).
A direct effect of mean δC 13 values was not detected to be a significant predictor of mean fruit production levels. Furthermore, a significant difference was not found between fitness of accessions with functional FRIGIDA or FLC alleles and those without functional alleles ( P = 0·20).
DISCUSSION
A number of studies have demonstrated adaptive differentiation to climate among A. thaliana ecotypes. For example, a glasshouse study demonstrated a latitudinal cline for hypocotyl responses to red and far-red light ( Stenøien et al. , 2002 , 2005 ). Another glasshouse study indicated that historical temperature conditions predicted phenological responses to temperature ( Hoffmann et al. , 2005 ). Field studies have indicated that, for genotypes with a functional FRIGIDA locus, there was a significant latitudinal cline in A. thaliana flowering time as measured in a common garden experiment in Rhode Island ( Stinchcombe et al. , 2004 ). Additionally, δC 13 has been found to be genetically correlated to flowering time in a glasshouse study of natural accessions of A. thaliana , and variation in δC 13 may also reflect adaptive differentiation to drought escape ( McKay et al. , 2003 ).
In the present study, there was significant genetic variation among the ecotypes for fitness (via fruit production) and for all of the traits measured when tested in a common garden plot in Maryland. An important question in interpreting these data is whether this variation reflects adaptive differentiation to the home environments ( Endler, 1986 ). In the calibrated model, it was found that latitude and both April and May DTR were significant predictors of fitness. In the uncalibrated model only April DTR significantly predicted fruit production. The similarity between the two models in finding a significant April DTR effect is likely to result from the DTR of College Park in 2002, having been near the extreme high end for the historical site values used in the present dataset. Thus, nearly all deviations from our calibration point were in the same direction, rendering the calibrated and uncalibrated models equivalent for the analysis of April DTR.
The two multivariate approaches used to summarize the climatic data both support the idea that calibration to local conditions is important. Gower's environmental distance metric summarizes and scales the differences between two sites, and the metric was significantly negatively related with fitness. A principal component approach only successfully predicted fitness when the principal components were computed from climatic differences from Maryland, and not when computed from the raw climatic data. Furthermore, the predictive principal component uniformly loaded climatic differences in the same direction, loaded most heavily for the April and May diurnal temperature range, and indicated a negative relationship between the principal component and fitness.
The A. thaliana seedlings used in the present experiment were transplanted into the field, and most ecotypes had commenced flowering by the end of May. Therefore it seems likely that April and May were the most critical months for vegetative growth and subsequent reproduction for the plants in the present experiment. Although the present analyses have been calibrated to climate, they are not calibrated to the timing of life history. For example, plants in the present experiment went through rapid growth in May, but in their home environments the period of rapid growth is likely to span from April to June, depending on latitude and altitude ( Li et al. , 1998 ; Weinig et al. , 2002 ). The month of May overlaps with an important period in Arabidopsis growth in populations worldwide ( Hoffmann, 2002 , 2005 ). In addition, because of the correlation of climatic variables from month to month, May climatic conditions are correlated with both April and June conditions. Unfortunately, information about the timing of flowering and fruiting for the accessions in natural populations is not readily available. Such data would have allowed further calibration of the analyses by comparing climatic conditions with those at the home site in the months when the plants would have been at the same developmental stage.
Differences in life history may also be reflected in differences in flowering time among the accessions. In Arabidopsis thaliana , variation at the FRIGIDA and FLC loci has been identified as a principal source of this variation in flowering time ( Caicedo et al. , 2004 ; Stinchcombe et al. , 2004 , 2005 ; Shindo et al. , 2005 ). Of the 13 accessions in the present study that have been genotyped for the FRIGIDA or FLC loci, there was not a significant difference in fitness between accessions. The three Scandinavian accessions with little or no bolting have not been genotyped at these loci. The low fitness of these accessions in the Maryland climate may reflect historical adaptation at these or other loci to climatic conditions very different from that of Maryland. These accessions may have alleles at FRIGIDA or other loci that lead to the plants requiring an overwintering or vernalization period, explaining their poor performance in the spring conditions in Maryland. Vernalization treatments have been demonstrated to alter fruit production even in ecotypes lacking FRIGIDA alleles (e.g. Callahan et al. , 2005 ), suggesting that fitness differences between accessions are environmentally dependent and shaped by historical adaptation at important loci. In other words, interactions at two levels, among loci (epistasis) and between loci and environment (G×E) may obscure any direct relationship between the presence and absence of particular alleles at these loci with fitness. In addition, pleiotropic effects of flowering time mutations on drought tolerance and δC 13 ( McKay et al. , 2003 ) may have weakened any correlation between fitness and δC 13 .
There were also novel components of the experimental environment that differed from the historical A. thaliana environment that do not easily lend themselves to calibration. For example, the seeds used in the experiment were stored in refrigerated conditions. In the case of the stock centre seeds, seeds may have been stored for long periods of time or have been propagated through a few generations in the glasshouse. In the wild conditions, plants frequently overwinter as seedlings or rosettes in moist and cold conditions.
We are aware of one other field study testing for local adaptation with a calibration approach. Montalvo and Ellstrand (2000) calibrated a common garden experiment with Lotus scoparius , with similar results to the present study, in which a general measure of environmental distance was inversely related with plant fitness. Between the calibrated and uncalibrated analyses, we believe we have evidence consistent with local adaptation to diurnal temperature regimes. Many of the patterns observed in terms of climatic differences between the home site and Maryland and the performance of the accessions reflected the poor performance of A. thaliana populations collected from Scandinavia relative to the other accessions. The poor performance of the Scandinavian accessions suggests that that the post-glaciation expansion of A. thaliana from southern to northern Europe has been accompanied by adaptive differentiation to climatic variables that also change along this latitudinal gradient. We suggest that further studies should include more collections from northern populations to examine climatic adaptation in populations at the colder extremes of the range of Arabidopsis thaliana .
ACKNOWLEDGEMENTS
We thank D. Carr, R. Reynolds, J. Conner and members of the Conner laboratory for discussion and suggestions, and D. Erickson for help with field work and comments on the manuscript. Two anonymous reviewers provided additional valuable comments on the manuscript. This work was supported by a National Science Foundation Training Grant in Small Population Biology to the University of Maryland and a grant to C. Fenster and M. Rutter from the National Science Foundation (DEB-0316972).
LITERATURE CITED
APPENDIX
The name and abbreviation of all Arabidopsis thaliana ecotypes or accessions used in this experiment are listed, together with the latitude and longitude of the site from which they were collected, mean fruit number in the common garden experiment, and whether functional FRIGIDA and FLC loci are present. All information was directly obtained by the authors, provided by ABRC, or taken from Werner et al. (2005) .
| Ecotype | Abbreviation | Latitude | Longitude | Mean fruit no. | Functional FRIGIDA and FLC? |
|---|---|---|---|---|---|
| Canary Islands | Can-0 | 28 | –15·5 | 21·1 | Unknown |
| Columbia | Col-2 | 48·11 | 10·52 | 214 | No |
| Cape Verde Islands | Cvi-0 | 16 | –24 | 72·1 | No |
| Edinburgh | Edi-0 | 56 | –3 | 117·8 | Yes |
| Estland | Est | 58·5 | 25·5 | 134·6 | No |
| Kashmir | Kas-1 | 35 | 77 | 201·7 | Yes |
| Moscow | Ms-0 | 55·5 | 38 | 209·4 | Yes |
| Oystese, Norway | Oy-1 | 60·4 | 6·2 | 101·1 | No |
| Petergof, Russia | Petergof | 60 | 30 | 166·8 | Unknown |
| Muhlen, Poland | Mh-0 | 53·5 | 20·5 | 79·6 | No |
| Pamiro-Alay, Tadjikistan | Sha | 37·5 | 65 | 90·4 | No |
| Tsu, Japan | Tsu-1 | 34·5 | 136·3 | 202·4 | No |
| Vranov u Brna, Czech Rep. | Jl-1 | 49·18 | 16·35 | 88·6 | No |
| Florence | PHW-2 | 43·49 | 11·19 | 199·8 | Unknown |
| Kent, UK | PHW-14 | 51·17 | 1·05 | 289·6 | Unknown |
| Landsberg | La-0 | 48·11 | 10·52 | 123·2 | No |
| Bretagny Sur Orge (France) | PHW-35 | 48·63 | 2·3 | 191·2 | No |
| Gronsvik, Sweden | N/A | 63·8 | 20·3 | 0 | Unknown |
| Ørnes, Meløy, Norway | N/A | 66·53 | 13·41 | 0 | Unknown |
| Storesand, Hvaler, Norway | N/A | 59·01 | 11·01 | 12·4 | Unknown |
| Skatval, Sjørdal, Norway | N/A | 63·28 | 10·51 | 159·7 | Unknown |
