


Abstract
Background: Facial aging is a dynamic process involving the aging of soft tissue and bony structures. The shape, size, and volume of the bony orbit have all been shown to change with increasing age.
Objective: In this study, we demonstrate how specific bony aspects of the orbit change with age in both male and female subjects and what impact this may have on the techniques used in facial cosmetic surgery.
Methods: Facial bone computed tomography (CT) scans were obtained from 60 white subjects (30 female, 30 male). Our study population consisted of 10 male and 10 female subjects in each of 3 age categories. Each CT scan underwent three-dimensional (3-D) reconstruction with volume rendering. Orbital aperture width was measured as a line drawn from the posterior lacrimal crest to the frontozygomatic suture. This line was then used as the x-axis from which the distance to the superior and inferior orbital rim at nine equal increments (labeled 10 to 90) was obtained. The orbital aperture area was also measured on each 3-D model. The Student t test was used to identify any trends between age groups.
Results: The orbital aperture width and area in both our male and female subjects showed a significant increase with increasing age. There was a significant increase in height of the superior orbital rim medially in both genders, suggesting that the superior orbital rim receded with age in this region. The inferior orbital rim receded significantly laterally in our female population, while our male subjects had a recession of the entire inferior orbital rim.
Conclusions: These results suggest that the bony elements of the orbit change dramatically with age, and this, coupled with soft tissue changes, can lead to the appearance of the aged eye and orbit.
Facial aging is a dynamic process involving the aging of soft tissue and bony structures. The skin undergoes atrophy with a loss of tone and elasticity. Subcutaneous fat atrophies with a decreased adherence to underlying layers leading to gravitational descent. These factors contribute to orbital hooding, crow's feet, and the sagging appearance of aged facial skin.
The aging process also affects the facial bones. In multiple studies, it has been shown that the bony midface undergoes a process of bony resorption and volume loss with increasing age.1–5
In regards to aging of the bony orbit, Pessa1 analyzed male skulls and found an enlargement in the bony orbit with changes to its curvilinear form with increasing age. The volume of the bony orbit has also been shown to increase with age.6 In this study, we will evaluate how specific bony aspects of the orbit change with age in both men and women and what implications these structural changes may have on the techniques used in facial cosmetic surgery.
Methods
Computed tomography (CT) scans of the orbits and facial bones, at a slice width of 1.25 mm, were obtained from 60 white subjects (30 female, 30 male). Each scan was performed using continuous axial slices with sagittal and coronal reformations. There were 10 male and 10 female subjects in each of three age categories: young (25–44 years), middle (45–64 years), and old (≥ 65 years). Subjects received the CT scans for the following medical reasons: 34 to rule out facial bone fracture, 16 to assess severe sinusitis, and 10 for a soft tissue diagnosis (cellulitis, soft tissue mass, or to rule out an abscess). Only scans negative for fracture and ones that showed no signs of past fracture or bony involvement, in cases of soft tissue disease, were included in this study.
Each CT scan then underwent volume rendering three-dimensional (3-D) reconstruction using the 3-D analysis software Volume Viewer (Voxtool 3.0.64q; General Electric, Barrington, IL). Each model was stabilized in the standard anterior cranial base position of sella nasion (a line from the sella to nasion was parallel to the horizon). Orbital aperture width was then measured as a line from the posterior lacrimal crest to the frontozygomatic suture. This line was then used as the x-axis for subsequent measurements. The height from this line to the superior orbital rim and inferior orbital rim was then taken at nine equal increments along this axis (referred to as x-coordinates 10 to 90; Figure 1). For example, if the orbital aperture width was 40 mm, the distance to the inferior and superior orbital rim was taken along the x-axis at nine 4.0-mm increments. Orbital aperture area was also measured on each 3-D model. The above measurements were all taken from the left orbit for each subject, assuming no significant difference between orbit sizes in the same subject. All measurements were made on a General Electric, Advantage Windows workstation, running version 4.2 software on HP xw8000s. The Student t test (no correction was made for multiple testing) was used to identify any trends between age groups (young vs. middle, middle vs. old, and young vs. old), with P < .05 considered statistically significant. Loess regression curves for orbital aperture area and length were also created to better illustrate the trends found with increasing age.
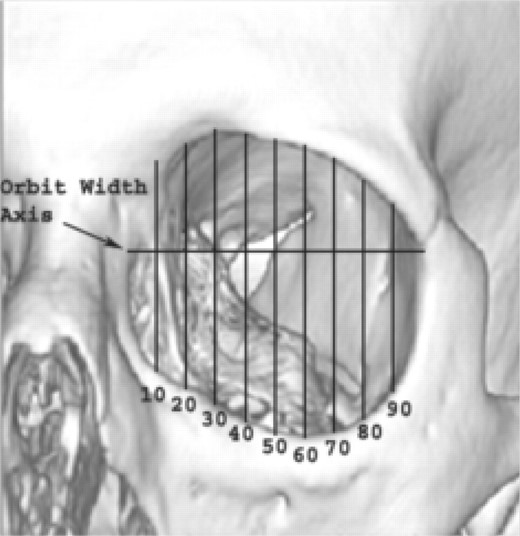
Computed tomography image of the left orbit with measurement grid applied.
Results
The mean age in the young age group was 33.8 years, with a range of 25 to 44 years (SD 5 7.6) for our male subjects and 30.4 years with a range of 25 to 42 years (SD 5 5.3) for our female subjects. The male subjects in our middle age group had a mean age of 57.7 years, with a range of 50 to 64 years (SD 5 4.8), while the female subjects had a mean age of 54.5 years, with a range of 46 to 61 years (SD 5 4.5). The mean age in the old age group was 75.4 years, with a range of 65 to 82 years (SD 5 6.6) for our male subjects and 75 years with a range of 65 to 85 years (SD 5 7.6) for our female subjects (Table 1).
Average age by gender in each age category
| Young | Middle | Old | ||||
| Age | Male | Female | Male | Female | Male | Female |
| Mean | 33.8 | 30.4 | 57.7 | 54.5 | 75.4 | 75 |
| Range | 25–44 | 25–42 | 50–64 | 46–61 | 65–82 | 65–85 |
| SD | 7.6 | 5.3 | 4.8 | 4.5 | 6.6 | 7.6 |
| Young | Middle | Old | ||||
| Age | Male | Female | Male | Female | Male | Female |
| Mean | 33.8 | 30.4 | 57.7 | 54.5 | 75.4 | 75 |
| Range | 25–44 | 25–42 | 50–64 | 46–61 | 65–82 | 65–85 |
| SD | 7.6 | 5.3 | 4.8 | 4.5 | 6.6 | 7.6 |
SD, standard deviation.
Orbital Aperture Width
In both our male and female study populations, the width of the orbital aperture increased with increasing age. The mean orbital aperture width (mm) in our male population was 39 for the young age group, 40.2 for the middle age group, and 40.6 for the old age group. This male population had a statistically significant increase from the young to old age group (t = 2.23; P = .039).
The mean orbital aperture width in our female population was 35.7 for the young age group, 37.7 for the middle age group, and 38.7 for the old age group. Our female population had a statistically significant increase from the young to middle age group (t = 2.79; P =.012; Table 2; Figures 3 and 4).
Mean orbital aperture width and orbital aperture area by gender
| Age category | |||
| Young | Middle | Old | |
| Orbital aperture width [mm (SD)] male | 39.0 (1.3) | 40.2 (2.2) | 40.6 (1.9)a |
| Orbital aperture width [mm (SD)] female | 35.7 (1.7) | 37.7 (1.5)b | 38.7 (1.1) |
| Orbital aperture area [mm2 (SD)] male | 1082.7 (69.9) | 1104.6 (98.9) | 1191.2 (88.1)a |
| Orbital aperture area [mm2 (SD)] female | 945.3 (84.6) | 1047.9 (91.9)b | 1100.1 (87.5) |
Statistically significant difference between the young and old age groups.
Statistically significant difference between the young and middle age groups.
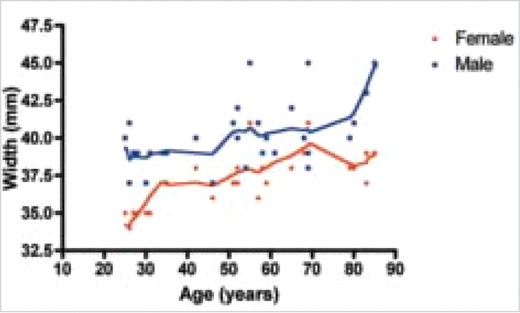
Loess regression curve illustrating the statistically significant increase in orbital aperture width with increasing age for both genders.
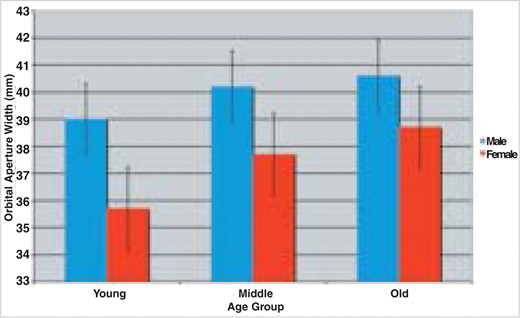
Mean orbital aperture width for both genders. Note the statistically significant increase from the young to middle age groups for male subjects and the statistically significant increase from the middle to old age groups for female subjects.
Orbital Aperture Area
In both our male and female study populations, the area of the orbital aperture increased with increasing age. The mean measurement (mm2) in our male population was 1082.7 for the young age group, 1104.6 for the middle age group, and 1191.2 for the old age group. This male population had a statistically significant increase from the young to old age group (t = 3.05; P = .0069).
The mean measurement in our female population was 945.3 for the young age group, 1047.9 for the middle age group, and 1100.1 for the old age group. Our female population had a statistically significant increase from the young to middle age group (t = 2.60; P = .0183). Of note, the mean female measurement for orbital aperture area was smaller in each age group than that for our corresponding male population (Table 2; Figures 5 and 6).
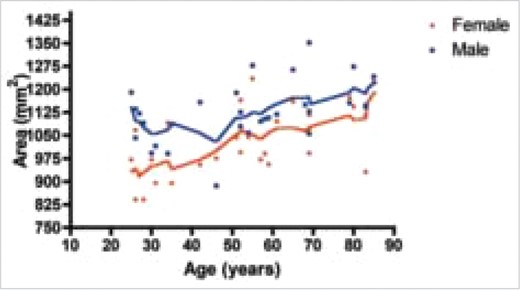
Loess regression curve illustrating the statistically significant increase in orbital aperture area with increasing age for both genders.
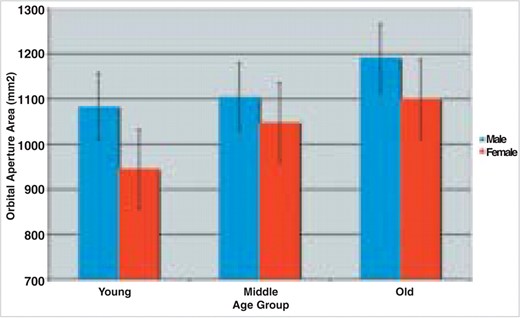
Mean orbital aperture area for both genders. Note the statistically significant increase from the young to middle age groups for male subjects and the statistically significant increase from the middle to old age groups for female subjects.
Superior Orbital Rim
There was a significant increase in height of the superior orbital rim from x-coordinates 10 to 40 for our male subjects (Table 3) and from x-coordinates 10 to 70 for our female subjects (Table 4). This change occurred between the middle and old age groups for both genders.
Mean orbital rim measurement in male subjectsa
| Age category | ||||
| x-Coordinate | Young (group 1) | Middle (group 2) | Old (group 3) | Significant difference (P) |
| Superior orbital rim | ||||
| 10 | 9.58 (1.2) | 10.24 (1.2) | 11.93 (1.4)b | Groups 1 and 2 vs. 3 (.0107) |
| 20 | 12.04 (1.1) | 12.57 (1.5) | 14.29 (1.5)b | Groups 1 and 2 vs. 3 (.0208) |
| 30 | 13.82 (1.0) | 14.06 (1.3) | 15.48 (1.4)b | Groups 1 and 2 vs. 3 (.0281) |
| 40 | 14.68 (0.7) | 14.90 (0.9) | 16.05 (1.4)b | Groups 1 and 2 vs. 3 (.0449) |
| 50 | 14.51 (0.7) | 14.52 (1.7) | 14.78 (1.4) | None |
| 60 | 13.96 (0.8) | 13.70 (1.4) | 14.15 (1.5) | None |
| 70 | 12.70 (1.0) | 12.58 (1.3) | 13.00 (1.4) | None |
| 80 | 11.23 (0.9) | 11.14 (1.3) | 11.42 (1.4) | None |
| 90 | 8.59 (0.9) | 8.52 (1.2) | 8.98 (1.1) | None |
| Inferior orbital rim | ||||
| 10 | 10.19 (0.9) | 10.03 (1.1) | 11.37 (1.0)b | Groups 1 and 2 vs. 3 (.0109) |
| 20 | 12.95 (1.1) | 12.63 (0.8) | 14.26 (1.2)b | Groups 1 and 2 vs. 3 (.0191) |
| 30 | 15.63 (0.9) | 15.38 (1.2) | 16.70 (1.5)b | Group 2 vs. 3 (.0378) |
| 40 | 17.22 (0.8) | 17.46 (1.1) | 18.84 (1.6)b | Groups 1 and 2 vs. 3 (.0373) |
| 50 | 18.58 (0.8) | 19.00 (1.1) | 20.81 (1.6)b | Groups 1 and 2 vs. 3 (.0077) |
| 60 | 19.04 (1.1) | 20.14 (1.2) | 21.56 (1.8)b | Group 1 vs. 2 (.0458) |
| Group 2 vs. 3 (.0497) | ||||
| 70 | 19.69 (0.8) | 20.80 (1.3)c | 22.36 (1.8)b | Group 1 vs. 2 (.0301) |
| Group 2 vs. 3 (.0381) | ||||
| 80 | 18.88 (0.8) | 20.10 (1.2)c | 21.64 (1.7)b | Group 1 vs. 2 (.0167) |
| Group 2 vs. 3 (.0328) | ||||
| 90 | 15.77 (1.5) | 17.29 (1.7)c | 19.20 (1.6)b | Group 1 vs. 2 (.0463) |
| Group 2 vs. 3 (.0193) | ||||
Mean measurements shown in mm (standard deviation).
Statistically significant change from the middle to old age groups.
Statistically significant change from the young to middle age groups.
Mean orbital rim measurement in female subjectsa
| Age category | ||||
| x-Coordinate | Young (group 1) | Middle (group 2) | Old (group 3) | Significant difference (P) |
| Superior orbital rim | ||||
| 10 | 8.02 (1.9) | 9.13 (1.0) | 10.98 (2.0)b | Groups 1 and 2 vs. 3 (.0189) |
| 20 | 11.21 (1.8) | 12.10 (1.0) | 14.22 (2.0)b | Groups 1 and 2 vs. 3 (.0080) |
| 30 | 12.60 (1.6) | 13.20 (1.0) | 15.11 (1.8)b | Groups 1 and 2 vs. 3 (.0104) |
| 40 | 12.93 (1.6) | 13.95 (0.6) | 15.45 (1.5)b | Groups 1 and 2 vs. 3 (.0103) |
| 50 | 12.69 (1.8) | 13.45 (0.8) | 14.90 (2.0)b | Groups 1 and 2 vs. 3 (.0491) |
| 60 | 12.47 (1.5) | 12.89 (0.9) | 14.53 (2.1)b | Groups 1 and 2 vs. 3 (.0362) |
| 70 | 11.49 (1.2) | 11.93 (1.0) | 14.01 (2.1)b | Groups 1 and 2 vs. 3 (.0112) |
| 80 | 10.31 (1.1) | 10.56 (0.6) | 11.60 (1.8) | None |
| 90 | 7.90 (1.1) | 7.97 (0.7) | 8.77 (1.7) | None |
| Inferior orbital rim | ||||
| 10 | 11.10 (2.3) | 11.05 (1.6) | 10.56 (0.8) | None |
| 20 | 13.37 (2.0) | 13.47 (1.7) | 13.10 (1.1) | None |
| 30 | 15.52 (2.4) | 16.05 (1.6) | 15.38 (1.1) | None |
| 40 | 16.97 (2.3) | 17.41 (1.7) | 17.14 (0.9) | None |
| 50 | 17.99 (2.1) | 18.66 (1.7) | 18.71 (1.0) | None |
| 60 | 18.25 (1.6) | 19.21 (1.6) | 20.02 (1.1)c | Group 1 vs. 3 (.0103) |
| 70 | 18.52 (1.7) | 19.87 (1.7) | 20.19 (1.0)c | Group 1 vs. 3 (.0159) |
| 80 | 17.66 (1.7) | 18.89 (1.7) | 19.43 (0.9)c | Group 1 vs. 3 (.0088) |
| 90 | 14.94 (1.6) | 16.03 (1.7) | 16.81 (1.4)c | Group 1 vs. 3 (.0132) |
Mean measurements shown in mm (standard deviation).
Statistically significant change from the middle to old age groups.
Statistically significant change from the young to old age groups.
Inferior Orbital Rim
There was a significant increase in the distance to the inferior orbital rim from x-coordinates 60 to 90 for our female population between the young and old age groups (Table 4). The distance to the inferior orbital rim increased along all x-coordinates for our male subjects with the increase being statistically significant between the middle and old age groups at x-coordinates 10 to 50. From x-coordinates 60 to 90, this increase was statistically significant between the young and middle age groups as well as between the middle and old age groups (Figure 2; Table 3).
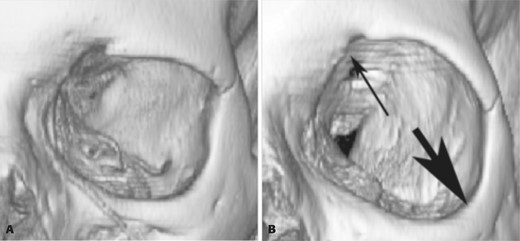
Computed tomography scan of a male patient in the young age group (A) and a male patient in the old age group (B). The image from the old age groups shows significant bony remodeling (arrows) both superomedially and inferolaterally.
Discussion
Much is known in regards to the aging of the facial skin and subcutaneous tissues.7–9 Ptosis of the skin and soft tissues have been implicated in the etiology of the appearance of the aged face. Current techniques in face lift surgery are designed to address these changes. Less attention has been paid to the aging of the facial bones, but several studies demonstrate bony remodeling with age.1–4 The bony components of the face are important for overall facial 3-D contour, because they provide the framework on which the soft tissue envelope drapes. Aging represents a transition from youth where there is an optimal relationship between bony morphology and volume and the soft tissues to an imbalanced one present in the aged face.
Our understanding of how the bony orbits age and what impact that may have on cosmetic surgery is one that is still developing. In 1999, Pessa10 analyzed 3-D CT scans in a soft tissue format for 28 subjects and found that the orbital rim moved posteriorly in relation to the cornea. This led him to believe that the orbital rims anterior projection diminishes with age.10 A limitation of this study, however, was that the values for male and female subjects were averaged together instead of each gender being analyzed separately. In the same year, Pessa11 also reported that the vertical oblique height of the orbit increased with age from his study of 30 male (3-mm CT slice) subjects ranging from ages of 1 month to 76 years old. This increase was not statistically significant, but through these two studies, Pessa believed that the bony orbit remodeled with aging and experienced an overall increase in size, with recession of the orbital rims.
In 2000, Pessa12 furthered our understanding of orbital aging through his study analyzing the orbit angle (line from superior to inferior midorbit in relation to sella nasion) in 12 male subjects in a young versus old comparison.12 He found that there was no change in this angle, which suggested that there was no change in the relationship of the projection of the superior and inferior orbital rim.
The aforementioned studies focused primarily on the aging of the bony orbit in regards to orbital rim projection and aperture expansion. In 2001, Furuta6 began to analyze the change in orbital volume. In his study of CT scans of 109 subjects (2-mm slice width), he found that the orbital volume increased significantly from the 18- to 40-year-old group and 40-plus age group. This finding suggested that there was overall bony expansion of the entire bony orbit resulting in increased orbital volume. The question of how this increase in volume affects the aesthetics of the aged orbit, however, remained.
In order to analyze in more detail the changes to the orbital rims, Pessa1 studied 30 male skulls in three age categories at the Smithsonian Institute and found that there was no change in orbit width or height with increasing age. He did find, however, that there was curve distortion of the superomedial upper orbit and inferolateral orbit.1 These findings led him to believe that the orbital rims receded in only these regions, without an overall change in orbit height or length.
From a review of past literature, it is apparent that our knowledge of the aging of the bony orbit has improved. In this study, we hoped to broaden this understanding and avoid some of the limitations of past studies. In order to accomplish this, we included both male and female subjects and analyzed them independently, allowing us to detect trends for each gender. We also included three age categories (instead of young vs. old), which we hoped would allow us to track the aging process more precisely. Our sample size of 10 subjects from both genders in each age category allows us to broaden important findings that were found on smaller sample sizes. Finally, the use of CT scans at a slice width of 1.25 mm will allow for a more accurate 3-D reconstruction and therefore increased accuracy in the obtained measurements compared to past literature.
In both genders, there was a significant increase in orbital aperture area with increasing age. This suggests that the facial bones that comprise this aperture recede with age, causing an increase in overall aperture size. The timing of the greatest change in aperture area differed by gender. Our female subjects experienced a change earlier on in life, as the area increased significantly from the young to middle age groups. The male subjects did show a significant increase in orbital aperture area, but it occurred between the young and old age groups.
The increase in orbit aperture width suggests that in both genders, the orbital aperture widens in the horizontal dimension with age. This result differs from that of Pessa,1 in which he found no statistical difference in orbital width in male skulls with 10 subjects in three age categories. We feel that our 3-D reconstructions, which were made from smaller slice sizes, allowed for the detection of this increase in orbital aperture width. This loss of bony volume and projection at the lateral aspects of the orbit may result in a loss of support as well as a discrepancy in volume with the overlying soft tissues. This may contribute to the descent of tissue and the lateral “bunching” of soft tissue. These changes may play a role in leading to the appearance of lateral orbital hooding and crow's feet noticed in older populations. The timing for when the greatest difference in orbit width occurred was different for our male and female subjects. Our female population experienced a significant change earlier on in life as the orbit width increased between the young and middle age groups. Our male population, however, experienced a significant increase between the young and old age groups. This earlier aging for our female subjects in regards to orbital aperture area and width both correlate with a previous study done by our group showing that the glabellar and pyriform angles also showed earlier and more substantial changes than in our male subjects.
In order to precisely identify how various regions of the bony orbit age, we subsequently performed curve analysis of the superior and inferior orbital rims. There was a significant increase in height of the superior orbital rim from x-coordinates 10 to 40 for our male subjects (Table 3) and from x-coordinates 10 to 70 for our female subjects (Table 4). This suggests that the orbit in both genders recedes superomedially with age. These results confirm Pessa's work on male skulls, in which he found similar medial bony loss of the superior orbital rim. Our results show this to be true in our female subjects as well. Furthermore, the female group demonstrated more extensive bony loss (from x-coordinates 10–70). The timing of the aging was similar, however, as it occurred between the middle and old age groups for both genders.
There was a significant increase in the distance to the inferior orbital rim from x-coordinates 60 to 90 for our female population between the young and old age groups (Table 4). The distance to the inferior orbital rim increased along all x-coordinates for our male subjects with the increase being statistically significant between the middle and old age groups at x-coordinates 10 to 50. From x-coordinates 60 to 90, this increase was statistically significant between the young and middle age groups as well as between the middle and old age groups (Figure 2; Table 3). These results differ from Pessa's study, in which he found only lateral bony loss of the inferior orbital rim on male subjects. We found this to be true in our female subjects alone, while our male study population experienced significant bony loss along the entire inferior orbital rim with increasing age.
This was the first measurement for which we found significantly more extensive and earlier aging for our male subjects. This result correlates with the findings of Van den Bosch.13 In his study of 320 male and female subjects (aged 10–89 years) he found that after age 35, both genders experienced lower lid droop. The extent of this droop, however, was twice as large in male subjects. One could hypothesize that this recession of bone resulting in the loss of projection of the rim may contribute to the soft tissue drooping noticed in lower lid lag.
The findings of this current study also have implications for the contents of the orbit and their function. Clark,14 in his study using magnetic resonance imaging (2.0-mm slices) of 12 subjects in a young versus old comparison, found that the medial and lateral rectus extraocular muscles moved inferiorly with increasing age. This displacement reflects an inferior location of the corresponding pulleys, which predisposes the elderly to a pattern of incomitant strabismus. Each pulley is coupled to the orbital walls and Tenon fascia. Extraocular muscles not only insert onto the globe, but also to the connective tissue of the Tenon capsule. As the bone around the orbit recedes, it may be responsible for the displacement of these pulleys and in return the extraocular muscles. Thus, these results have implications for both aesthetics and function.
The bony remodeling found in this study may impact the overlying soft tissues, thus having aesthetic implications. The superomedial rim remodeling may contribute to the unmasking of the medial upper lid fat, a change currently attributed to weakening of the orbital septum. In combination with the glabellar angle becoming more acute with age,4 this may also lead to the perceived descent of the medial brow and the formation of glabella skin creases. The inferolateral rim remodeling and increase in orbital aperture width may contribute to the formation of crow's feet and lower lid lag. The mediolateral rim remodeling found in our male study population may contribute to the formation of the nasojugal groove and lower lid lag. As we try to further develop a concept of how the periorbital area changes with age, a possible working hypothesis is that the bony structures undergo volume loss and morphologic change that result in a change in the appearance of the overlying soft tissue envelope. The changes seen in the upper half of the orbit may result in the soft tissues rolling into the orbital aperture and thus, the appearance of brow descent and lateral orbital hooding. In the lower half of the orbit the tissues may roll over the recessed bony ledge leading to lag of the lower lid, appearance of descent of the lid cheek junction, and a deepening of the nasojugal groove as disproportionate tissue piles up against the orbicularis origin along the medial rim.
We feel that bone volume loss and morphologic change, in conjunction with atrophy and expansion related to the loss of elasticity of the soft tissue envelope, create an imbalance in the ideal relationship between the two seen in youth. Zimbler15 stated this sentiment well: “[F]acial aesthetics begin with the marriage of hard and soft tissue integration; however, it is the changing balance of these elements that is the hallmark of the aging process…. A youthful face therefore represents a point in time when a particular set of skeletal proportions are ideal for their soft tissue envelope.”15
The rate of skeletal aging affects individuals differently, and is influenced by many factors such as genetics, dental integrity, occlusal relationships, and the degree of midface development at skeletal maturity. For example, differences may appear in subjects who have midface retrusion or maxillary deficiency. Aging may be variable for each individual because of these factors. The changes found with skeletal aging noted in this study, however, report a general theme of bony volume loss with increasing age.
This study is not the optimal design for determining skeletal aging, because a linear study analyzing CT scans from one patient at different ages would be the most optimal way of determining what changes occur with age. We hope to obtain follow-up CT scans for some of our younger study members in hopes of obtaining this linear data. In future studies, we also hope to obtain 3-D images containing the soft tissues, thus allowing visualization of the direct relationship between bony volume and the soft tissue structures.
Conclusion
We believe that our current results suggest that the bony elements of the orbit change dramatically with age and that the bony aging process is primarily that of contraction and morphologic change. As we learn and better understand the changes in facial aging, it may be that the most effective approach towards facial rejuvenation should be two-fold: restoring volume to compensate for the loss of bony volume, and lifting and reducing the aged and less elastic soft tissue envelope. A balanced approach to facial rejuvenation between volume augmentation and soft tissue envelope repositioning and reduction will hopefully avoid the distortions of either approach in isolation.
Disclosures
The authors have no financial interest in and received no compensation from manufacturers of products mentioned in this article.
References
1
2
3
4
5
6
7
8
9
10
11
12
13
14
15

