


Abstract
Studying macroevolutionary patterns of phenotypic variation and their driving forces in large radiations can shed light on how biodiversity is generated across broad spatiotemporal scales. In this study, we integrated song and morphological variation across more than 300 species representing the largest family of songbirds, the tanagers (Thraupidae), to uncover how morphological variables of the vocal tract combine to shape vocal evolution on a macroevolutionary scale. We found that body size correlated with multiple frequency parameters, concurring with past studies that show how body size constrains vocal evolution. Furthermore, bill size predicted multiple frequency and temporal song characters while bill shape was strongly associated with trill rates, suggesting that bill size and shape both constrain distinct elements of avian song independently of body size covariation. Our results demonstrate that the relationship between morphology and song exhibits modular variation when expanded to a macroevolutionary scale. Furthermore, our study emphasizes the need to consider multiple components of the avian vocal tract when exploring the macroevolutionary interplay of morphological traits and acoustic signals.
Resumen
Estudiar los patrones macro-evolutivos de variación fenotípica y sus fuerzas conductoras en grandes radiaciones puede echar luz en cómo la biodiversidad es generada a lo largo de grandes escalas espacio-temporales. En este estudio, integramos el canto y la variación morfológica a través de más de 300 especies que representan la familia más grande de aves canoras, las tangaras (Thraupidae), para descubrir cómo las variables morfológicas del tracto vocal se combinan para dar forma a la evolución del canto a una escala macro-evolutiva. Encontramos que el tamaño corporal se correlacionó con múltiples parámetros de frecuencia, coincidiendo con estudios pasados que muestran cómo el tamaño corporal limita la evolución del canto. Más aún, el tamaño del pico predijo múltiples caracteres de frecuencia y temporales del canto, mientras que la forma del pico estuvo fuertemente asociada con los ritmos del trino, sugiriendo que el tamaño y la forma del pico limitan distintos elementos del canto de las aves, independientemente de la co-variación del tamaño del cuerpo. Nuestros resultados demuestran que la relación entre morfología y canto exhiben una variación modular cuando se expanden a una escala macro-evolutiva. Más aún, nuestro estudio enfatiza la necesidad de considerar múltiples componentes del tracto vocal de las aves al explorar la interacción macro-evolutiva de los rasgos morfológicos y de las señales acústicas.
Lay Summary
• Avian vocalizations vary widely among birds and are associated with multiple aspects of their biology, including mechanisms of sexual selection, habitat acoustics, and avian vocal tract morphology.
• The avian vocal tract is composed of many internal and external traits, but relatively few studies have disentangled the impact of multiple avian tract components on the evolution of bird song.
• In this study, we quantify associations between 11 song variables and tarsus length (representing body size), bill size, and bill shape used in courtship displays of tanagers, the largest family of songbirds.
• We find that both body size and bill morphology (size and shape) are correlated with various aspects of tanager song.
• Taken together, different components of the avian vocal tract selectively constrain unique aspects of their vocalizations.
• Future studies could examine internal (e.g., tracheal and syringeal) morphological traits in combination with bill morphology to gain a more comprehensive insight into how different elements of the avian vocal tract shape avian vocalizations.
Introduction
Bird song plays a variety of roles including territory establishment, species recognition, and mate attraction (Catchpole and Slater 2008). Multiple structures are responsible for producing and modulating an organism’s vocalizations. Avian vocalizations originate within the syrinx, and, through cartilaginous extension or muscular abduction/adduction, the syrinx modifies the physical properties of soundwaves traveling through the vocal tract (Gardner et al. 2001, Laje et al. 2002, Podos and Nowicki 2004, Riede and Olson 2020). Exhalations traveling through the syrinx are then modified by vibrating labia, which vary in size and elasticity among species, but do not exhibit a consistent linear relationship with body size (Gardner et al. 2001, Laje et al. 2002, Goller and Riede 2013, Garcia et al. 2017). Soundwaves then travel through the trachea, with modifications to a varying degree by extension of its length (Daley and Goller 2004). Finally, the soundwaves exit through the bill, which acts as an enhancer for sound traveling through the internal sound-producing organs as soundwaves exit the bird (Nowicki 1987, Laje et al. 2002). Specifically, the size of the bill gape (narrow vs. wide) aids in the radiation of different tonal qualities of song produced at different fundamental frequencies in posterior internal structures, while rapid bill movements can manipulate trills (Podos et al. 2004; but see Laje et al. 2002). Furthermore, frequency range and repetition rate are generally inversely correlated, resulting in a tradeoff in which birds are restricted in their ability to sing across large frequency ranges (i.e. bandwidths) when producing notes in rapid succession (Podos 1997). Podos and Nowicki (2004) introduced the vocal constraint hypothesis for avian systems, which posits that stronger biomechanical constraints exerted on larger bills favor lower frequencies and narrower bandwidths because birds with larger bills cannot modify their bill gape as rapidly as those with smaller bills. However, physical constraints on song may be more closely associated with bill shape rather than bill size because bill shape can manipulate how complex songs are performed through filtration of produced tonal elements from the syringeal pathway (Laje et al. 2002). This further illustrates that different aspects of bill morphology can be correlated with song evolution independently of covariation with body size (Derryberry et al. 2012). Thus, each component of the avian vocal tract contributes to the production of vocal signals, and the evolutionary relationship between bird song and morphology therefore involves a complex set of traits that may act independently or in concert.
Past studies have used a diverse range of taxonomic systems to disentangle the ways in which various external components of the avian vocal tract contribute to macroevolutionary patterns of birdsong and have predominantly focused on key traits assumed to be the strongest effectors of song. For example, body size is associated with variation in multiple fundamental frequency parameters among many taxa (Tubaro and Mahler 1998, Derryberry et al. 2012, Goller and Riede 2013, Mason and Burns 2015). This relationship has been interpreted as an example of morphological constraint on vocal evolution: larger bodies have larger anatomical structures (e.g., labia), resulting in stronger constraints on tissue elasticity for rapid frequency modulations of high magnitude (Wallschläger 1980, Bowman 1983, Podos and Nowicki 2004, Suthers and Zollinger 2004). Thus, larger birds may find it increasingly difficult to produce higher fundamental frequencies and faster frequency shifts in their vocal displays.
While body size is a prominent correlate of animal vocalizations, multiple morphological features of the avian vocal tract contribute to the production and modification of vocal signals. In particular, external morphological traits may be subject to selective pressures that decouple their evolution from each other and body size constraints (Goller and Riede 2013). For example, bills are not only important for song production, but also play a role in dominance displays (Murphy et al. 2009), defense (Rico-Guevara and Araya-Salas 2015), resource acquisition (Grant and Grant 2006), and thermoregulation (Greenberg et al. 2012). The interweaving of biotic and abiotic effectors subjects bill morphology to a wide variety of selective pressures that may drive its evolution independent of body size, with implications for vocal evolution. Recent studies have approached the evolutionary relationship between morphology and song within a more integrative framework (e.g., in Neotropical furnariids, Derryberry et al. 2018; in blue cardinalids, García and Tubaro 2018; in thraupid seedeaters, Porzio et al. 2019). In furnariids, Derryberry et al. (2018) found that body mass and bill size predicted the most variation in song, whereas García and Tubaro (2018) found that within blue cardinalids bill shape rather than bill size was correlated with song variation alongside body mass. These studies have made progress in elucidating how various traits affect song variation at different taxonomic scales, yet it is still unknown to what extent their findings are generalizable to different groups.
In this study, we investigate evolutionary associations between bill morphology, body size, and vocal displays in tanagers (family Thraupidae). The tanagers are an excellent group for investigating the relationship between morphological and vocal evolution in a phylogenetic comparative framework. They form the largest family of songbirds with more than 370 species (Burns et al. 2014). Tanagers inhabit 27 of the 29 terrestrial habitats found in the Neotropics (Parker et al. 1996), ranging from sea level to more than 4,000 m in elevation and exhibit pronounced interspecific variation with respect to bill morphology, including thick-billed granivores (e.g., Geospiza and Sporophila), hook-billed nectar-feeders (e.g., Cyanerpes), thin-billed insectivores (e.g., Kleinothraupis), and longer, thin bills for bark probing (e.g., Conirostrum binghami; Burns et al. 2014, Demery 2018). Finally, the tanagers exhibit a wide range of song types, with subfamilies differing in the complexity and structure of their vocal displays (Mason et al. 2014, Mason and Burns 2015). Mason and Burns (2015) investigated associations between song, habitat, and body mass across the tanagers and found associations between body mass and song evolution among 9 out of the 10 song parameters. However, the evolutionary associations between bill morphology and bird song are still unknown in tanagers, which exhibit far more variation in trophic ecology and bill morphology than other groups that have been studied to date. Thus, examining these associations in the tanagers provides a more thorough understanding of how variable aspects of morphology impact song variation on a macroevolutionary scale.
METHODS
Trait Measurements
We used the most recent molecular phylogeny of tanagers (Burns et al. 2014) and the species-level taxonomy of Clements et al. (2016) to guide our taxonomic sampling. We measured bill morphology and tarsus length for 1–5 individuals of each species (mean per species = 4.87; see Demery 2018). Only males were measured to minimize potential intersexual variation. From each individual, we took the following measurements (described in the work of Baldwin et al. 1931): length of tarsus, length of bill from nostril, length of exposed culmen, height of bill at nostrils, height of bill at base, width of bill at nostrils, and width of bill at base. Measurements were averaged for each species, and we used the 6 bill measurements to perform a phylogenetic principal component analysis that resulted in orthogonal axes corresponding to bill size and shape, termed PC1 and PC2, using the package phytools (Revell 2012, R Core Team 2016). We used tarsus length, rather than body mass, as an approximation of body size because tarsus length has been shown to correlate with song variation (Price et al. 2007, Linhart and Fuchs 2015), but does not exhibit as much seasonal or individual variation among adults within a species compared to body mass (Zink and Remsen 1986, Rising and Somers 1989, Freeman and Jackson 1990, Senar and Pascual 1997, Weeks et al. 2020), and may therefore be a more accurate approximation of vocal tract size. Furthermore, we assessed the magnitude of correlation between body mass and tarsus length using the function corphylo in the ape package; finding a strong positive correlation, we continued our analyses with tarsus length as a proxy of body size (Spearman’s rank correlation, r2 = 0.60, P = 2.2e−16; Paradis et al. 2015; Supplementary Material Figure S1).
We used song data that were first collected and analyzed in Mason et al. (2014) and Mason and Burns (2015). In these datasets, song was defined as “any vocalization that included tonal elements, exceeded 0.5 seconds in duration, and was preceded and followed by intervals greater than 1 second.” The data were taken from downloaded tanager songs as recordings from either the Macaulay Library (http://macaulaylibrary.org/) or the xeno-canto (http://xeno-canto.org/) online repositories. Given the scarcity of recordings of female tanager songs, we restricted our dataset to only include male tanager songs. Spectrograms were generated using Raven Pro 1.4 (Cornell Laboratory of Ornithology, Ithaca, New York) and we measured 11 characters for each individual song: average note length, average pause length, low (i.e. minimum) frequency, high (i.e. maximum) frequency, peak frequency, average note bandwidth, song bandwidth, frequency shift rate, maximum frequency shift, note rate, and trill rate (Figure 1). We averaged these measurements across individuals for each species. Additional details regarding song measurements and descriptions of each parameter are given in Supplementary Material Table S1. After pruning the dataset to include only taxa that had both song and morphological data, we collected measurements for 317 species (84.9%) of tanagers. We included song measurements of 2,718 individuals (mean per species = 8.57) as well as tarsus and bill measurements of 1,564 individuals (mean per species = 4.93). The final dataset with sample sizes is available on Dryad (see Demery et al. 2021).
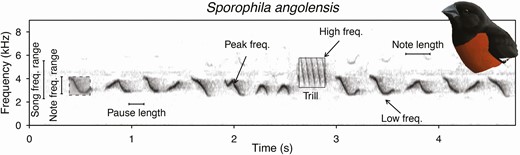
Spectrogram illustrating how specific song variables were quantified. We included song frequency range, note frequency range, pause length, peak frequency, high frequency, trill rate, low frequency, and note length measurements on Sporophila angolensis. Illustration by Mary Margaret Ferraro.
Phylogenetic Comparative Analyses
To comparatively analyze relationships between morphology and song while accounting for phylogenetic history, we used the maximum clade credibility tree and a 50-tree subset of the posterior distribution presented in the work of Burns et al. (2014) to study trait evolution using R packages phytools, ape, and nlme (Revell et al. 2012, Paradis et al. 2015, Pinheiro et al. 2020). For each trait, we implemented Pagel’s lambda model of character evolution using phylogenetic generalized least squares (PGLS, Grafen 1989). We inferred the optimal value of the lambda parameter, which incorporates branch-length transformations that correspond to the strength of phylogenetic signal in the PGLS models and adjusts the variance–covariance matrix accordingly. We ensured that residuals for each PGLS model approximated a normal distribution by plotting the residuals of each song variable and log-transforming variables as needed (Supplementary Material Figures S2 and S3). We chose not to transform the following song variables: high frequency, peak frequency, average note frequency range, song frequency range, maximum frequency shift, and trill rate as their untransformed residuals approximated a normal distribution. We log-transformed average note, average pause, low frequency, frequency shift rate, and note rate as their residuals exhibited a non-normal distribution (Freckleton et al. 2002; R code is available in Demery et al. 2021). We also removed any outlier species with studentized residuals that had an absolute value larger than 3, as we were interested in exploring general trends between morphological and song variables on a macroevolutionary scale, and thus determined that outliers beyond this conventional threshold would detract from that goal (Jones and Purvis 1997, Webster et al. 2004).
We ran separate PGLS models for each of the 11 vocal characters as response variables and PC1, PC2, and tarsus length as main effects. We then subsequently evaluated the magnitude and directionality of each main effect by examining the average T values and P values in concert with 0.95% highest posterior density (HDI) using the package HDInterval (Meredith and Kruschke 2016).
RESULTS
We focused our comparative analyses on the first 2 bill morphology PCA axes, which totaled 96.20% of cumulative morphological variation (Figure 2). PC1 accounts for 82.11% of the total variation and all traits had loadings in the same direction. Thus, PC1 corresponded to bill size, in which species with smaller bills had lower scores and species with larger bills had higher scores (Figure 2). PC2 accounts for 14.09% of the total variation and represents a contrast between bill length vs. bill width and depth, in which species with smaller values have shorter more conical bills, while species with higher PC2 values have narrower, longer bills (Figure 2).
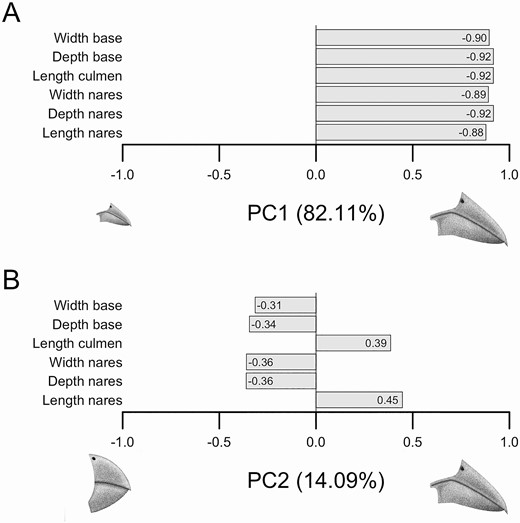
Diagram illustrating the character loadings of each principal component axis for bill morphology. Loadings for each principal component axis are shown, describing the directionality and magnitude of each trait that was part of the multivariate dataset used to generate the phylogenetic principal component analysis. (A) PC1 accounts for 82.11% of the cumulative variation and describes bill size. (B) PC2 accounts for 14.09% of the cumulative variation and describes a contrast between short and thick bills vs. long and narrow bills. Illustrations by Laura Porturas.
Tarsus length was negatively associated with low frequency (β = –0.036 ± 0.01, P < 0.001, HDI = 0.0003–0.001), peak frequency (β = –62.251 ± 30.147, P = 0.04, HDI = 0.019–0.055), and maximum frequency shift (β = –0.037 ± 0.01, P < 0.001, HDI = 0.0001–0.0003; Table 1, Figures 3 and 4). Six out of 11 song variables were correlated with PC1 (Table 1, Figures 3 and 4). Average note length (β = 0.002 ± 0.001, P = 0.047, HDI = 0.026–0.077) and average pause length (β = 0.003 ± 0.002, P = 0.045, HDI = 0.036–0.051) exhibited a positive association with PC1 (Figures 3 and 4). Meanwhile, high frequency (β = –63.802 ± 29.869, P = 0.033, HDI = 0.01–0.051), song frequency range (β = –67.634 ± 29.544, P = 0.023, HDI = 0.013–0.034), frequency shift rate (β = –0.031 ± 0.013, P = 0.017, HDI = 0.013–0.02), and note rate (β = –0.022 ± 0.009, P = 0.011, HDI = 0.007–0.015) exhibited negative associations with PC1 (Figures 3 and 4). PC2 was negatively associated with average note length (β = –0.005 ± 0.002, P = 0.041, HDI = 0.028–0.067) and trill rate (β = –5.754 ± 2.406, P = 0.019, HDI = 0.015–0.024; Table 1, Figures 3 and 4).
Correlations between song and morphology. Song characters, the number of samples (n) used with outliers excluded, the value of the λ parameter under the Pagel’s λ model of phylogenetic signal, β scores and standard errors (SE) of the phylogenetic generalized least squares models, T values that display the magnitude of effects, and P values of associations with tarsus, PC1, and PC2. Asterisks indicate statistical significance: *P < 0.05, **P < 0.01, ***P < 0.001.
| Character | n | λ | Effect | β ± SE | T | P |
|---|---|---|---|---|---|---|
| Log (average note) | 310 | 0.86 | Tarsus | 0.001 ± 0.002 | 0.887 | 0.376 |
| PC1 | 0.002 ± 0.001 | 1.997 | 0.047* | |||
| PC2 | –0.005 ± 0.002 | –2.057 | 0.041* | |||
| Log (average pause) | 310 | 0.5 | Tarsus | –0.001 ± 0.002 | –0.285 | 0.775 |
| PC1 | 0.003 ± 0.002 | 2.016 | 0.045* | |||
| PC2 | 0.004 ± 0.003 | 1.243 | 0.215 | |||
| Log (low frequency) | 317 | 0.71 | Tarsus | –0.036 ± 0.01 | –3.567 | <0.001*** |
| PC1 | –0.012 ± 0.007 | –1.72 | 0.087 | |||
| PC2 | 0.007 ± 0.014 | 0.506 | 0.613 | |||
| High frequency | 316 | 0.84 | Tarsus | –47.309 ± 41.893 | –1.129 | 0.26 |
| PC1 | –63.802 ± 29.869 | –2.136 | 0.033* | |||
| PC2 | 95.58 ± 58.885 | 1.623 | 0.106 | |||
| Peak frequency | 317 | 0.9 | Tarsus | –62.251 ± 30.147 | –2.065 | 0.04* |
| PC1 | –37.206 ± 21.258 | –1.75 | 0.081 | |||
| PC2 | 37.726 ± 42.099 | 0.896 | 0.371 | |||
| Average note frequency range | 312 | 0.32 | Tarsus | –19.64 ± 20.51 | –0.958 | 0.339 |
| PC1 | –22.129 ± 15 | –1.475 | 0.141 | |||
| PC2 | 9.848 ± 30.032 | 0.328 | 0.743 | |||
| Song frequency range | 316 | 0.34 | Tarsus | 36.134 ± 40.445 | 0.893 | 0.372 |
| PC1 | –67.634 ± 29.544 | –2.289 | 0.023* | |||
| PC2 | 22.772 ± 59.133 | 0.385 | 0.7 | |||
| Log (frequency shift rate) | 316 | 0.35 | Tarsus | –0.029 ± 0.018 | –1.62 | 0.106 |
| PC1 | –0.031 ± 0.013 | –2.406 | 0.017* | |||
| PC2 | –0.006 ± 0.025 | –0.245 | 0.807 | |||
| Maximum frequency shift | 309 | 0.69 | Tarsus | –0.037 ± 0.01 | –3.783 | <0.001*** |
| PC1 | –0.01 ± 0.007 | –1.423 | 0.156 | |||
| PC2 | 0.016 ± 0.014 | 1.145 | 0.253 | |||
| Log (note rate) | 316 | 0.54 | Tarsus | –0.007 ± 0.012 | –0.583 | 0.561 |
| PC1 | –0.022 ± 0.009 | –2.559 | 0.011* | |||
| PC2 | –0.005 ± 0.017 | –0.291 | 0.771 | |||
| Trill rate | 102 | 0.77 | Tarsus | 1.677 ± 1.561 | 1.075 | 0.285 |
| PC1 | –1.766 ± 0.94 | –1.879 | 0.063 | |||
| PC2 | –5.754 ± 2.406 | –2.392 | 0.019* |
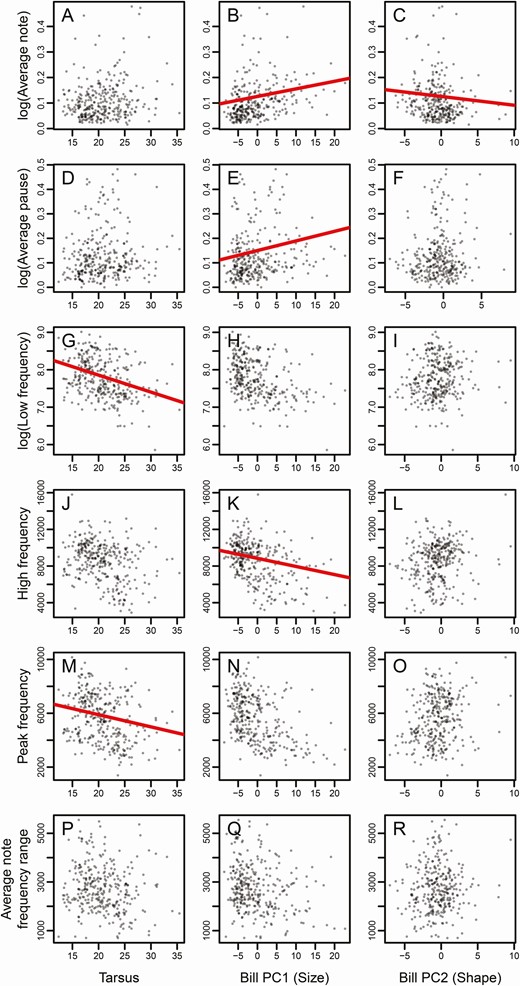
Phylogenetic generalized least squares models of tanager song, body size, and bill morphology. Song characters include A–C: average log (average note length), D–F: log (average pause length), G-I: log (low frequency), J-L: high frequency, M-O: peak frequency, and P-R: average note frequency range, plotted against tarsus length, PC1, and PC2. The figures with red slope lines indicate significant relationships (P < 0.05) between the 2 variables.
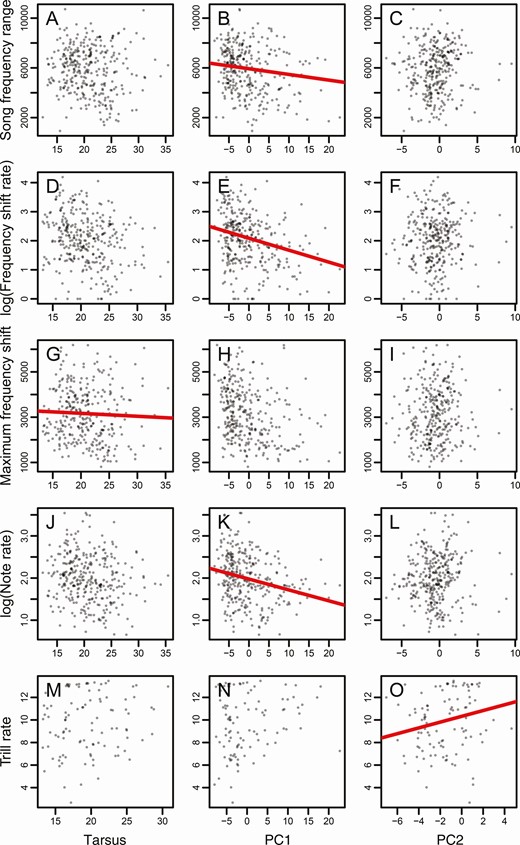
Phylogenetic generalized least squares models of tanager song, body size, and bill morphology. Song characters include A-C: song frequency range, D-F: log (frequency shift rate), G-I: maximum frequency shift, J-L: log (note rate), and M-O: trill rate, plotted against tarsus length, PC1, and PC2. The figures with red slope lines indicate significant relationships (P < 0.05) between the 2 variables.
Discussion
In this study, we explored how multiple morphological components of the external avian bill associate with the evolution of bird song in tanagers, the largest family of Neotropical songbirds. Bill size predicted the most variation in the tanager songs, correlating with 6 out of 11 song parameters including average note length, average pause length, high frequency, song frequency range, frequency shift rate, and note rate (Table 1, Figures 3 and 4). To an extent, our results parallel past studies, suggesting that bill size acts as a final modulator of numerous song elements (Podos 2001, Huber and Podos 2006). Birds with larger bills (higher PC1 values) sang slower, lower-pitched songs with longer note lengths, longer pause lengths, lower frequencies, and fewer rapid shifts in frequency (Figures 3 and 4). These associations have been hypothesized to result from biomechanical constraints; specifically, a tradeoff between bite force and movement speed (Herrel et al. 2009). We posit that larger bills may require more joules to modulate their bill gape to attain higher notes/frequencies, potentially limiting the temporal and frequency-related aspects of a bird’s song repertoire (Podos 2001).
The hypothesis that larger bills produce lower trill rates originated from work on Darwin’s finches (Huber and Podos 2006). However, we found that bill size (PC1) was uncorrelated with trill rates, while bill shape (PC2) did exhibit a correlation with trill rate (Table 1, Figure 4). Tanagers with trilled songs exist throughout the entire family, so the relationship we found could be due to biomechanical constraints throughout the clade rather than a single subclade. Our results suggest that thinner, longer bills are more correlated with increased rates of note repetition than shorter, stubbier bills. Future studies could further investigate associations between trill rate, bill morphology, and bite force by examining whether broad-scale variation in diet accounts for differences in our findings and previous studies. Predictions about associations between bite force, bill size, and trill rate originated in Darwin’s finches (Huber and Podos 2006, Herrel et al. 2009), which are granivorous tanagers with strong links between bill morphology and bite force. However, our study includes tanagers with a wide range of diets that may exhibit different relationships between bite force, bill velocity, and trill rate among the 300+ species considered here.
Body size, represented in this study by tarsus length, was correlated with multiple frequency parameters. Specifically, it was negatively correlated with peak and low frequency. The negative relationship between body size and peak and low frequency concurs with past studies, strengthening the argument that larger body sizes generally correspond with larger sound-producing internal organs (e.g., larger syringeal labia), thereby imposing constraints on their elastic properties and thus their ability to produce higher frequencies (Liu et al. 2017, Derryberry et al. 2018; but see Riede and Goller 2014). Past studies have found either bill size or body size to be a key predictor of vocal evolution in avian radiations, but recent studies have combined aspects of morphology and ecology to demonstrate that the evolutionary relationship between morphology and song is multi-faceted (Derryberry et al. 2018, García and Tubaro 2018). Derryberry et al. (2018) found in their study of woodcreepers that body mass accounted for the most variation in frequency, while bill size accounted for the most variation in temporal and performance-related elements. Meanwhile, García and Tubaro (2018) investigated associations between song and morphology in the “blue” cardinalids and found similar patterns between body size and frequency, and that bill length rather than bill size correlated with temporal variables of the song. Indeed, our results concur with other studies in illustrating how bill morphology and body size both contribute to song evolution. We found that bill size was correlated with temporal variables of song, as demonstrated in past studies (Derryberry et al. 2018, García and Tubaro 2018), but also found that bill shape had a stronger influence on trill rate than bill size.
Demery (2018) found neither a correlation between bill size and diet composition nor a correlation between bill morphology and climate variation in the tanagers, suggesting that bill size and shape are independently evolving under different selective pressures within this radiation. Additional abiotic factors, such as variation in habitat acoustics, can also affect song transmission, resulting in the selection of songs that are optimally transmitted in their respective acoustic environments (Boncoraglio and Saino 2007, Derryberry et al. 2018). However, habitat variation is largely unassociated with vocal evolution in tanagers, in which body mass explains much of song variation separate from habitat variation (Mason and Burns 2015).
Our study focused on external aspects of avian morphology and did not explore patterns between song and internal morphological traits (e.g., syrinx, trachea, larynx, oropharyngeal–esophageal cavity, syringeal musculature), traits whose significant contributions to song production and regulation are well documented in the literature (Gardner et al. 2001, Laje et al. 2002, Fletcher 2006, Riede et al. 2006, Goller and Riede 2013, Riede and Goller 2014, Garcia et al. 2017, Riede and Olson 2020, Uribarri et al. 2020). Numerous studies have demonstrated how the cartilaginous structure of the syrinx and its respective musculature vary in complexity across the avian tree of life and its functional relevance to sound production can be decoupled from body size (Riede et al. 2006, Goller and Riede 2013, Riede and Goller 2014, Riede and Olson 2020). As suggested above in response to editor comment: Indeed, the diversification of song across the tanager radiation could stem from internal morphological design. For example, the asymmetry and extracellular matrix structure of the syringeal labia are strong predictors of oscine fundamental frequency parameters (Riede and Goller 2014). Past research has demonstrated how birds can manipulate syringeal structures (Garcia et al. 2017) and accessory cartilage and musculature (Daley and Goller 2004, Riede and Olson 2020) in the upper vocal cavity, further determining fundamental frequencies and transmittance. Intense selection for specific vocal performances may drive the evolution of internal sound-production organs independently of body size constraints. Given the breadth of our comparative study across 300+ species spanning millions of years, there is likely variation among internal components of the vocal tract (e.g., labia, syrinx, oropharyngeal–esophageal tract) that has impacted tanager song evolution. Our study is unable to disentangle this relationship, as our dataset is based on round skins and media collections, and internal song-producing organs are rarely preserved during museum specimen preparation in birds, let alone at the macroevolutionary scale of entire continental radiations, a challenge shared by any study at this scale.
Our study’s framework adds to the growing body of literature investigating modular intersectionality of avian phenotypic evolution, but it also demonstrates the growing need for classic methodology itself to evolve. Recent studies have demonstrated how different avian clades have evolved unique and/or convergent upper vocal cavities to produce diverse song repertoires using novel methodologies that can harness the information present in alcohol collections alongside experimental manipulations (Riede and Goller 2014, Riede and Olson 2020). Combined comparative analyses of syringeal morphology and vocal evolution hold great promise to further clarify the roles of different components of the vocal tract in shaping variation in avian vocal displays. Developing museum practices to leverage thorough specimen data collection can inform multiple aspects of a bird’s biology and strengthen the signal of multivariate macroevolutionary studies like ours.
Our dataset partially accounted for intraspecific variation in morphology by averaging measurements across multiple individuals within species, but it is unable to address how intraspecific morphological variation corresponds to intraspecific song variation. Populations or subspecies that we averaged here may in fact differ substantially, especially among species that occupy large distributions or have many recognized subspecies. This challenge could be addressed if our song and morphology datasets were taken for the same individuals, but linked vocal and morphological data remain scarce at the taxonomic scale considered here. Furthermore, in some cases, specimens were only available from a single locality within their entire distribution. Future studies could apply our methodological framework to a clade that demonstrates substantial geographic variation in song and morphology in order to more finely disentangle patterns within vs. among species.
We found that relationships between body size and song broke down when we decoupled body size from bill size and shape. Mason and Burns (2015) found stronger and more numerous relationships between body size and song variation, but the relationship could have manifested from a general relationship between morphology and song variation rather than body mass specifically. Therefore, although previous work has identified significant associations between morphology and song, this relationship is strongest when we identify the key external morphological traits that drive the production of specific vocal signaling elements. Furthermore, our results showcase the importance of examining traits in concert with each other; it was only through the combined inclusion of body size, bill size, and bill shape rather than a single morphological character that we were able to identify how morphological modularity constrains the evolution of different song variables across a macroevolutionary scale. We hope that this sheds more insight into the dynamics of morphological evolution and their interaction with multiple axes of avian biology across space and time.
Acknowledgments
We are indebted to the author-affiliated labs, Tod Reeder, and Philip Pryde for their insights during the preparation of the manuscript. Laura Porturas and Mary Margaret Ferraro provided illustrations. We thank the following museums for access to their collections for morphological measurements: American Museum of Natural History, Field Museum of Natural History, Los Angeles County Museum of Natural History, Louisiana State University Museum of Natural Science, Museum of Comparative Zoology, Smithsonian National Museum of Natural History, San Diego State University Museum of Biodiversity, Western Foundation of Vertebrate Zoology. We also thank contributors to the Macaulay Library and xeno-canto for providing recordings. Finally, we thank anonymous reviewers for their constructive feedback on earlier versions of this manuscript.
Funding statement: This project was funded in part by the National Science Foundation (DEB-1354006), American Museum of Natural History Chapman Collection Grant, and the American Ornithologists’ Union. For additional financial support, we would like to thank the Sally Casanova Pre-Doctoral Scholarship, Jordan D. Covin Memorial Scholarship, Harry E. Hamber Memorial Scholarship, Frank Alverson Memorial Scholarship, Hardman Foundation Scholarship, and the Harold and June Grant Memorial Scholarship.
Ethics statement: The coauthors conducted all research in accordance with all appropriate ethics and integrity policies mandated by Ornithology.
Author contributions: A.J.D. and N.A.M. performed data collection of morphological and song data, respectively, and worked together on analyses. A.J.D., N.A.M., and K.J.B. conceived the idea and design of the manuscript. A.J.D., N.A.M., and K.J.B. wrote and edited the manuscript.
Data availability: Analyses reported in this article can be reproduced using the data provided by Demery et al. (2021).
