


Abstract
Although the external appearances of most mammals are drab browns and grays used to match their backgrounds, certain species stand out as exceptions, perhaps the most notable being the giant panda. Using a comparative phylogenetic approach, we examined associations between different pelage regions and socioecological variables across carnivores and ursid subspecies to shed light on the giant panda’s black and white pelage coloration. Analyses of fur color and background environments suggest that the giant panda’s white face, nape, dorsum, flank, belly, and rump are adapted for crypsis against a snowy background, whereas its black shoulders and legs are adapted for crypsis in shade. Dark markings on the head are not used in crypsis, however, but in communication: Dark ears may be involved with signaling intent about ferocity whereas dark eye marks may serve in individual recognition. There is no compelling support for their fur color being involved in temperature regulation, disrupting the animal’s outline, or in reducing eye glare. We infer that the giant panda’s unique pelage coloration serves a constellation of functions that enable it to match its background in different environments and to communicate using facial features.
INTRODUCTION
Studies of the functional and evolutionary significance of external coloration in animals often center on insects, fishes, and birds because their bright conspicuous appearances provide a window for exploring evolutionary mechanisms involved in aposematism or sexual selection. In contrast, most mammals have gray or brown pelage suggesting background matching (Caro 2005; Vignieri et al. 2010; Caro 2013) that poses less of an evolutionary paradox. Nonetheless, a small number of mammals do have sharply contrasting black-and-white pelage, the function of which is known for only a very few (Caro 2009; Caro et al. 2014). Perhaps, the most outstanding example is the coat of the giant panda (Ailuropoda melanoleuca) (e.g., Croke 2005). This strangely patterned ursid has black eye markings and black ears set on a white face. The neck and torso are white but the forelimbs, shoulders, and hindlimbs are black (Figure 1a). The species shows little sexual dichromatism. Such a pelage pattern is very rare among mammals and the adaptive functions of the giant panda’s external appearance remain mysterious, despite the species being a familiar charismatic species to people all over the world.
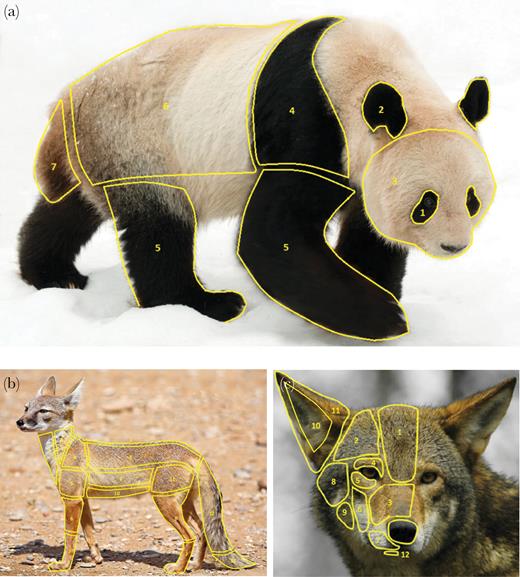
(a) Regions of the carnivore body used 1 in Method 1. (b) and (c) Regions of the carnivore body used in Method 2.
Four ideas have been explicitly proposed to explain giant panda coloration: 1) the species’ pelage is aposematic and advertises pugnacity (Morris and Morris 1966), 2) the white fur of the panda is cryptic against a snowy background (Morris and Morris 1966; Lazell 1974), although its current population is found in snowy habitats for only a third to a quarter of the year, 3) the dark fur is used to retain heat in cold environments (Schaller et al. 1985), and 4) the contrasting markings on the giant panda’s face are used in intraspecific communication (Schaller et al. 1985; Schaller 1993). Additionally, without referring specifically to the species in question, it has been proposed that dark fur around the eyes reduces glare from the sun (Ficken et al. 1971). Sharply contrasting pelage might also be an example of disruptive coloration where internal edges draw the eye away from the true outline of the animal. A theme running through all these suggestions, except the last, is that different regions of the body may have coloration that serves different functions.
Giant pandas currently occupy a highly fragmented geographic range in south-central China, principally Sichuan Province. Formerly, the species ranged throughout most of southern and eastern China, with fossils indicating presence as far south as northern Myanmar and northern Viet Nam yet stretching north nearly to Beijing (Schaller et al. 1985; Hunt 2004). Contemporary populations live at 2000–3000 m altitude (Schaller et al. 1985). The diet consists almost exclusively of low-quality bamboo (Schaller et al. 1989). Individuals are solitary (other than mothers with cubs) and move between evergreen deciduous broadleaf forest at low altitudes through mixed coniferous and deciduous broad-leafed forest at midlevels up to subalpine hemlock, spruce, and fir forest at different times of year (Schaller et al. 1989). Despite their adult body size (86–107 kg), they are currently preyed upon by dhole (Cuon alpinus) and leopards (Panthera pardus), possibly Asiatic black bears (Ursus thibetanus) and brown bears (Ursus arctos) (Morris and Morris 1966), and formerly by wolves (Canis lupus) and tigers (Panthera tigris) (Schaller et al. 1985).
To understand the functions of pelage coloration on different regions of the giant panda’s body, we conducted a broad examination of the ecological and social factors associated with dark and light fur coloration on different regions of carnivores’ bodies and more specifically among bears. We reasoned that the evolutionary drivers of coat coloration on different parts of the giant panda’s body would likely be the same as those on corresponding regions of other bears and carnivores more generally.
METHODS
Perhaps the ideal way to understand the function of external appearances in animals is to observe them in the field, take photographs using characterized cameras and color standards controlling for lighting conditions, and combine this with knowledge of potential observers’ visual systems but it is difficult to conduct such research on large endangered mammals living in remote areas (Caro and Melville 2012). Assuming body coloration patterns in terrestrial carnivores are driven by similar selective pressures, instead we thought it would be profitable to explore the ecological and social correlates of fur coloration on different regions of terrestrial carnivores’ bodies and thereby assess all the proposed functional ideas for the giant panda’s coat color using phylogenetically controlled comparative analyses.
Dependent variables
H.W. extracted up to 10 photographs of 195 terrestrial carnivore species and 39 ursid subspecies from books and reputable sites on the internet with the ID listed to species with its scientific name and often its location (see full dataset in Supplementary Table S1). Because photographs mined from the internet and books carry little information about camera sensors or illumination, we used several photographs of each species. Obtaining calibrated photographs of each species and ursid subspecies would be possible but nevertheless costly and subject to pelt color change in older museum specimens (Davis et al. 2013). Each photograph was scored only once and had to be of an adult and a large enough size to see individual hairs, preferably with an image quality enabling any banding on individual hairs to be observed. Lateral shots had to exhibit the neck, entire side of animal, full tail, and front and back limbs. Face shots had to be close-ups of the animal’s face pointing toward the camera, although faces angled away from the camera were permissible as a last resort (amounting to <10%). All were daytime photographs with minimal glare and those with wet, dirty, snowy, or windblown fur were avoided. If photographs for a species could not be found that met these criteria, adjustments were made on a case-by-case basis. For instance, tail and paws were occasionally excluded, and damp individuals, especially otters, were sometimes included. Flickr and other nonscientific websites were used infrequently and only if the species was distinguishable and not easily confused with others. In 12 cases, photographs of pelts were used to score the sides of subspecies of bears.
We used 2 independent methods to score coloration on different regions of species’ and subspecies’ bodies. The first used the extent of dark or light fur on 7 different regions of the coat to generate a 5-point darkness–lightness scale for each region. The coarseness of this method made it relatively insensitive to variation in photographic quality and undescribed camera characteristics and lighting conditions. Our second method was more ambitious in that it involved coding 13 regions on the lateral surface and 12 on the face each on a 10-point scale. Carried out by a different observer, it provided a second independent measure of coloration. Both observers were generally naive to experimental aims when scoring coloration. We report both sets of results and, in situations where they conflict, we are circumspect in how we interpret results.
Method 1 (coarse)
In Method 1, Z.R. chose the best of 5 photographs of each carnivore species (median = 5 [interquartile range: 3-5] photographs) and ursid subspecies (median = 3 [1-5]) so that as many body regions could be seen as possible. Each animal was divided up into 7 regions that were originally based on those parts of the giant panda’s body that are contrasting (Figure 1a). Note the tail was not used in analyses as ursids have virtually no tails and they never contrasted with the “Back” category.
Fixed regions of the body were scored on a light–dark scale as: 0 = all white, 1 = some white but no dark (dark was defined as dark brown or dark gray or black), 2 = some white and some dark, 3 = some dark but no white, and 4 = all dark. Tan was scored as 1.5; red or gold were both scored as 2; and brown or gray were both scored as 3.5 as long as they were not dark. For each carnivore species and ursid subspecies, averages were calculated for each region of the body across photographs.
Method 2 (fine)
In the second method (independently scored by H.W.), 2 templates with 13 body sections on the lateral surface and 12 on the face were created (Figure 1b and c). A scoring key for pelage colors was developed based on Santana et al. (2012) for evaluating coloration in primates that accounted for the 2 forms of melanin present in mammalian hairs: eumelanin, which is a black/brown pigment and phaeomelanin, which is a yellow/red pigment, and common combinations of the two. The key (Figure 2a) consisted of the following 7 categories: (A) no pigment (white), (B) no pigment banded with eumelanin black (silver), (C) eumelanin black, (D) agouti saturated with eumelanin (eumelanin and phaeomelanin banded hairs with predominantly eumelanin bands), (E) eumelanin brown, (F) agouti saturated with phaeomelanin (eumelanin and phaeomelanin banded hairs with predominantly phaeomelanin bands), and (G) phaeomelanin. All pigment categories (except no pigment white) had 5 gradations each ranging from light or low pigmentation intensity (1) to dark or high pigmentation intensity (5). After scoring, color categories were rearranged by H.W., T.C., and T.S. working together and forced into a common lightness–darkness scale of 1 (white) to 10 (black) (Figure 2b).
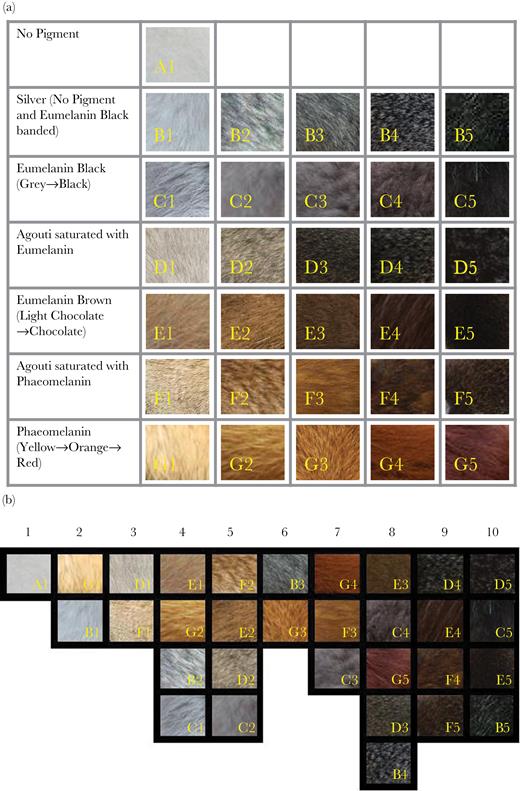
(a) Key for Method 2. (b) Color gradation scale for Method 2.
Regions of fur on photographs of side view and faces of carnivores (median = 5 [interquartile range: 2–8] photographs, median = 4 [2–6], respectively) and ursid subspecies (median = 3 [2–5], 4 [2–5], respectively) were compared with categories in Figure 2a and assigned a best representative color. Each body region was scored independently of others. In cases where a body region had 5% or more of an additional color, an estimated percentage was recorded and colors were listed for each patch. These patches were later averaged in a weighted fashion for that body region in each photograph. Percentage listings were especially prevalent in spotted and striped species. Colors assigned to body regions for each photo were converted into scores of 1–10 using the previously constructed color gradation scale (Figure 2b). For each species and for each region, scores were then averaged to give mean 1–10 darkness scores.
General
To make areas in Method 2 correspond to those in Method 1, we created average scores of regions in Figure 1b to represent various areas of the body in Figure 1a as follows: face view regions 4 and 5 for eyes; face views 10 and 11 for ears; face views 1, 2, 3, 6, 7, 8, 9, and 12 for face; average of side views 4 and 5 for shoulder; side views 1, 8, 9, 10, and 11 for back; and side views 6 and 7 for legs.
In one set of analyses concerning disruptive coloration, we derived 5 different measures of body contrast. Measure A was generated as an average of the differences between adjacent body regions 1 versus 3, 2 versus 3, 3 versus 4, 4 versus 5, 4 versus 6, and 5 versus 6 in Figure 1a. Measure B was generated as an average of the differences between adjacent side-view regions in Figure 1b: 2 versus 4, 3 versus 5, 4 versus 8, 5 versus 9, 5 versus 6, 9 versus 11, and 11 versus 6. Measure C was simply a record of the maximum difference between any 2 adjacent body regions in Figure 1b. Measure D used the very lightest and very darkest patches of the pelage within each adjacent body region (see above) in Figure 1b and averaged them across regions described in Measure B. (Recall, any distinct fur patches within a given region were scored separately). Measure E was the maximum of the very lightest and very darkest patches of the pelage within each adjacent body region (see B above) in Figure 1b.
In two sets of analyses involving pugnacity, eye and ear darkness were subtracted from adjacent face darkness to yield measures of facial contrast.
As subtle seasonal changes would be impossible to detect on undated photographs, we chose only to address seasonal changes for species for which a complete dramatic switch in color is evident. Therefore, we scored and averaged summer and winter pelage separately for 4 species with all white winter pelage: Vulpes lagopus, Mustela ermina, M. frenata, and M. nivalis. We also averaged scores from sexually dichromatic male and female African lions (Panthera leo) together to get an overall species average. In general, we ran analyses on summer coats unless we were testing for associations with snow cover.
Independent variables
To examine hypotheses for giant panda fur coloration using the comparative method, we needed to score environmental variables including temperature, background and lighting conditions, and several social variables for all terrestrial carnivores. To measure temperatures, we obtained average annual range temperatures of carnivore species from PanTHERIA (http://esapubs.org/archive/ecol/E090/184/#data). For ursid hair length and depth analyses, we calculated the average annual temperature for all raster cells that fall within ranges of 8 bear species.
We used the following 2 environmental measures to examine background matching: extent of snow cover and degree of shade. The former represents a crude measure of how dark the earth is against which an animal is seen; the latter represents the extent to which visibility is impeded by shadow. To measure snow cover, we used IUCN range maps and NASA Earth Observations’ TERRA/MODIS snow cover data (https://nsidc.org/data/modis/data_ID MOD10C1). The latter shows monthly snow cover from January to December 2004 (the earliest complete year of data available). In TERRA/MODIS, a pixel is counted as having snow if there is snow on the ground for between 1 and 30 days in a month. We overlaid IUCN range maps on snow cover data and took the following scores: 0 signifies 0% of the range contains such pixels; 1 = 0.1–33% of the range; 2 = 34–67%; 3 = 68–99.9%; 4 = 100% of the range has snow cover each month. These broad categories were used to help account for interannual variation not revealed in the 2004 dataset. (Zero was a particularly useful category indicating the carnivore never encountered snow). Average annual snow cover was calculated as the average over the 12 months. For snow, Z.R. scored the carnivores, whereas M.H. scored the ursid subspecies.
We constructed 2 measures of shade. For each carnivore species, we went to the IUCN website (http://www.iucnredlist.org/search) and determined the 43 habitat types in which they were found. IUCN “suitable” habitats were scored as 2, IUCN “marginal” habitats as 1, and not present as 0. To obtain a coarse metric of the degree of shade afforded by each habitat, T.C. and T.S. independently scored each sort of habitat on a 0.1-point shade scale from 0 to 1 and resolved disagreements by looking at photographs of those habitats on the internet. We multiplied the IUCN score (1 or 2) by the shade score for those habitats in which a species was found and obtained an average “Shadiness score” for each species.
For ursid subspecies, IUCN habitat classifications were unavailable so T.C. compared range maps of subspecies with 18 biomes derived from http://bit.ly/2f6DP8k and for each biome assigned each subspecies a score of 0 = not present, 1 = present, or 5 = covers a very large portion of the species’ range. T.C. and T.S. independently scored each biome on a 0.1-point shade scale from 0 to 1 and resolved any disagreements looking at photographs of those biomes on the internet. We multiplied the (1 or 5) biome score by the biome’s shade index and took an average for those biomes in which a subspecies was found to obtain a “Shade score” for each subspecies. Analyses were rerun converting 5 to 2 and also converting 5 to 1 but they yielded the same results and are not reported here.
Quantitative data on sociality, activity patterns, and territoriality that might affect communication were taken from previous studies (Stankowich et al. 2011, 2014 [T.S.]) and were re-examined by M.H. (using sources in Supplementary Table S2) and by T.C. independently using Wilson and Mittermeier (2009). In a small minority of cases, where after prolonged searches no information was forthcoming, T.C. made generalizations based on similar data found in all or most other members of that family. T.S., M.H., and T.C. consensus variables were then derived. Crude social behavior was scored as 1 = solitary, 2 = pairs, 3 = group, and 4 = groups encountered in variable sizes. Activity was 1 = nocturnal, 2 = nocturnal and crepuscular (i.e., twilight), 3 = diurnal, and 4 = cathemeral (both day and night). Territorial was 0 = absent and 1 = present. The Anal Spray Score was taken from Stankowich et al. (2014): (0 = secretions not used in defense, 1 = secretions ooze out or they emit a foul smell when attacked, 2 = eject secretions in a stream [nondirected], and 3 = able to aim/direct the stream/spray of secretions at the predator). Pugnacity was scored as 0 or 1, with 1 representing reports of fierce or intimidating behavior; species recorded as unknown were first assigned a conservative score of 0, then reanalyzed assigning them a liberal score of 1. For ursids, torpor was scored as 1 for subspecies reported as showing metabolic supression and as 0 for none. All species’ and subspecies’ scores can be found in the Supplementary Appendix.
Ursid pelts
To obtain a representative sample of pelage thickness over the whole body, H.W. measured hair lengths and depths at 15 points on the bodies of 8 bear species at the US National Museum of Natural History and Royal Ontario Museum, Canada. All pelts were laid flat on a table and gently combed with a wide-toothed comb. For lengths, hairs were parted and sectioned into groups of 10–20 hairs, then measured from root to tip with a flat ruler. For depth measurements, a narrow, angled ruler was inserted into the fur at a ninety degree angle to the skin and distance from skin to surface of hair was recorded.
Phylogenies
Carnivores
We downloaded a complete consensus phylogenetic tree of the carnivores from the 10KTrees website (Arnold et al. 2010). All species names were changed to agree with those listed in Wilson and Reeder (2005). The final tree included 195 species.
Ursids
Black bears (Ursus americanus) and brown bears (Ursus arctos) show considerable intraspecific variation in coat color across their ranges (Rounds 1987; Sato et al. 2011). To construct a subspecies level tree of the Ursidae, we first added all subspecies as polytomies. For Ursus americanus, we used Byun et al. (1997) to group U. a. americanus and U. a. cinnamoneum (which was also supported by Cronin et al. 1991) as sister taxa and U. a. kermodei, U. a. carlottae, U. a. vancouveri, and U. a. altifrontalis into their own polytomy. For U. thibenatus, there was considerable disagreement between available subspecies level trees. Following Hwang et al. 2008, Choi et al. 2010, and Puckett et al. 2015, we placed U. t. japonicas and U. t. usuuricus as sister taxa in a polytomy with U. t. thibetanus and U. t. formosanus; this clade was then placed in a polytomy with U. t. gedrosiarius, U. t. mupinensis, and U. t. laniger. We examined 6 different articles to study evolution within U. arctos (Taberlet and Bouvet 1994; Talbot and Shields 1996; Baryshnikov et al. 2004; Galbreath et al. 2007; Calvignac et al. 2009; Murtskhvaladze et al. 2010) but all used geographic location only (which spans Europe, Asia, and North America) without reference to subspecies to create intraspecific trees. Therefore, we left all subspecies of U. arctos as a polytomy.
Analyses
We conducted planned comparisons using targeted phylogenetic comparative analyses to test individual hypotheses using Phylogenetic Generalized Least Squares analyses using the “caper” package (Orme et al. 2012) in R (R Development Core Team 2008). Prior to analysis, all polytomies in the ursid tree were arbitrarily resolved with branch lengths of zero using the “chronopl” function in the “ape” package (Paradis et al. 2004). For each model, lambda (λ, which represents the phylogenetic signal) is computed using maximum likelihood methods and we report the N, df, λ, t-statistics, and P values for each model for both coarse (M1) and fine methods (M2). Planned comparisons derived from longstanding hypotheses in the literature obviated the need to control for multiple testing. In general, independent variables of interest were often highly correlated with each other so we usually ran single factor analyses.
RESULTS
Physiological issues
Temperature
We found no significant associations between mean annual temperatures of carnivore ranges and pelage color on any region of the body using summer coats (Table 1). When we reran analyses using winter coats, however, we found that pelage is significantly lighter in colder temperatures (and therefore significantly darker in warmer temperatures) on certain regions of the body: back and shoulders (using both coarse [M1] and fine [M2] scoring measures), faces using M2, and marginally significant associations (0.1 > P > 0.05) for eye, ear, and legs markings using one or other method (Table 1).
Associations between fur color and average annual temperature across carnivores
| Summer coats | Winter coats | ||||||
|---|---|---|---|---|---|---|---|
| λ | t | P | λ | t | P | ||
| Eyes | M1 | 0.566 | 0.353 | 0.725 | 0.630 | 1.787 | 0.076 |
| M2 | 0.656 | 0.642 | 0.522 | 0.729 | 1.544 | 0.124 | |
| Ears | M1 | 0.701 | −1.092 | 0.277 | 0.768 | 0.310 | 0.757 |
| M2 | 0.879 | 0.838 | 0.403 | 0.893 | 1.705 | 0.090 | |
| Face | M1 | 0.266 | −0.054 | 0.957 | 0.362 | 1.586 | 0.115 |
| M2 | 0.556 | 1.504 | 0.134 | 0.675 | 2.689 | 0.008 | |
| Shoulder | M1 | 0.468 | −0.041 | 0.968 | 0.489 | 2.045 | 0.042 |
| M2 | 0.445 | 0.426 | 0.671 | 0.546 | 1.964 | 0.051 | |
| Back | M1 | 0.501 | 0.432 | 0.666 | 0.517 | 2.398 | 0.018 |
| M2 | 0.464 | 1.335 | 0.713 | 0.524 | 2.480 | 0.014 | |
| Legs | M1 | 0.833 | −0.075 | 0.940 | 0.920 | 1.568 | 0.120 |
| M2 | 0.676 | 0.254 | 0.800 | 0.775 | 1.659 | 0.099 | |
M1 N = 177, df = 1, 175 throughout; M2 N = 179, df = 1, 177 throughout. Positive values on t-tests denote darker fur is associated with warmer temperatures.
Using phylogenetically controlled contrasts, we examined hair lengths and depths at 15 points on the bodies of 8 ursid species (Supplementary Table S3) in relation to both average annual temperature of raster cells and fur color for each region of pelage taken from Method 2. We found no significant effects of either variable or any interaction between them on hair morphology (Supplementary Table S4), except for a single marginal association between lower forelimb hair depth and higher temperatures. Thus, there is no evidence that pelage is longer or deeper in colder areas, or that longer or deeper pelage is either darker or lighter in ursids. Similarly, we found no differences in hair length or depth between black and white areas of the giant panda’s body (Median test using Fisher’s Exact test on all 14 points [see Supplementary Table S5], lengths, P = 0.592; depths, P = 0.347), although when we dropped belly, chest, tail, and tail tip because of their extreme lengths, we found black areas of hair were longer than white areas (N = 10 points, P = 0.048) although no deeper (N = 10, P = 1.000).
Glare
Across carnivores, there were very few associations between eye markings and the lighting environment. Such markings were unrelated to a diurnal, cathermeral, crepuscular, or nocturnal lifestyle (using summer coats with independent variables run as yes/no, P > 0.1 in all cases [Supplementary Table S6]). Nonetheless, there was a marginal overall trend between eye surround darkness and increasing diurnality (i.e., nocturnal through to cathermeral) but only using the M1 method (M1 N = 177, df = 1, 175, λ = 0.598, t = 1.755, P = 0.081; M2 N = 179, df = 1, 177, λ = 0.672, t = 0.544, P = 0.587). Dark eye markings were not associated with snow cover where reflected light might impede vision (see below).
Antipredation hypotheses
Background matching in snow
Carnivore bodies are lighter in snowy environments as determined from comparing the darkness of coat regions with average snow cover. We found significant negative associations for the shoulder region (using winter coats, M1 N = 185, df = 1, 183 for all M1 analyses in this section, λ = 0.436; t = −3.132, P = 0.002; M2 N = 179, df = 1, 177 for all M2 analyses in this section, λ = 0.588; t = −1.740, P = 0.084), back (M1 λ = 0.476; t = −3.124, P = 0.002; M2 λ = 0.555; t = −2.042, P = 0.043), and legs on M1 (M1 λ = 0.864; t = −2.626, P = 0.009; M2 λ = 0.778; t = −1.068, P = 0.269).
Moving to carnivore heads, darker fur surrounding the eyes was significantly negatively or else not associated with average snow cover (using winter coats, M1 λ = 0.564; t = −2.605, P = 0.010; M2 λ = 0.734; t = −1.229, P = 0.221). Also, there was a marginal negative association between darkness of the face and snow cover (M1 λ = 0.354; t = −1.704, P = 0.090; M2 λ = 0.692; t = −1.640, P = 0.103) but no significant association with ear darkness (M1 λ = 0.772; t = −0.760, P = 0.449; M2 λ = 0.899; t = −1.129, P = 0.260).
These findings were replicated at the ursid subspecies level where we found that as average snow cover increased, pelage becomes lighter on the eyes, ears, shoulders, back, and legs, whereas faces showed a marginal effect (Table 2). In addition, for M1 measures, there was a positive average snow × torpor interaction which was significant for both the eyes and back and marginally significant for ears, shoulders, and legs (Table 2). This indicates that most body regions on ursids are lighter with more snow cover and that this effect is particularly marked in subspecies that do not go into winter torpor, whereas there is no such effect for subspecies exhibiting torpor.
Associations between fur color, average snow cover, measures of shade, and torpor in ursid subspecies for M1 (N = 42, df = 5, 36 throughout) and M2 (N = 39, df = 5, 33 throughout)
| Method 1 | Method 2 | |||
|---|---|---|---|---|
| t | P | t | P | |
| Eyes | λ = 0 | λ = 0.243 | ||
| AvgSnow | −3.051 | 0.004 | −1.552 | 0.130 |
| BiomeShade | 0.132 | 0.897 | 0.125 | 0.901 |
| Torpor | −0.793 | 0.433 | −0.643 | 0.525 |
| AvgSnow × Torpor | 2.039 | 0.049 | 0.738 | 0.466 |
| BiomeShade × Torpor | 0.774 | 0.444 | 1.098 | 0.280 |
| Ears | λ = 0 | λ = 0.429 | ||
| AvgSnow | −3.062 | 0.004 | −2.599 | 0.014 |
| BiomeShade | 0.504 | 0.618 | 0.697 | 0.491 |
| Torpor | −0.320 | 0.751 | −0.454 | 0.653 |
| AvgSnow × Torpor | 1.826 | 0.076 | 1.033 | 0.309 |
| BiomeShade × Torpor | −0.026 | 0.980 | 0.701 | 0.488 |
| Face | λ = 0 | λ = 0.557 | ||
| AvgSnow | −2.016 | 0.051 | −1.629 | 0.113 |
| BiomeShade | −0.219 | 0.828 | −0.429 | 0.671 |
| Torpor | −0.508 | 0.614 | −0.432 | 0.669 |
| AvgSnow × Torpor | 1.444 | 0.157 | 0.715 | 0.479 |
| BiomeShade × Torpor | 0.739 | 0.465 | 0.899 | 0.375 |
| Shoulders | λ = 0 | λ = 0 | ||
| AvgSnow | −3.148 | 0.003 | −2.987 | 0.005 |
| BiomeShade | 0.876 | 0.387 | 0.320 | 0.751 |
| Torpor | −0.032 | 0.974 | −0.790 | 0.435 |
| AvgSnow × Torpor | 1.818 | 0.077 | 1.092 | 0.283 |
| BiomeShade × Torpor | 0.202 | 0.841 | 1.066 | 0.294 |
| Back | λ = 0.424 | λ = 0.507 | ||
| AvgSnow | −3.404 | 0.002 | −2.532 | 0.016 |
| BiomeShade | −0.362 | 0.720 | −0.554 | 0.583 |
| Torpor | −0.411 | 0.684 | −0.690 | 0.495 |
| AvgSnow × Torpor | 2.127 | 0.040 | 1.247 | 0.221 |
| BiomeShade × Torpor | 0.649 | 0.521 | 0.813 | 0.422 |
| Legs | λ = 0 | λ = 0 | ||
| AvgSnow | −3.077 | 0.004 | −2.603 | 0.014 |
| BiomeShade | 0.113 | 0.911 | −0.076 | 0.940 |
| Torpor | −0.477 | 0.637 | −0.516 | 0.609 |
| AvgSnow × Torpor | 1.863 | 0.071 | 1.350 | 0.186 |
| BiomeShade × Torpor | 0.227 | 0.822 | 0.382 | 0.705 |
Positive values on t-tests denote darker fur is associated with increasing snow or shade or going into torpor.
Background matching in shade
Across carnivores we matched regions of the body against shadiness and found several significant positive associations (again using winter coats for consistency, shoulder M1 N = 185, df = 1, 183 for all M1 analyses in this section, λ = 0.398; t = 2.766, P = 0.006; M2 N = 179, df = 1, 177 for all M2 analyses in this section, λ = 0.562; t = 3.832, P = 0.002; back M1 λ = 0.423; t = 2.214, P = 0.028; M2 λ = 0.623; t = 3.877, P = 0.0001; legs M1 λ = 0.879; t = 2.406, P = 0.017; M2 λ = 0.844; t = 3.964, P = 0.0001), yet no significant associations on most regions on the head (eyes M1 λ = 0.620; t = 0.709, P = 0.479; M2 λ = 0.763; t = 1.303, P = 0.194; face M1 λ = 0.353; t = 0.591, P = 0.556; M2 λ = 0.710; t = 1.528, P = 0.128; ears M1 λ = 0.729; t = 0.254, P = 0.800; M2 λ = 0.908; t = 1.806, P = 0.073).
At the ursid subspecies level, there were no significant associations with shade or shade–torpor interactions for any region of the body (Table 2).
Disruptive coloration
If black and white contrasting pelage is a way to break up the outline of a mammal and prevent recognition, we might expect more contrasting carnivores to be found in certain lighting environments. We could find, however, no evidence at all that carnivores with contrasting coloration were found in areas with more snow cover or more shade (P > 0.1 for all 10 comparisons, see Supplementary Table S7).
Aposematism
Aposematism may involve signaling noxiousness or ferocity in mammals. Indeed, there was a strongly significant effect of average contrast between 6 adjacent body areas (measure A, see Methods) and ability to spray noxious anal secretions (using summer coats, N = 177, df = 1, 175, λ = 0.035, t = 5.449, P = 1.696 × 10⁻⁷). However, even though ursids were included in this analysis, bears, including the giant panda, do not have noxious anal secretions. When we explored the association between pugnacity and the extent to which eye markings contrast with the surrounding face, we found only a marginal effect for one pugnacity measure (using summer coats, conservative pugnacity M1 N = 177, df = 1, 175 for all remaining M1 analyses in this section, λ = 0.863; t = 1.776, P = 0.077; M2 N = 179, df = 1, 177 for all remaining M2 analyses in this section, λ = 0.496; t = 1.099, P = 0.273; liberal pugnacity M1 λ = 0.887; t = 1.030, P = 0.304; M2 λ = 0.107; t = 1.271, P = 0.205). Nonetheless, it should be noted that pugnacity is a very difficult trait to assess across an entire order because data are often anecdotal descriptions and involve different clades varying in body size and diet.
Turning to the extent to which ear markings contrast with the adjacent face, there was a mixed signature of pugnacity with M1 yielding no significance but M2 showing a significant positive association (using summer coats, conservative pugnacity M1 λ = 0; t = 0.787, P = 0.432; M2 λ = 0.884; t = 2.094, P = 0.038; liberal pugnacity M1 λ = 0; t = −0.093, P = 0.926; M2 λ = 0.882; t = 2.292, P = 0.023).
Intraspecific communication
The extent to which individuals live together, defend territories, or are active could all influence the degree to which external coloration might be used in signaling to conspecifics. Yet there were virtually no significant associations between pelage coloration and social behavior, the time that species are active, or territoriality (Table 3) save that darker markings around the eyes and darker faces were marginally associated with greater diurnality (but using M1 only). There was a significant a negative association between leg coloration and sociality using both scoring methods: species with darker legs are less social. It is worth noting that ear and eye color are strongly associated across carnivores (M1 N = 189, df = 1, 187, λ = 0.818; t = 9.407, P < 2 × 10⁻¹⁶).
Associations between fur color social behavior, activity patterns, and territoriality in carnivores using summer coats for M1 (N = 177, df = 1, 175 throughout) and M2 (N = 179, df = 1, 177 throughout)
| Method 1 | Method 2 | |||||
|---|---|---|---|---|---|---|
| λ | t | P | λ | t | P | |
| Eye | ||||||
| Social | 0.572 | −0.248 | 0.804 | 0.681 | −1.190 | 0.236 |
| Activity | 0.598 | 1.755 | 0.081 | 0.672 | 0.544 | 0.587 |
| Territorial | 0.573 | 0.276 | 0.783 | 0.667 | 0.290 | 0.772 |
| Ears | ||||||
| Social | 0.676 | 0.776 | 0.439 | 0.888 | −0.690 | 0.491 |
| Activity | 0.678 | 0.770 | 0.442 | 0.884 | −0.152 | 0.879 |
| Territorial | 0.681 | 0.057 | 0.955 | 0.886 | −0.776 | 0.439 |
| Face | ||||||
| Social | 0.253 | 0.918 | 0.360 | 0.628 | −1.214 | 0.226 |
| Activity | 0.235 | 1.907 | 0.058 | 0.592 | 0.607 | 0.545 |
| Territorial | 0.269 | 0.799 | 0.426 | 0.601 | 0.640 | 0.523 |
| Shoulders | ||||||
| Social | 0.484 | −1.06 | 0.290 | 0.470 | −1.096 | 0.275 |
| Activity | 0.464 | 0.275 | 0.784 | 0.452 | 0.318 | 0.751 |
| Territorial | 0.479 | 0.737 | 0.462 | 0.452 | −0.183 | 0.855 |
| Back | ||||||
| Social | 0.520 | −0.256 | 0.798 | 0.504 | −0.103 | 0.918 |
| Activity | 0.505 | 0.398 | 0.691 | 0.493 | 0.512 | 0.610 |
| Territorial | 0.524 | 1.167 | 0.245 | 0.501 | −0.035 | 0.973 |
| Legs | ||||||
| Social | 0.861 | −2.218 | 0.028 | 0.704 | −2.081 | 0.039 |
| Activity | 0.833 | −0.376 | 0.708 | 0.680 | −0.303 | 0.763 |
| Territorial | 0.836 | 0.307 | 0.759 | 0.684 | 0.311 | 0.756 |
Positive values denote darker fur is associated with increased sociality, greater diurnality and being territorial.
DISCUSSION
We used a comparative approach to try to understand the adaptive significance of the giant panda’s unique pelage coloration because field experiments are difficult to conduct on large, endangered species (Caro and Melville 2012). As very few species of carnivore have a coat like the giant panda, we divided up the body into different regions. We used 2 independent methods to score coat coloration in carnivores and ursids to make our findings more robust. A strength of these approaches is that we can state with certainty that dark or light regions of carnivore pelage are associated with particular ecological or social variables. A weakness is that we cannot say definitively that the giant panda has an area of pelage for a particular reason; it is always possible that a patch of fur has evolved for a different purpose than in other carnivores. An additional problem is that our data are based on human (trichromatic) perception of photographic images and not images viewed by dichromatic carnivores in the field, although our focus on fur darkness and lightness circumvents the issue of chromacity to some extent. With these caveats in mind, we now discuss our findings.
Temperature
Across carnivores, we find few associations between fur coloration and mean annual temperature except that shoulder and back regions are consistently darker in warmer areas but only if winter coats are used in analyses (Table 1). Depending on the scoring method (M1 or M2), there is a similar finding for the face and marginal effects for eye markings, ear and leg areas too (Table 1). These associations probably represent an example of Gloger’s rule which states that species living in warm humid conditions have darker coats (Gloger 1833). Similarly, in an earlier carnivore study using different methods, associations were found between dark fur and living in tropical forests in canids, and to a lesser degree in ursids and herpestids (Ortolani and Caro 1996). The drivers of Gloger’s rule are opaque, however, and likely vary across taxa. In regards to heat regulation, there is debate as to whether the color of mammalian hair has much influence on an individual’s temperature because the structure of the coat including its density, length, the diameter of hairs, as well as the optical properties of the hairs that determine whether radiation is absorbed, transmitted or scattered, are all involved in modulating temperature along with surface relectance (Walsberg 1991). To characterize this debate, some argue that fur color has no effect on a mammal’s core temperature (e.g., Oritsland and Ronald 1978; Walsberg 1983; Dawson et al. 2014), whereas others believe it is important (e.g., Burtt 1981; Tributsch et al. 1990).
We found virtually no relationship between fur length or fur depth and either temperature or fur color across ursid species (Supplementary Table S4) suggesting fur color is unrelated to pelage structure. That hair color is unrelated to temperature management is supported by absence of differences in hair lengths or depths on black and white areas on the giant panda’s body (Supplementary Table S5), although when dropping very long regions of pelage, black hairs are longer than white as might be expected given that melanin protects structures from abrasion. Examination of the raw data in Supplementary Table S3 show that many areas of the giant panda’s coat are shorter than those of the sloth bear (Melursus ursinus), brown bear (Ursus arctos), and black bear (Ursus americanus) even on the parts of the body where the giant panda’s pelage is black, strongly suggesting that hair darkness in the giant panda is unrelated to capturing and retaining heat. Although our comparative analyses across carnivores contribute further evidence in support of Gloger’s rule, and may in part explain the giant panda’s dark shoulders because it occupies subtropical forest habitats, it seems doubtful that black fur serves to keep extremities warm as there are no substantial structural differences between areas of black and white pelage in the giant panda or fur-temperature associations across ursids.
Glare
Previous analyses concerning dark eye markings in carnivores and the lighting environment are mixed. Ortolani (1999) found that dark hair around the eyes was associated with being crepuscular but we could not replicate this result. Instead we found only a marginal association between dark eye markings and increasing diurnality in carnivores and using only one measure of scoring. Considering only ursids, Ortolani and Caro (1996) found no evidence for dark eye surround and diurnality. Here, we found no association between darker eye surround and snow cover where reflected light might be a nuisance; in fact, the reverse was true (Table 2). Taking these findings together, the empirical evidence for dark eye surround reducing glare is weak or equivocal. The fact that giant pandas are cathemeral, being active during the day and night, does not help to make a convincing case that dark eye markings in this species are used to reduce glare.
Background matching
For background matching (and disruptive coloration), we used lightness of the background against which a carnivore might be viewed as derived from snow cover, and degree to which the environment is dark due to shade. We chose these variables rather than background hue to maintain a focus on black and white pelage. Regarding snow, our analyses link lighter pelts to snow cover across the order. Ortolani and Caro (1996) found associations between white coats and living in the arctic in mustelids, a marginal association in canids, and no association in ursids. Taking the 3 families together, they found a significant association between being white and living in the arctic. Our more sensitive ursid subspecies analyses show strong associations between lighter fur color across all regions of the body and the presence of snow. These comparative analyses make it highly probable that white areas of the giant panda’s pelage (face, neck, back, flank, belly, and rump) are white to be cryptic against a snowy background. This is further supported by the strong associations in those subspecies that do not go into torpor (using M1), an interesting finding because such populations will encounter snow regularly whereas populations exhibiting torpor will be resting and hidden during cold months. For example, polar bears do not hibernate and are white, whereas brown and black bears living at high latitudes do hibernate but are not generally white (e.g., Goodrich and Berger 1994). Giant pandas do not hibernate and because they have white torsos and white heads, it seems likley that these areas serve to camouflage the animal at the times of the year when snow collects.
However, there is also a strong signature of shade. Across carnivores, shoulders, backs, and legs are darker in species inhabiting more shady habitats suggesting that darker fur serves as crypsis. Across ursid subspecies, however, there is no evidence that fur color on any region of the body is linked to shade (but see Rounds 1987). Giant pandas have dark shoulders, forelimbs, and hindlimbs; so, there is an argument that these areas serve to keep the animal camouflaged in shady forested habitats. Any cryptic coloration in giant pandas must serve to reduce detection by large carnivores because their bamboo diet means that they do not need to remain hidden from prey, as described for black bears (Klinka and Reimchen 2009). In contrast, there is an absence of associations between dark pelage coloration on the proximal regions of carnivores and shade suggesting darker fur serves a different function on the head.
Disruptive coloration
The idea that giant pandas are disruptively camouflaged is not supported by the carnivore data. Contrasting adjacent elements on the body are not associated with either snowy or shady environments using any of 10 different tests (Supplementary Table S7). Giant panda pelage has some features of disruptive coloration (Cott 1940; Stevens and Merilaita 2009) in that adjacent white and black patches are highly contrasting (although not as much in the brown and white Quinling panda subspecies). Furthermore, patches almost certainly blend in with shady or white backgrounds and some patterns touch the outline of the body, although not all (e.g., eye markings). Arguments against disruptive coloration (although not fatal) include markings not generally being placed away from the body surface to create false internal edges, and no coincident disruptive coloration disguising memorable features such as eyes. Instead eyes and ears are highly exaggerated in the giant panda. No examples of disruptive coloration have been demonstrated in mammals as yet, and our systematic data argue against this occurring in carnivores, so at present it is most parsimonious to argue that the giant panda is not disruptively colored.
Interspecific communication
It is noteworthy that across carnivores there is a virtual absence of association between the coloration of proximal body regions and inhabiting shady environments suggesting these dark facial regions are not involved in background matching and by inference that black markings on the giant panda’s head are unlikely to be concerned with crypsis. Instead, we found that eye markings are somewhat darker in more diurnal carnivores suggesting, perhaps, that darker regions of the face could be involved in communication. In the case of the giant panda, it is unclear whether this might relate to interspecific or intraspecific communication. There is little support (one marginal association) for eye contrast being associated with pugnacity in carnivores suggesting interspecific communication is unlikely. Although conspicuous faces are found in mid-size carnivores with noxious defenses (Newman et al. 2005; Stankowich et al. 2011), giant pandas do not have these defenses, so signaling physiological defenses is improbable.
There were links between contrasting ears and pugnacity using one of our scoring methods (M2) indicating contrasting facial features may signal ferocity, and giant pandas are reported as being truculent (Morris and Morris 1966). Black ears may conceivably be involved with signaling to predators.
Intraspecific communication
Regarding intraspecific communication, we found weak evidence for darker eye surround and darker faces in more diurnal carnivores. This suggests perhaps that darker facial areas could be used in signaling to conspecifics. In line with this, there is considerable variation in shape and area of giant panda eyemasks including sex differences in the angle between the eye patches (Dungl 2007). Moreover, experimental evidence shows that giant pandas can discriminate panda-like eye-mask patterns and remember these 6–12 months later suggesting eye marks may be involved in individual recognition (Dungl et al. 2008). Schaller (1993) noted that a stare represents a threat in giant pandas, and the patches enlarge the giant panda’s eye 10-fold making the stare more potent. To show lack of aggressive intent, a giant panda averts its head, covers the eye patches with its paws, or hides it face. At present, we cannot separate whether giant pandas have exaggerated eye marks to signal aggressive intent to other giant pandas, and possibly predators, or whether they are involved in intraspecific recognition, or both. But we do know that intraspecific signaling is important in this species (Nie et al. 2012; Owen et al. 2016).
As dark ear markings are closely associated with dark eye markings across carnivores, the possibility that dark ears are a form of eye automimicry cannot be discounted. Schaller (1993, p.97) reports “a staring panda often holds its neck low, a position that not only presents the eye patches to an opponent but also outlines the black ears against the white neck, in effect presenting 2 pairs of threatening eyes.”
CONCLUSION
Our comparative analyses provide tantalizing suggestions that the extraordinary pelage coloration of the giant panda is a constellation of colors serving different functions. The majority of the animal (face, nape, dorsum, flank, belly and rump) is adapted for crypsis against a snowy background, whereas other parts (shoulder and legs) for crypsis in shade. There is no compelling support for fur color being involved in temperature regulation or disruptive coloration. Ultimately, we suggest that the giant panda’s dual coloration stems from its poor nutritional diet of bamboo and inability to digest plant material efficiently (Schaller et al. 1989; Xue et al. 2015), forcing it to be active throughout the year as it cannot lay down sufficient fat reserves to hibernate. Thus, it encounters several backgrounds and lighting conditions during the course of a year, extremities of which are an alpine snowy habitat and dark tropical forest. We propose that as the giant panda is unable to molt sufficiently rapidly to match each background (although anecdotes of individual black bears changing color between molts have been documented [Rogers 1980]), it has evolved a compromise white and black pelage. This is an alternative evolutionary strategy to smaller carnivores like the ermine and arctic fox that have winter and summer coats. Interestingly, some wolverines (Gulo gulo), another relatively large species that does not go into winter torpor, and that travels long distances across several habitat types, sometimes has a black and white body that resembles the pattern of the giant panda (Supplementary Figure S1). Our comparative analyses suggest that markings on the head are not used in crypsis but instead are used in communication. Dark ears may be involved with signaling intent about ferocity whereas dark eye marks may be used in individual recognition or threat displays.
Most of the arguments presented here are based on human vision and it would be helpful to know the distances at which tigers, wolves, leopards, and giant pandas can resolve black and white patches of fur. Recent models of lion and spotted hyena (Crocuta crocuta) vision indicate that large carnivore acuity is far less developed than that of humans (Melin et al. 2016) and giant pandas have relatively small eye diameters and cannot distinguish colors easily (Kelling et al. 2006). Thus, it is likely that none of these carnivores can resolve contrasting pelage as well as humans during the day when giant pandas are active and not much better than humans under scotopic conditions.
In summary, our working hypothesis is that the giant panda has evolved a compromise pelage on its torso, parts of which enable it to match its background in different environments, and it has facial features that are used in communication (Figure 3).
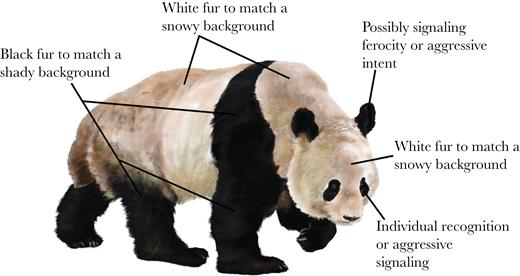
Working hypotheses for pelage coloration in the giant panda (drawing by Ricky Patel).
SUPPLEMENTARY MATERIAL
Supplementary data are available at Behavioral Ecology online.
The authors thank the US National Museum of Natural History and Royal Ontario Museum for access to pelts, Jason Riggio and Sharlene Santana for advice, and John Fitzpatrick, Sami Merilaita, and 2 anonymous reviewers for their extremely helpful comments. H.W. and T.S. were supported by the College of Natural Sciences and Mathematics at CSULB. Author contributions: T.C. conceived of the project, suggested the tests and variables, and wrote the paper; H.W. scored color patches and took museum measurements; Z.R. scored color patches and collected snow data; M.H. amassed independent variable data; and T.S. conducted the statistical analyses and provided theoretical input during data collection.
Conflict of interest: The authors have no conflicts of interest.
Data accessibility: Analyses reported in this article can be reproduced using the data provided by Caro et al. (2017).
REFERENCES
Author notes
Address correspondence to T. Caro. E-mail: tmcaro@ucdavis.edu.
Handling editor: John Fitzpatrick
