


Abstract
Although many herbivores and omnivores have been shown to balance their intake of macronutrients when faced with nutritionally variable foods, study of this ability has been relatively neglected in carnivores, largely on the assumption that prey are less variable in nutrient composition than the foods of herbivores and omnivores and such mechanisms therefore unnecessary. We performed diet selection studies in 5 breeds of adult dog ( Canis lupus familiaris ) to determine whether these domesticated carnivores regulate macronutrient intake. Using nutritional geometry, we show that the macronutrient content of the diet was regulated to a protein:fat:carbohydrate ratio of approximately 30%:63%:7% by energy, a value that was remarkably similar across breeds. These values, which the analysis suggests are dietary target values, are based on intakes of dogs with prior experience of the respective experimental food combinations. On initial exposure to the diets (i.e., when naive), the same dogs self-selected a diet that was marginally but significantly lower in fat, suggesting that learning played a role in macronutrient regulation. In contrast with the tight regulation of macronutrient ratios, the total amount of food and energy eaten was far higher than expected based on calculated maintenance energy requirements. We interpret these results in relation to the evolutionary history of domestic dogs and compare them to equivalent studies on domestic cats.
Introduction
In the study of animal foraging, there has long been a focus on single nutritional currencies, most notably energy (in optimal foraging theory, sometimes with nutrients or secondary compounds included as linear constraints) or nitrogen (in nutritional ecology) ( Raubenheimer et al. 2009 ). Over recent years, however, the application of an alternative approach, geometric analysis, has demonstrated that the balance of energetic macronutrients exerts a powerful, and often dominant, effect on the nutrition-related behavior, physiology, and performance of animals ( Simpson and Raubenheimer 2012 ). This is reflected, inter alia, in the divergent macronutrient regulatory responses among feeding guilds, with dietary breadth, and in association with development mode and the possession of nutrition-related symbionts (see Discussion).
A fundamental, but little-researched, area in the evolution of nutritional regulatory strategies concerns the impacts of domestication and the associated selection pressures on the preferred dietary macronutrient profiles of animals. In a recent study of domestic cats, Hewson-Hughes et al. (2011) used nutritional geometry to demonstrate that cats actively selected a diet with a protein:fat:carbohydrate energy balance of 52:36:12, and interpreted this to reflect their largely unchanged status as an obligate predator. That the selected macronutrient balance in that study was not an artifact of the captive history of the cats, or of the experimental conditions, but rather provides insights into the evolutionary history of these felids, is suggested by 2 facts. First, not only did the cats select a specific macronutrient balance but they also altered the proportions of different experimental food combinations eaten to maintain the target nutrient balance. Second, Plantinga et al. (2011) have subsequently demonstrated that a very similar macronutrient profile is selected by feral cats in the wild.
From an evolutionary viewpoint, among the most fascinating instances of domestication is the dog. Domestic dogs, the only large carnivore ever to be domesticated, were derived from wolves ( Canis lupus ), probably in several independent events ( Vilà et al. 1997 ; vonHoldt et al. 2010 ). Unlike other domesticated animals, which originated in agrarian societies 10 000 years B.P. or less, the initial stages of dog domestication took place among hunter-gatherers at least 15 000 ( Driscoll et al. 2009 ; Wayne and vonHoldt 2012 ) and possibly in excess of 100 000 years ago ( Vilà et al. 1997 ). In the early stage, this was most likely more a case of spontaneous coevolution between wild wolf populations and humans, but with the transition to agriculture there was increasingly intense selection for smaller, more docile dogs ( Wayne and vonHoldt 2012 ). Over the last 200 years, intensification of artificial selection has resulted in a proliferation of breeds, with the consequence that dogs are now the most phenotypically diverse of all animal species. They range in size from 1kg (Chihuahua) to 100kg (Mastiff), display more variation in skeletal and cranial proportions than the entire carnivore order, and show behavioral and physiological attributes that are comparably diverse ( Wayne and Ostrander 2007 ; Wayne and vonHoldt 2012 ). This diversity is all the more interesting because it exists contemporaneously with the ancestral species, from which it was derived in what is from an evolutionary perspective a very short time period.
Here we describe a series of experimental studies in which we explored the patterns of dietary protein, fat, and carbohydrate selection in 5 diverse breeds of domestic dogs, the papillon (PAP), miniature schnauzer (MS), cocker spaniel (COS), Labrador retriever (LR), and St Bernard (SB). Our aims were to determine whether the patterns of macronutrient selection in these breeds were as diverse as other phenotypic traits, to compare these to comparable experiments on domestic cats ( Hewson-Hughes et al. 2011 ), and relate the results to the composition of prey in the wild.
METHODS
Animals, housing, and welfare
Diet selection studies were performed in adult dogs ( C. lupus familiaris ) of both sexes (neutered and entire) representing 5 breeds of dog from toy to giant (PAP, MS, COS, LR, and SB) at the WALTHAM Centre for Pet Nutrition (WCPN), Melton Mowbray, UK. Throughout each study, dogs were pair-housed in purpose-built, environmentally enriched facilities with constant access to an outdoor area where they could interact with other dogs. Extensive socialization with people and on-lead walking were provided each day. Food was offered to individually housed dogs in two 1-h periods per day (08:00–09:00h and 14:00–15:00h) and drinking water was available at all times. Given the potential for weight gain in these studies due to the provision of foods in excess of energy requirements, a limit of 15% above individual dogs’ ideal bodyweight was set by the WCPN Ethical Review Committee as the maximum amount of weight a dog could gain before being removed from the study and dogs that did gain weight underwent a weight management phase after completing the study to return them to their ideal bodyweight.
Diets and general protocols
We performed 3 experiments, which differed in the diet format (wet vs. dry) and the combination of foods (differing in macronutrient balance) offered to the dogs. We used commercial dog foods that were either dry (kibbles) or wet (cans/pouches), which differ not only in water content and texture but also macronutrient profiles, most notably a higher carbohydrate level in dry foods. The first aim of our experiments was to assess and compare the dietary balance selected by the different breeds of dog fed either dry or wet foods with variable macronutrient levels (with foods available in excess of calculated maintenance energy requirements [MERs]). The second aim was to evaluate whether naivety to the experimental foods affected the macronutrient balance selected.
All experiments comprised 3 phases (the durations of which are given below). The first was a naive self-selection (NSS) phase, in which the dogs were exposed to all of the experimental foods simultaneously. The aim of this phase was to measure nutrient self-selection by the dogs when naive to the experimental foods. In the second, monadic “learning” phase, the dogs were exposed to each of the foods on successive days. This phase provided the dogs with further experience of the foods before they were once again allowed to self-select a diet in the experienced self-selection (ESS) phase. We considered the ESS phase of the experiments to provide the best measure of the macronutrient balance preferred by the dogs, because in this phase they could freely compose a diet from nutritionally complementary foods of which they had prior experience. To evaluate the impact of this, we compared macronutrient selection in Phase 1 (NSS) and Phase 3 (ESS).
Experiment 1: dry foods—variable protein, carbohydrate, and fat
Three dry-format foods (high fat, pFc; high carbohydrate, pfC; and high protein, Pfc) were manufactured using standard processing (extrusion) procedures at Mars Petcare, Verden, Germany. These foods were formulated based on Mars Inc. commercial recipes with the inclusion level of poultry meal, maize gluten, ground rice, wheat flour, and beef tallow altered to achieve differences in the macronutrient:energy ratios of the foods ( Supplementary Data , Supplementary Data).
The following protocol was carried out in 5 breeds of dog, details of which are shown in Supplementary Data (Supplementary Data). Of the 51 dogs that started the experiment, 16 were removed as a result of reaching the weight gain limit set by the Ethical Review committee. Prior to the experiment, dogs were fed standard commercially available dry diets (Pedigree® complete adult small dog [PAP], Pedigree® Advance adult mini [MS and COS], and Pedigree® complete adult [LR and SB]) at 200% of their estimated MER (calculated as 460 kJ kg −0.75 [110 kcal kg −0.75 ]) for at least 1 week to accustom them to being offered excess food during the experiment. This calculation for MER falls between the National Research Council (NRC) recommended energy requirements of 544 kJ kg −0.75 (130 kcal kg −0.75 ) and 377 kJ kg −0.75 (90 kcal kg −0.75 ) for active and inactive dogs, respectively ( NRC 2006 ).
Phase 1: NSS
For 7 days, dogs were given foods pFc, pfC, and Pfc simultaneously in 3 separate bowls from which to self-select a diet. Each food was offered at 50% of each dog’s calculated MER at both the morning (08:00–09:00h) and afternoon meal (14:00–15:00h; i.e., 100% MER of each food was offered in total each day and 300% MER offered in total each day). To avoid positional bias the location of each food was rotated daily.
Phase 2: monadic “learning” phase
Dogs were cycled through eight, 3-day periods in which they were confined to a different food (pFc, pfC, or Pfc) on each of the 3 days. Each food was offered at 100% of each dog’s calculated MER at both the morning (08:00–09:00h) and afternoon meal (14:00–15:00h; i.e., 200% MER offered in total each day). This phase served as a conditioning phase in which the dogs gained experience of the nutritional profile of each of the foods separately.
Phase 3: ESS
In this phase, the regimen of Phase 1 was repeated on the now experienced dogs. However, it was noticed that some dogs were consuming all of one or more of the foods, and so to ensure that the composition of the diet self-selected by the dogs was not constrained by availability of the foods, this phase was extended by 4 days during which each food was offered at 100% of each dog’s calculated MER at both the morning (08:00–09:00h) and afternoon meal (14:00–15:00h; i.e., 200% MER of each food offered in total each day and 600% MER offered in total each day). Only the data collected during this 4-day extension were used in the statistical analysis of this experiment (because on reviewing the data it was apparent that some dogs also depleted one or more foods during the NSS phase).
Experiment 2: wet foods—variable protein, carbohydrate, and fat
It appeared from analysis of Experiment 1 that dogs were selecting a diet composition toward the highest possible fat intake and lowest possible carbohydrate intake. However, due to the macronutrient profiles of the foods provided in that experiment, they were unable to compose a diet with less than 22% of energy from carbohydrate or more than 54% of energy from fat. We hypothesized that providing foods with lower carbohydrate and higher fat content would allow dogs to demonstrate their target intake for protein, fat, and carbohydrate free from the constraints on fat and carbohydrate intake imposed by the foods offered in the dry food experiment.
Wet food formulations provided an opportunity to explore lower dietary carbohydrate concentrations because, unlike dry foods, they do not require starch as a binding agent. Three commercially available wet foods (i.e., processed in cans or aluminum foil trays) providing differing macronutrient energy ratio profiles (Chappie® original = pfC; Cesar® chunks in loaf = Pfc; Pedigree® puppy original = pFc) were used in this experiment (see Supplementary Data , Supplementary Data). Forty-two dogs representing 4 different breeds started this experiment and 5 were removed before data were collected ( Supplementary Data , Supplementary Data). Of the dogs that took part in the dry food experiment, 3 PAPs, 2 MSs, 2 COSs, and 3 LRs also took part in this wet food experiment. Prior to the study, dogs were fed a standard commercially available canned food (Pal® chunks in jelly) at 200% of their MER (460 kJ kg −0.75 ) for at least 1 week to accustom them to being offered excess food during the study.
Phase 1: NSS
For 7 days, dogs were given foods pFc, Pfc, and pfC simultaneously in 3 separate bowls from which to self-select a diet. Each food was offered at 100% of each dog’s calculated MER at both the morning (08:00–09:00h) and afternoon meal (14:00–15:00h; i.e., 200% MER of each diet was offered in total each day). If the full allocation of any food was eaten at 1 meal the amount of that food was increased (in 15% steps) at subsequent meals to guarantee that some of all foods was left uneaten. This ensured that the balance of macronutrient intake selected was not constrained by availability of the foods. To avoid positional bias, the position of each food was rotated daily.
Phase 2: monadic “learning” phase
Dogs were cycled through eight, 3-day periods in which they were confined to a different food (pFc, pfC, or Pfc) on each of the 3 days. In order to limit potential for weight gain each food was offered at 100% of MER (i.e., 50% MER at the morning meal and 50% MER at the afternoon meal) for the first six 3-day cycles and increased to 200% MER (100% each at morning and afternoon meal) for the final 2 cycles.
Phase 3: ESS
This was the same as the naive phase with each food initially offered at 200% of MER and increased if necessary for any dog that ate the full allocation of any food offered.
Experiment 3: wet foods—fixed protein
The results of the above Experiments 1 and 2 suggested that protein was relatively invariant in the diets selected by the dogs at close to 30% of total energy, whereas the balance of fat:carbohydrate varied more widely with experimental circumstances. We performed a third experiment in which protein was fixed at 30% and the foods differed in their fat:carbohydrate ratio (foods X, Y, and Z, Supplementary Data , Supplementary Data). Because in this design the foods varied only in 2 dimensions, the NSS, monadic learning, and experienced simultaneous self-selection phases of the experiment each involved only 2 foods. The food pairings represented all pairwise combinations of high, medium, and low fat:carbohydrate foods. This experiment also provided an opportunity to demonstrate that the macronutrient intake selected using commercially available wet diets described above was not driven by differences in “palatability” between the diets. Foods were prepared fresh each day by mixing (using an electric food mixer) appropriate amounts of drained skinless chicken breast (steam sterilized in cans at Mars Petcare, Verden, Germany), lard (Tesco, UK; melted in a microwave), and pregelatinized wheat flour plus vitamins and minerals. The nutritional composition of the diets was formulated to meet recommendations for adult dogs ( NRC 2006 ).
Twenty-six MSs ( Supplementary Data , Supplementary Data) were used in 3 studies with n = 12 per study (10 dogs were used in 2 studies) with each study offering a choice between a pair of foods (X vs. Z, Y vs. Z, and X vs. Y) using the methodology described above with the following modifications.
Phase 1: NSS
Each food was offered at 150% of each dog’s MER equally divided into two 1-h meals per day (10:00–11:00h and 14:00–15:00h; i.e., 600% MER offered in total each day).
Phase 2: monadic “learning”
Each food was offered at 100% of MER (i.e., 50% MER at the morning meal and 50% MER at the afternoon meal) for the first six 2-day cycles and increased to 200% MER (100% each at morning and afternoon meal) for the final 2 cycles.
Phase 3: ESS
This was the same as the naive phase with each food offered at 150% of MER equally divided into two 1-h meals per day (i.e., 600% MER offered in total each day).
Statistical analyses
For all studies, the percentages of total energy from protein, fat, and carbohydrate were analyzed by mixed-model analyses to take into account the repeated measures for individual dogs within a phase. The carbohydrate data were log 10 transformed prior to analyses due to positively skewed distributions; subsequently means and 95% confidence intervals (CIs) have been back transformed for illustration in figures. Statistical analyses were carried out using GenStat® v13.1 software (VSN International Limited, Hemel Hempstead, UK). An overall significance level of 5% was adopted for all analyses.
Wet and dry foods—variable protein, carbohydrate, and fat
For the ESS wet and dry models, dog was defined as a random effect and breed as a fixed effect to investigate if there were differences in the macronutrient balance selected between breeds. For the NSS vs. ESS models (wet foods only), phase nested in dog was defined as the random effect and breed, phase, and their interaction were defined as fixed effects to investigate if there were differences in the macronutrient balance selected between breeds and if this changed with experience. Estimates of the target intakes (kJ) for protein, fat, and carbohydrate as well as total energy intake of dogs during the ESS of the wet food experiments were determined by mixed-model analysis with dog as a random effect and breed as a fixed effect. Data were log 10 transformed prior to analysis due to increasing variance of residuals with increasing energy consumed. Means and 95% CIs were back transformed to kJ d −1 for presentation in tables.
Wet foods—fixed protein
For the ESS analysis, diet pair nested in dog was defined as the random effect and diet pair was defined as a fixed effect to investigate if there were differences in the balance of carbohydrate and fat selected (protein was fixed) between diet pairs. For the NSS vs. ESS models, phase nested in diet pair nested in dog were defined as the random effects and diet pair, phase and their interaction were defined as fixed effects to investigate if the balance of fat and carbohydrate selected within diet pairs changed with experience.
For both analyses, the variability between diet pairs was found to differ significantly and this variability was modeled by allowing the residual error to change with diet pair.
Results
Experiments 1 and 2: wet and dry foods—variable protein, fat, and carbohydrate
Figure 1 shows the proportional protein, fat, and carbohydrate compositions of the experimental foods used in the dry and wet diet experiments, together with the nutrient intakes of each dog breed associated with the phases of the 2 variable protein environments. A first thing to note from the figure is the composition of the experimental foods (filled squares for wet foods and hollow squares for dry foods). For each experiment, the triangle formed by joining the points representing the foods defines the accessible area for a dog provided with ad libitum access to that food combination. The plot shows that dogs fed the wet and dry food combinations could theoretically compose diets with similar maximum carbohydrate concentration (i.e., >50% energy from carbohydrate), but those fed the wet foods could achieve an intake with lower proportional carbohydrate content than those fed dry foods. Conversely, dogs on the dry foods could achieve an intake with higher proportional protein content than those on the wet foods, but the 2 diet formats allowed similar minimal protein concentrations. Both the minimal and maximal attainable fat concentrations were higher on wet than dry foods. The area of overlap between the triangles shows the range of protein:fat:carbohydrate dietary concentrations that was accessible both to dogs on the wet and the dry foods. The relationship between the accessible region in diet space and the intakes selected by the dogs in the ESS phase of the experiment provides information about the macronutrient balance of the target diet.
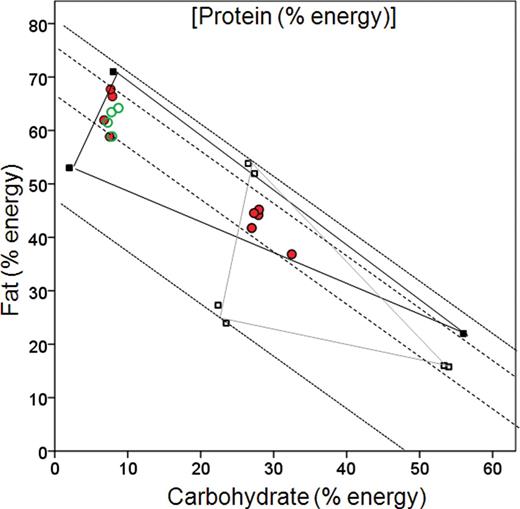
The proportional carbohydrate, fat, and protein compositions of the experimental foods used in the dry (hollow squares) and wet diet (filled squares) experiments, together with the nutrient intakes of dogs fed these foods (circles). In these plots, known as right-angled mixture triangles ( Raubenheimer 2011 ), 2 components of a 3-component mixture are represented in the normal way as x and y axes (in this case carbohydrate and fat, respectively), and the third component (in this case protein) varies inversely with the distance from the origin. Thus, 2 mixtures that have the same balance of fat:carbohydrate will fall on a line projecting from the origin, and the mixture with the higher protein content will be closer to the origin than the mixture with lower protein. The gray- and black-lined triangles show the areas that are accessible to dogs with access to the dry and wet foods, respectively. Red solid circles show intake points selected in the ESS phase and green hollow circles show mean intakes selected in the NSS phase (wet foods only) by the various breeds of dog. The dotted diagonals show the highest (closest to the origin) and lowest % protein energy potentially achievable by the dogs in the experiment. Dashed diagonals define the band of actual protein intakes of dogs during the experienced self-selecting phase. Dog breeds are not distinguished in the plot.
Target macronutrient balance—ESS
Statistical comparison of macronutrient intake in dogs in the wet and dry experiments is not appropriate because these experiments were done separately. There are nonetheless some interesting contrasts apparent from visual comparison of the scatter of the intake points self-selected by experienced dogs in the 2 experiments ( Figure 1 ). First, intakes of all of the dogs in the dry food experiment fell within the region of overlap between the 2 diet triangles, which was equally accessible to the dogs on both diet formats. However, dogs in the wet diet treatment did not select this region, suggesting that the composition selected by dogs on the dry foods was not a true macronutrient target but a constrained outcome imposed by the composition of the dry foods.
Rather, dogs in the wet diet treatments composed a diet that had similar protein concentration to those in the dry diet treatment (all dogs fell within the band spanning 25–35% total energy as protein), but was considerably lower in carbohydrate and higher in fat than dogs in the dry diet treatments. This pattern, taken together with the fact that dogs in the dry diet treatment selected intake points that were close to the minimum carbohydrate concentration available to them, suggests that the dry diets are appreciably higher in carbohydrate than the target diet composition. Indeed, even dogs on wet foods appear to have minimized the proportional carbohydrate content of their diet. Overall, these data suggest that the preferred diet composition of the dogs has low carbohydrate:fat balance, with between 25% and 35% of energy contributed by protein.
Although it appears that dogs were unable to achieve their target macronutrient composition from the choice of dry foods offered to them, the selected balance of percentage energy intake from protein, fat, and carbohydrate was not significantly different between the 5 breeds (fat: F(4,32.3) = 1.27, P = 0.303; protein: F(4,32.4) = 1.22, P = 0.323; carbohydrate: F(4,32.3) = 1.38, P = 0.261), suggesting that mechanisms for active regulation of macronutrient intake may be similar across these breeds. Total energy intake obviously increased in relation to the size of each breed of dog, with all breeds apart from PAP consuming >100% of their calculated MER ( Table 1 ) and over the course of the experiment body mass increased on average by 0.8% in PAP, 5.4% in MS, 11.1% in COS, 13.1% in LAB, and 4.6% in SB (for those dogs that completed the experiment).
Mean daily energy intake (kJ d −1 ) and percentage of maintenance energy requirement (%MER) consumed in 5 breeds of dog during ESS phase of the dry food experiments
| Breed | Energy intake (kJ d −1 ) | %MER a |
|---|---|---|
| PAP | 1010 (872–1149) | 96 (87–105) |
| MS | 3427 (3033–3821) | 146 (129–163) |
| COS | 4616 (4086–5147) | 164 (148–180) |
| LAB | 9979 (8941–11 019) | 168 (150–187) |
| SB | 11 705 (10 253–13 157) | 109 (95–124) |
| Breed | Energy intake (kJ d −1 ) | %MER a |
|---|---|---|
| PAP | 1010 (872–1149) | 96 (87–105) |
| MS | 3427 (3033–3821) | 146 (129–163) |
| COS | 4616 (4086–5147) | 164 (148–180) |
| LAB | 9979 (8941–11 019) | 168 (150–187) |
| SB | 11 705 (10 253–13 157) | 109 (95–124) |
Values shown are means with 95% CIs in parentheses. PAP, papillon; MS, miniature schnauzer; COS, cocker spaniel; LAB, Labrador retriever; SB, St Bernard.
a MER based on the calculation 460 kJ kg −0.75 .
The choice of wet foods removed the constraints on fat and carbohydrate intake and the estimated target intakes (kJ d −1 ) for protein, fat, and carbohydrate for each breed are shown in Table 2 . Similar to the situation seen in the dry food experiments, PAP consumed close to their calculated MER, whereas the other breeds all consumed >200% of their calculated MER ( Table 2 ) and over the course of the experiment body mass changed on average by −1.2% in PAP, +9.3% in MS, +8.4% in COS, and +11% in LAB (for dogs that completed the experiment). When the intake data were expressed as percentage of energy intake from protein, fat, and carbohydrate, there were small but statistically significant differences in the proportions of protein and fat (but not carbohydrate) selected by the 4 breeds (fat: F(3,27.7) = 10.51, P < 0.001; protein: F(3,27.9) = 6.5, P = 0.002; carbohydrate: F(3,27.9) = 1.57, P = 0.22). Figure 2 shows that this was principally due to PAP and COS composing a diet with a higher percentage of energy from protein and lower percentage of energy from fat than LAB and MS. The biggest difference observed was for percentage energy from fat between PAP and MS (8.8%, 95% CI 4.8–12.7). The average macronutrient energy composition of the diet self-selected by all dogs during the ESS phase of the wet food experiment was ca. 29% protein (95% CI 27.3, 30.9), 63% fat (62.0, 64.6) and 7% carbohydrate (6.4, 7.9).
Mean daily macronutrient and energy intake (kJ d −1 ) and percentage of maintenance energy requirement (%MER) consumed in 4 breeds of dog during ESS phase of the wet foods with variable protein, fat, and carbohydrate experiments
| Breed | Macronutrient energy intake (kJ d −1 ) | Total energy intake (kJ d −1 ) | %MER a | ||
|---|---|---|---|---|---|
| Protein | Fat | Carbohydrate | |||
| PAP | 365 (281–475) | 652 (476–894) | 79 (52–121) | 1114 (841–1477) | 108 (99–117) |
| MS | 1087 (920–1283) | 2973 (2436–3628) | 336 (257–439) | 4403 (3684–5262) | 208 (197–220) |
| COS | 2254 (1919–2648) | 4392 (3622–5327) | 435 (335–564) | 7172 (6034–8525) | 266 (247–285) |
| LAB | 3101 (2541–3785) | 7900 (6222–10 032) | 933 (676–1287) | 12 029 (9713–14 897) | 226 (208–244) |
Values shown are means with 95% CIs in parentheses. PAP, papillon; MS, miniature schnauzer; COS, cocker spaniel; LAB, Labrador retriever.
a MER based on the calculation 460 kJ kg −0.75 .
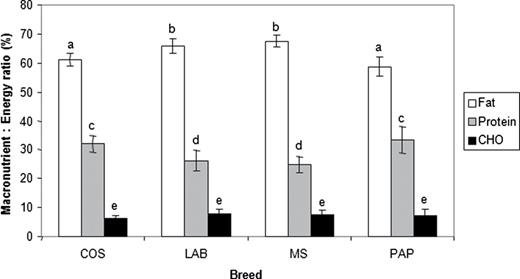
Mean macronutrient: energy composition (with 95% CI) of the diet composed from a choice of 3 wet foods with variable protein, fat, and carbohydrate content in the experienced self-selecting phase by 4 breeds of dogs (Experiment 2). COS, cocker spaniel; LAB, Labrador retriever; MS, miniature schnauzer; PAP, papillon. Letters a–e indicate homogenous breed groupings within a macronutrient at the 5% level (i.e., those macronutrients with the same letter are not significantly different between breeds).
NSS vs. ESS
A comparison of Phase 1 (NSS) and Phase 3 (ESS) of the experiments enabled us to assess the effects of experience gained in Phases 1 and 2 (monadic phase) on the nutrient selection by the dogs. In the dry food experiment (Experiment 1), however, dogs in Phase 1 frequently depleted 1 or more of the experimental foods, even though each was provided at 100% of estimated MER. Consequently, the composition of the selected diet partly reflected an unanticipated constraint due to the experimental design and could thus not be interpreted to indicate the ad libitum selected macronutrient balance. The patterns of food depletion did, however, provide information about the nutritional regulatory priorities of the dogs. Figure 3 shows that the majority of depletions involved the pFc food, which supports the conclusion reached from our analysis of the ESS phase (above), that the target diet has a higher fat:carbohydrate ratio than was available to dogs on the dry food treatments.
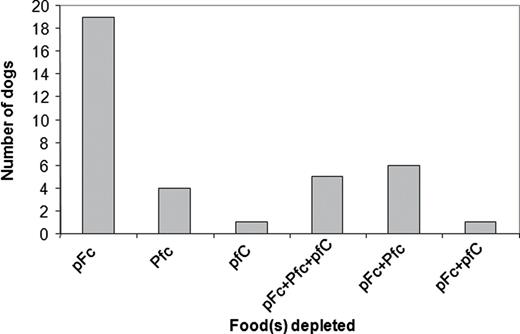
Frequencies at which various individual foods and 2- and 3-way combinations of foods were depleted in the NSS phase of the dry foods experiment (Experiment 1).
Comparison of nutrient selection in the NSS and ESS phases of the wet foods experiment suggested that when fed wet foods, naive dogs selected a region in nutrient space that was close to the target region ( Figure 1 ). Closer inspection, however, revealed that on average (i.e., over all 4 breeds) there was a small but statistically significant decrease in the percentage of energy intake from protein ( F(1,28.7) = 8.27, P = 0.008) and increase in percentage of energy intake from fat ( F(1,29.1) = 12.17, P = 0.002) in the ESS phase compared with the NSS phase, whereas carbohydrate intake did not differ ( F(1,29.3) = 0.59, P = 0.449) ( Figure 4 ). The breed effect seen in the ESS analysis reported above was also seen in the NSS phase, but the phase by breed interaction was not significant, indicating that the differences seen between breeds were consistent between NSS and ESS.
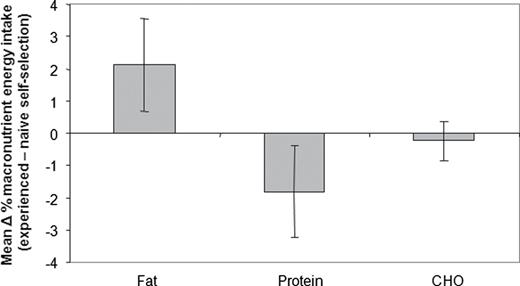
Effect of experience on the proportional macronutrient content of the self-selected diet of 4 breeds of dog in the 3-choice wet food experiment (Experiment 2). The plot shows the mean differences (with 95% CI) in percentage energy intake from fat, protein, and carbohydrate (CHO) between the experienced and NSS phases. A positive value thus indicates that experience resulted in an increase in proportional intake of that macronutrient.
Experiment 3: wet foods—fixed protein
The diet compositions and selected intakes of dogs in NSS and ESS phases of the wet foods, variable protein experiment, are shown in Figure 5 . Unlike Experiments 1 and 2, where choices involved 3 foods and the dogs could thus move freely within a triangle ( Figure 1 ), the dogs in this experiment had 2-way choices and were thus confined to move along the line joining the composition points for the 2 foods in their respective diet pairings (X + Y, Y + Z, and X + Z).
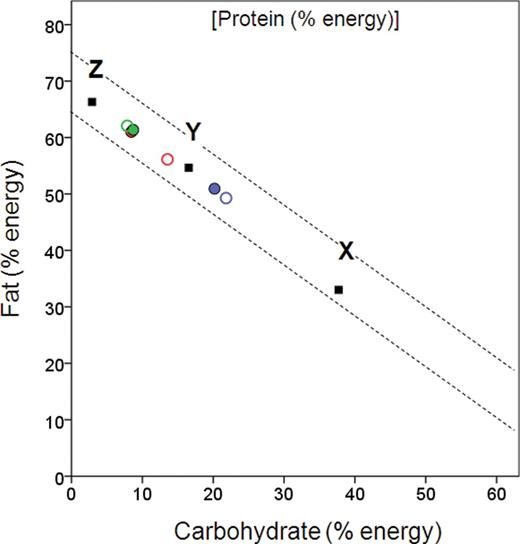
Right-angled mixture triangle showing proportional protein, fat, and carbohydrate intakes of miniature schnauzers fed wet format diets with variable fat:carbohydrate balance and protein content fixed at ~30% of energy (Experiment 3). Solid squares show the composition of the 3 foods: X = low fat:carbohydrate; Y = intermediate fat:carbohydrate; Z = high fat:carbohydrate. Colors represent different diet pairings (blue = X + Y; green = Y + Z; red = X + Z), and symbols distinguish different phases in the experiment (hollow circles = NSS; filled circles = ESS). The diagonal lines show the minimum and maximum selected proportional protein intakes from the variable protein, fat, and carbohydrate wet and dry experiments, as in Figure 1 .
Target macronutrient balance—ESS
Figure 5 shows that in the ESS phase the dogs in the Y + Z and X + Z treatments selected a diet that was tightly convergent (mean % energy intake from fat: Y + Z = 61.2 [95% CI 59.7, 62.8]; X + Z = 60.8 [58.7, 63.0], P = 0.759. Mean % energy from carbohydrate: Y + Z = 7.9 [6.8, 9.2]; Z + X = 6.3 [5.2, 7.7], P = 0.063). This point corresponds very closely to the selected intake point by dogs in the 3-way choice of wet foods ( Figure 1 ), providing further support that this represents the selected target balance of dogs in our experiment. The macronutrient balance selected in Y + Z and X + Z pairings was significantly different from the macronutrient balance selected in the X + Y food pairing (mean % energy intake from fat: X + Y = 50.8 [49.2, 52.4]; Y + Z = 61.2 [59.7, 62.8], P < 0.001; X + Z = 60.8 [58.7, 63.0], P < 0.001. Mean % energy from carbohydrate: X + Y = 20.1 [18.0, 22.4]; Y + Z = 7.9 [6.8, 9.2], P < 0.001; Z + X = 6.3 [5.2, 7.7], P < 0.001). This reflects that dogs in the X + Y treatment could not move closer to the target point than the point representing the composition of food Y, and their intake thus represents a constrained compromise.
NSS vs. ESS
Mixed-model analysis revealed a significant phase effect ( P < 0.001) and a significant phase by diet–pair interaction ( P < 0.001) indicating that differences in fat and carbohydrate energy intake seen between phases were not consistent between the different diet pairings. Thus, in pairing Y + Z (the 2 foods that were closest together and encompassed the target) the intakes for both self-selection phases of the experiment were superimposed ( Figure 5 , green circles) and there was no significant difference in the % energy intake from fat (and hence carbohydrate, because protein density was held constant in the foods and therefore changes in the proportion of fat energy in the food were offset by carbohydrate energy) between NSS and ESS ( Figure 6 ). In contrast, the largest difference in % energy intake from fat between NSS and ESS phases (5.5%, 95% CI 2.9, 8.1; Figure 5 , red circles) was seen in food pairing X + Z (the 2 foods furthest apart; P < 0.001; Figure 6 ), whereas the difference in % fat energy intake between ESS and NSS for pairing X + Y, which did not encompass the target, was intermediate between the other diet pairings ( Figure 5 , blue circles; Figure 6 ).
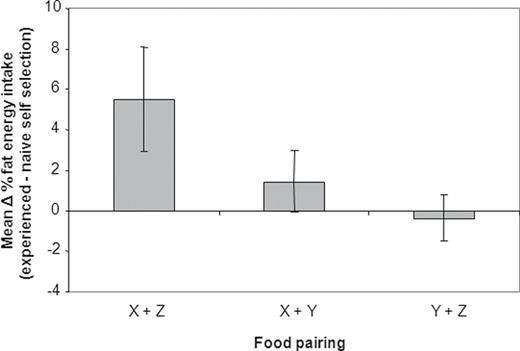
Effects of experience on the proportional fat content of the selected diet of miniature schnauzers fed different food pairings (see Figure 5 ; Experiment 3). The plot shows the mean (with 95% CI) of the difference in proportional fat intake in the selected diet of dogs between the experienced and NSS phases. A positive value thus indicates that experience resulted in an increase in proportional fat intake. Because in this experiment the proportion of protein in the diets was fixed, changes in proportional fat intake are exactly offset by changes in carbohydrate content and for this reason carbohydrate is not presented.
Discussion
Evolutionary perspectives
We have investigated the selection by domestic dogs of the macronutrient balance as well as metabolizable energy content of their diet. Diet selection in animals has long been evaluated in relation to energy intake, but research over the past 2 decades has demonstrated a critical role for macronutrient balance ( Raubenheimer et al. 2009 ). This work, involving a wide range of animals, has linked macronutrient balance to many aspects of evolutionary fitness, including growth rates and size ( Raubenheimer and Simpson 1997 ; Simpson et al. 2004 ), obesity ( Simpson and Raubenheimer 2005 ; Warbrick-Smith et al. 2006 ), fecundity ( Lee et al. 2008 ), longevity ( Piper et al. 2011 ), disease resistance ( Cotter et al. 2010 ), sexual advertisement ( Maklakov et al. 2008 ), and risk of predation ( Hawlena and Schmitz 2010 ).
Such results underpin a strong expectation that animals would have evolved by natural selection an ability to balance their macronutrient intake through selecting appropriate foods and combining them in the required proportions. It has long been expected that herbivores and omnivores would possess such mechanisms, based on the premise that these animals generally feed on nutritionally imbalanced and variable foods ( Westoby 1978 ). Carnivores, in contrast, are widely assumed to feed on nutritionally balanced and relatively invariant foods, and therefore not to require the mechanisms for regulating the balance of macronutrient intake ( Westoby 1978 ). However, several recent experiments involving both invertebrate and vertebrate predators have demonstrated that they do, indeed, regulate their intake of foods to balance the gain of macronutrients, and that failure to do so can result in fitness penalties ( Mayntz et al. 2005,, 2009 ; Raubenheimer et al. 2007 ; Wilder and Rypstra 2008 ; Hewson-Hughes et al. 2011 ; Jensen et al. 2011,, 2012 ). We therefore expected that the same would be true of domestic dogs.
Dogs are interesting with regard to the evolution of nutritional strategies because of their peculiar evolutionary history ( Akey et al. 2010 ). Derived from Eurasian gray wolves, domestication began over 14 000 years ago, and much more recently dogs have undergone an intense period of artificial selection generating phenomenal phenotypic divergence among the more than 400 breeds ( Akey et al. 2010 ). There are therefore at least 3 clearly identifiable periods in the evolutionary history of extant domestic dogs, each characterized by different environmental and selective circumstances: predomesticated wolf ancestry, early domestication, and rapid artificially selected diversification. Successive periods of different selection pressures can each leave a distinct imprint on the nutritional regulatory responses of a species. Different aspects of the nutritional biology of humans, for example, can be traced to our catarrhine primate ancestry ( Milton 2000 ), our Palaeolithic hunter-gather prehistory ( Lindeberg et al. 2003 ), and the rapid changes in nutritional ecology wrought by agriculture ( Beja-Pereira et al. 2003 ; Burger et al. 2007 ). Although a good deal of more research is needed, our study provides some interesting pointers as to how the various stages of the evolution of domestic dogs might have influenced their pattern of macronutrient selection, the subject to which we now turn.
Macronutrient selection
Our results showed, as expected, that dogs do indeed regulate the macronutrient balance of their diet. In all experimental treatments where it was possible, the diets of experienced self-selecting dogs converged on an intake with approximately one-third of energy derived from protein and a low carbohydrate:fat ratio. These treatments comprised the wet foods, 3-way diet choice experiment (Experiment 2; Figure 1 ), and 2 of the treatments (Y + Z and X + Z) in the wet foods, fixed protein 2-way diet choice experiment (Experiment 3; Figure 5 ). Substantially different diet compositions were selected only by the dogs in the dry foods experiment (Experiment 1), and in the X + Y pairing of the fixed protein experiment (Experiment 3), both of which were constrained by available foods from reaching the point of convergence. Dogs in the dry food experiment also selected a diet with between 25% and 35% protein, but with a fat:carbohydrate ratio that was close to the maximum possible given the available diet choice. When the protein content was fixed at 30% in wet foods, the dogs with diet pairing X + Y similarly selected a diet with a fat:carbohydrate ratio close to the maximum possible given their diet pairing. Taken together, these results suggest that the target diet of dogs in our study consists of approximately 30% of energy from protein, 63% of energy from fat, and 7% of energy from carbohydrate.
Two previous studies have investigated macronutrient intake in domestic dogs. Romsos and Ferguson (1983) offered 2-year-old female beagles ad libitum access to 1 of 2 pairings of 3 foods differing in protein content. The foods contained metabolizable nutrient energy proportions of 20:38:42 (protein:fat:carbohydrate) (food 1), 25:55:20 (food 2), and 46:27:27 (food 3). Dogs were offered a choice between foods 1 and 3, or foods 2 and 3. In both cases dogs selected 30% of energy as protein, which is consistent with the results of our study, although it is not possible to discern the roles of fat and carbohydrate from the experimental designs used. In a more recent study, Tôrres et al. (2003) confined beagles to 1 of 5 choices between 2 isocaloric foods differing in protein content (0% vs. 25%, 9% vs. 32%, 18% vs. 32%, 18% vs. 48%, or 25% vs. 48%). Again in agreement with our study, the dogs adjusted their food choices to maintain dietary protein intake at close to 27% of metabolizable energy.
An interesting finding of our study is the remarkable consistency in the proportional composition of the target diet across breeds. In the dry diets experiment, there was no significant difference between breeds in proportional macronutrient composition of the selected diet, whereas breed explained a small but significant proportion of the variance in the 3-choice wet diet experiment. Assuming that the discrepancy between breeds is robustly associated with the different food formulations, this would suggest that when fat is limiting and carbohydrate excessive (i.e., dry foods) all breeds prioritize maximizing proportional fat intake whereas when fat is not limiting (wet food formulations) different breeds are able to express preferences for their respective macronutrient targets. It is unclear, however, why LAB and MS should select slightly higher fat and lower protein than PAP and COS; expanding the study to a wider range of breeds would provide a more substantial comparative perspective which could shed light on this question. In the meantime, however, the overriding conclusion is that the recent rapid divergence among dog breeds is not substantially reflected in their macronutrient priorities compared with other phenotypic features such as size, color, and temperament.
In contrast with the similarity between dog breeds, experiments have shown that some more distantly related vertebrate carnivores select a diet with very different macronutrient balance than the P:F:C balance of 30:63:7 selected by the dogs in our study. Using a similar experimental protocol to the present study, Hewson-Hughes et al. (2011) found that domestic cats selected a diet that is substantially higher in protein and lower in fat (52:36:12). Interestingly, a subsequent meta-analysis showed that the diets of free-roaming feral cats also comprised 52% of energy from protein. On the other hand, the relative contributions of fat and carbohydrate to the energy intake of feral cats (46% and 2%, respectively) differed from the 36%:12% selected under experimental conditions in the study of Hewson-Hughes et al. (2011) , a difference to which we return below.
Why should cats select a diet with higher proportional protein and lower proportional fat content than dogs? In common with all of the extant members of the cat family, domestic cats are metabolically reliant on a diet that in the wild can be satisfied by eating largely vertebrate prey ( Bradshaw 2006 ). Because historically very few households would regularly have had surplus meat or fish, there was up until recently strong selection pressure on cats to satisfy their specialized nutrient needs through hunting small vertebrates ( Bradshaw 2006 ), which typically have a high protein:fat content. For example, the data on body compositions of several species of typical prey of domestic cats presented by Eisert (2011) range from 33% energy from protein (common vole) to 68% energy from protein (bank vole), with a midpoint of 50.5% which is very similar to 52% selected both by domestic cats in experimental conditions ( Hewson-Hughes et al. 2011 ) and free-roaming feral cats ( Plantinga et al. (2011) . Domesticated dogs, in contrast, have not been under the same constraint and would have relied on a wider range of human-provided foods during the process of domestication. Furthermore, being social hunters, the wolf ancestors of domestic dogs were able to utilize larger prey. Because the proportional body fat content of mammals increases with size ( Prothero 1995 ), the fat:protein balance of the diet of the ancestors of domestic dogs would likely have been higher compared with the small, solitary-hunting ancestor of domestic cats. Finally, compared with dogs, the domestication of cats is very recent (possibly <200 years B.P.) and might be incomplete ( Driscoll et al. 2009 ). This is reflected in the minimal morphological divergence of domestic cats from their wildcat ancestors ( Driscoll et al. 2009 ) and might also explain the similarity in the protein content of experimentally selected and wild diets.
Interestingly, however, Darwin (1868) noted that domestic cats have longer intestines than wildcats, a difference he attributed to a less carnivorous diet associated with feeding on kitchen scraps. If Darwin is correct on this, then the intensification of artificial selection for divergent morphology in cats, initiated in the Victorian era, might also have had nutritional implications. This could explain why cats in the experiments of Hewson-Hughes et al. (2011) , although selecting a similar proportion of protein in the diet as feral cats in the wild ( Plantinga et al. 2011 ), selected a higher proportion of carbohydrate (12% vs. 2%, respectively). If the 1.7% average carbohydrate content of the 8 species of small vertebrate prey listed by Eisert (2011) is representative, then feral cats would be ecologically constrained from achieving an intake of 12% carbohydrate even if this did reflect an artificially selected dietary preference. But why, if the macronutrient preference of cats has been evolutionarily altered since Victorian times, has comparable divergence not taken place among the diverse breeds included in our study? Owing to the longer history of dog domestication, it is likely that the pattern of macronutrient selection in domesticated dogs had already diverged significantly from their wolf ancestors by 200 years ago when artificial selection intensified ( Wayne and vonHoldt 2012 ), and all of the breeds in our study were derived from a common ancestor that was already “adapted” to a human-associated diet.
Several species of carnivorous fishes have also been found to select a diet high in protein (ca. 55%— Ruohonen et al. 2007 ). By contrast, an obligate predator, the mink, selects a diet more similar to that of dogs, consisting of 35% protein by energy ( Mayntz et al. 2009 ). This is interesting, because like cats mink feed on small vertebrates and therefore almost certainly have a natural diet that is higher in protein than the self-selected preference. It is possible, however, that the macronutrient preference of the mink in the experiments of Mayntz et al. (2009) is not representative of their wild counterparts, but influenced by artificial selection in captivity. Suggestively, the standard diet of the experimental population, which had been in captivity for 75 generations, contained 32% protein, which is very similar to the 35% self-selected by these animals. An equivalent example of tight adaptation in captive-bred animals to the macronutrient composition of the diet has been described by Warbrick-Smith et al. (2009) .
Effects of experience
Experiments on herbivorous ( Simpson and White 1990 ; Raubenheimer and Tucker 1997 ) and omnivorous ( Gadd and Raubenheimer 2000 ) insects have demonstrated that learning can play an important role in balancing macronutrient gain. Recently, Hewson-Hughes et al. (2011) showed that adult domestic cats offered a 3-way choice between foods varying in the protein, fat, and carbohydrate content selected a diet higher in protein and lower in carbohydrate following experience with the diets than when naive. The dogs in the present experiments similarly selected a different macronutrient balance when experienced (ESS) than when naive (NSS), both in the 3-choice wet food study and the 2-choice fixed protein study. In the 3-choice study, experienced dogs selected a significantly higher proportion of fat and lower proportion of protein in ESS than NSS, with no significant difference in the proportion of energy from carbohydrate. In the 2-choice study, dogs similarly selected a higher proportion of energy from fat in ESS than NSS ( Figure 6 ), but in this case the proportion of protein was fixed and fat thus displaced carbohydrate. It seems, therefore, that the main effect of experience with the experimental foods was to enable the dogs to increase the proportional contribution of fat to the diet. Interestingly, the effect of experience in cats and dogs thus echoes the relative proportions of different macronutrients in the target diet, with cats learning to increase the proportional protein content of the diet, and dogs the proportional fat content.
Results of the 2-choice fixed protein study suggested that the role of learning was dependent on diet pairing ( Figures 5 and 6 ). There was no significant difference in proportional fat intake for dogs given the Y + Z pairing, indicating that the dogs were able to regulate to the target point even when first exposed to the experimental foods (in the NSS phase). In contrast, when given food pairing X + Z, which also encompassed the macronutrient target but had widely discrepant fat:carbohydrate balances, the dogs only reached the target composition when experienced (in ESS) and when naive ingested a low fat:carbohydrate diet. Learning similarly played a role for dogs given the Y + X diet pairing, which comprised foods less dissimilar than the X + Z pairing but did not encompass the target balance. In this case, the compositions of the foods precluded the dogs from achieving the target balance, but they approached the target balance more closely when experienced. It is interesting to speculate on why the need for learning should be context dependent in this way. The common factor in the 2 treatments that did require learning is that both involved food X, which had a high carbohydrate:fat (38%:33%) balance. It is plausible that the reason that learning was required on these 2 diet pairings is that short-term regulatory mechanisms, which enabled inexperienced dogs to reach the target when given food pairing Y + Z, are ineffectual on extreme foods with carbohydrate:fat balance as high as food X because they are beyond the evolutionary experience of dogs. In such circumstances more general mechanisms, such as positive associative and aversion learning, might be required to enable dogs to meet their macronutrient target ( Berthoud and Seeley 2000 ).
Energy intake
Whereas the evidence is compelling that dogs regulated the relative proportions of protein, carbohydrate, and fat in the diet, it was apparent that the total amount of food and energy eaten was far higher than expected. In fact, as set out in the Methods, we had to make various adjustments in food provisioning to ensure that our subjects were maintained under conditions of excess food availability. The daily metabolizable energy requirement for adult dogs at maintenance (i.e., to support energy equilibrium) recommended by the NRC is 544 kJ kg −0.75 (130 kcal kg −0.75 ) although it is recognized that there is considerable individual variation, even between dogs kept under the same conditions ( NRC 2006 ). In the present studies, we used 460 kJ kg −0.75 (110 kcal kg −0.75 ) as the basis for calculating the “maintenance” amount of food to offer the dogs and for expressing their subsequent energy intake relative to their “maintenance” requirement. Our results show that of the breeds used in these studies, MS, COS, and LAB all consumed well in excess of their calculated energy requirement during the self-selection phases of both dry (146%, 164%, and 168% of MER, respectively) and wet (208%, 266%, and 226% of MER, respectively) food experiments. When offered ad libitum access to 2 different diet pairings, adult beagles consumed similar amounts of energy (~5100 and 5400 kJ d −1 ) in both choice treatments over the course of the 4-week experiment ( Romsos and Ferguson 1983 ). The authors concluded that dogs regulate both protein (see above) and total energy intake when offered appropriate food choices. It is interesting to note that the energy intake at which the beagles “regulated” their intake in both choice treatments was approximately 208% and 224% of MER (based on 460 kJ kg −0.75 )—similar to the values seen in dogs in the wet choice experiments in the present study.
These findings may reflect the feeding behavior of the wild ancestors of domestic dogs, wolves. Wolves may only kill prey every few days or even less frequently and therefore are adapted to a feast or famine foraging pattern, facing great uncertainty in the availability and intake of protein and energy. Hence, it is not surprising that when wolves do make a kill they can consume large amounts of food, enabling them to sustain periods of limited or no food availability. A minimum daily food requirement of 3.25kg wolf −1 d −1 (5× basal metabolic rate) has been estimated for a 35kg wolf ( Peterson and Ciucci 2003 ) and consumption rates of 5.7kg wolf −1 d −1 and 10.4kg wolf −1 d −1 have been estimated for larger wolves (~45kg) depending on kill rates ( Stahler et al. 2006 ). It seems that dogs still have this propensity to ingest a large amount of food/energy if given the opportunity. However, now that they are domesticated and have regular access to food with no need to expend energy obtaining it, it is easy to see how dogs could become overweight if the amount of food offered is not controlled.
CONCLUSIONS
Our study has added to the growing list of experiments demonstrating that carnivores, like herbivores and omnivores, are able to combine foods of varying composition to compose a diet of fixed macronutrient balance. The diet composed by the dogs in our study (P:F:C = 30:63:7) was lower in protein-derived energy than previous studies have demonstrated for the domestic cat and predatory fishes, but comparable to farmed mink. Many interesting questions remain regarding the origins of the diversity of nutritional priorities among predators. In domesticated animals, these questions are complicated but particularly interesting because of the different timescales involved (predomestication, early domestication, and recent), and a considerable amount of work remains to be done before robust generalizations regarding the influence of the different periods can be drawn. On a shorter timescale, there are many interesting questions concerning the contributions of genetically evolved regulatory responses versus the role of individual experience. The finding in the present study that macronutrient selection in dogs is influenced by experience, combined with our earlier demonstration that the same is true for cats, demonstrates the need for integrated studies that span timescales from the evolutionary to the developmental. Finally, the present study has focused on macronutrition, based on a large body of data showing that protein, fat, and carbohydrates exert a powerful influence on the nutritional responses of many animals ( Simpson and Raubenheimer 2012 ). We suggest that nutritional geometry provides a powerful framework for future studies to investigate the roles of micronutrients (e.g., minerals) in the dietary responses of companion animals and their interactions with macronutrients.
SUPPLEMENTARY MATERIAL
Supplementary material can be found at Supplementary Data
FUNDING
This work was funded by the WALTHAM Centre for Pet Nutrition, part of Mars Petcare. D.R. is part-funded by the National Research Centre for Growth and Development, New Zealand. S.J.S. was supported by an Australian Research Council Laureate Fellowship.
The authors would like to acknowledge the skills and expertise of many people at the WALTHAM Centre for Pet Nutrition involved in feeding and caring for the dogs in these experiments. The technical assistance of Matthew Gilham and Gaëlle Thomas is greatly appreciated.
References
