


Abstract
Although there has been great progress in cancer treatment, cancer remains a serious health threat to humans because of the lack of biomarkers for diagnosis, especially for early-stage diagnosis. In this study, we comprehensively surveyed the specifically expressed genes (SEGs) using the SEGtool based on the big data of gene expression from the The Cancer Genome Atlas (TCGA) and the Genotype–Tissue Expression (GTEx) projects. In 15 solid tumors, we identified 233 cancer-specific SEGs (cSEGs), which were specifically expressed in only one cancer and showed great potential to be diagnostic biomarkers. Among them, three cSEGs (OGDH, MUDENG and ACO2) had a sample frequency >80% in kidney cancer, suggesting their high sensitivity. Furthermore, we identified 254 cSEGs as early-stage diagnostic biomarkers across 17 cancers. A two-gene combination strategy was applied to improve the sensitivity of diagnostic biomarkers, and hundreds of two-gene combinations were identified with high frequency. We also observed that 13 SEGs were targets of various drugs and nearly half of these drugs may be repurposed to treat cancers with SEGs as their targets. Several SEGs were regulated by specific transcription factors in the corresponding cancer, and 39 cSEGs were prognosis-related genes in 7 cancers. This work provides a survey of cancer biomarkers for diagnosis and early diagnosis and new insights to drug repurposing. These biomarkers may have great potential in cancer research and application.
Introduction
Cancer is a major public health problem worldwide that seriously threatens human life [1]. Late-stage diagnoses and limited time for treatment are the main reasons for the low survival rates from cancer [2]. Therefore, the early and accurate detection of cancer is very important for clinical diagnosis. At present, cancer biomarkers, which can be used not only in diagnosis but also in prognosis and therapy, are in the spotlight as one solution. However, current cancer biomarkers usually lack specificity and sensitivity [3]. For example, Alpha Fetoprotein (AFP), a gold standard for the diagnosis of liver cancer, is widely used in cancer diagnosis; however, it is not only specific to cancer but also occurs in patients with chronic hepatitis infection [4, 5]. In addition, human epidermal growth factor receptor-2 (HER2/erbB-2), an established marker of breast cancer, is also overexpressed in other cancers including ovarian, lung, gastric and oral cancers [6, 7]. These examples demonstrate that many cancer genes are expressed in various tissues and/or diseases [8]. Thus, there is still a challenge and urgent need to identify new markers with high sensitivity and specificity for cancer diagnosis.
Specifically expressed genes (SEGs) are expressed only in a small number of specific tissues. Thus, SEGs are of naturally high specificity and sensitivity [9]. Previous studies revealed that many diseases are associated with SEGs, suggesting SEGs may serve as biomarkers for disease diagnosis [10]. Many SEGs have been reported to play important roles in corresponding tissues, such as CDH17 in the colon and SOX2 in the brain [11]. In addition, many diseases are related to tissue-specific genes, and thousands of genes affect hundreds of diseases in more than 70 tissues [10]. Luckily, a great deal of expression data has been gathered for various cancer types and normal tissues and stored in databases, such as The Cancer Genome Atlas (TCGA) and Genotype–Tissue Expression (GTEx). This has made it possible to analyze cancer SEGs [12, 13]. We also constructed tools to perform expression analysis, such as the Gene Set Cancer Analysis (GSCALite) [14] and Gene Expression Display Server [15]. Recently, we published a method called SEGtool that detects SEGs automatically and self-adaptively with high specificity and sensitivity in RNA-Seq data [16]. To date, several SEG databases have paid attention to SEGs and their functions, such as the TissGDB [17], PaGenBase [18] and HOMER [19]. More recently, we published the SEGreg database based on SEGs identified by SEGtool and combined their miRNA and transcription factor (TF) regulation in each cancer and normal tissue [20]. However, there is still a lack of studies on cancer-specific SEGs (cSEGs) for biomarker identification, especially for early-stage cancers. Increasing the amount of research on cSEGs will be very important for improving cancer diagnosis.
In this study, based on our SEGtool and SEGreg, we identified cSEGs that were highly expressed in only one cancer type using TCGA cancer transcriptome data. In addition, we obtained a list of single-gene markers and two-gene markers for cancer diagnosis and even early-stage diagnosis. Moreover, based on cSEGs, we propose some potential drugs for cancer treatment. This research may provide novel cancer biomarkers in cancer diagnosis and therapy.
Materials and methods
Data description
In this study, transcriptome data (RNASeq2 level III RSEM data), after adjusting batch effects, were from the PanCanAtlas page (https://gdc.cancer.gov/about-data/publications/pancanatlas) [21] and clinical information across 33 cancer types was obtained from the TCGA portal (https://tcga-data.nci.nih.gov/tcga/). In total, we obtained a gene expression matrix of 9744 cancer samples and 727 paracancerous tissue samples from the TCGA portal. There are 24 cancer types with both cancer and paracancerous tissue samples. In addition, we downloaded the transcripts per million normalized gene expression data of 55 normal tissues from the GTEx portal (http://gtexportal.org). Then, we merged different parts of some sub-organs or sub-tissues. For example, adipose-subcutaneous and adipose-visceral (omentum) were merged into adipose tissue. In another example, brain-anterior cingulate cortex (BA24), brain-caudate (basal ganglia), brain-cerebellar hemisphere, brain-cerebellum, brain-cortex, brain-frontal cortex (BA9), brain-hippocampus, brain-hypothalamus, brain-nucleus accumbens (basal ganglia), brain-putamen (basal ganglia), brain-spinal cord (cervical c-1) and brain-substantia nigra were merged into brain tissue. Finally, we obtained the expression matrices of 30 tissues. The number of tumor and paracancerous samples for each cancer type is shown in Table S1.
Identification of SEGs and cSEGs
We used R package ‘SEGtool’ to identify SEGs (default parameters, P-value <0.05) in TCGA and GTEx data [16]. Specifically, we applied the replicating-value integration, a built-in function of SEGtool, to calculate the expression of each gene in 57 cancer and paracancerous tissues. Then, we integrated the gene expression of 33 cancer tissues and 24 paracancerous tissues into an input matrix. Although SEGtool can detect genes with specifically high and low expression, we only used the SEGs with high expression in this study for further investigation.
cSEGs are SEGs that are highly and specifically expressed in only one cancer type but not expressed in all paracancerous and normal tissues. To obtain cSEGs, we first used the GTEx data to identify SEGs in each normal tissue, and only 19 TCGA cancer types could be matched with GTEx normal tissues (Table S2). Among them, 15 solid tumors have cSEGs and another 4 cancers have no cSEGs.
Calculation of high expression frequency
To measure the sensitivity of a SEG, we calculated its frequency of high expression, which is the ratio of samples having the SEG. Considering that the ‘replicate score’ of gene expression was used in SEG detection in the above procedures, to measure whether the SEG(s) were generally highly expressed in samples, we examined the distribution of the expression profile for each SEG. We calculated the number of non-redundant samples in which the expression value of the SEG(s) was more than 0.8× the corresponding ‘replicate score’, and the ratio of these samples to total samples was called the frequency of high expression of SEGs. Chi-square test was applied to evaluate the significance of two-gene combinations.
Identification of early-stage markers
First, we obtained the sample cancer stages (T1, T2, T3 and T4) according to the clinical information of each sample and constructed an expression matrix for the T1–T4 stages in 23 cancers with stage data, 10 cancers without stage data and 24 paracancerous tissues. Then, we selected SEGs in each cancer stage using SEGtool and the T1 stage SEGs but not normal and paracancerous tissue SEGs were regarded as early-stage cSEGs. The early-stage cSEGs may be also highly expressed in T2–T4 stages of that cancer, so that would not affect our results. Finally, we screened markers for early-stage diagnosis from those early-stage cSEGs by screening those that had a frequency of high expression of >50%. We also calculated the frequency of high expression of two genes and selected a list of two-gene markers.
Definition of two-gene markers
For a two-gene marker, if one of two genes is highly expressed in a sample, then the sample is regarded as a highly expressed sample of the two-gene marker. The ratio of the highly expressed sample of the two-gene combination was calculated by the number of highly expressed samples to divide the total number of samples. In other words, for a certain cancer type that contains N cancer samples, if Gene1 has N1 highly expressed samples (the sample set as S1) and Gene2 has N2 highly expressed samples (the sample set as S2), then the high expression frequency of the two-gene marker (Gene1 and Gene2) is (S1∪S2)/N. In this study, the two-gene markers were expected to be more sensitive than single-gene markers, and the Chi-square test was employed to evaluate the power of the two-gene combinations compared with the single one.
Analysis of survival markers, drug targets and regulation
For the survival analysis of each marker gene, we divided samples into high and low expression groups by each marker gene’s median expression level. The overall survival (OS) was defined as the time from diagnosis to death or last clinical follow-up. The Kaplan–Meier method within the R package ‘survival’ and the log-rank test were used to assess statistical significance, and the cutoff of significance was P < 0.05. We also collected US FDA-approved anticancer drugs and their targets from DrugBank [22] and mapped these drug targets to SEGs in our analyzed cancer types. Based on the regulatory relationship of TF-targets that we collected from ChIP-Seq and the binding site prediction in the hTFtarget database (http://bioinfo.life.hust.edu.cn/hTFtarget/) [23], we constructed a regulatory network of TF-targets for SEGs and visualized it using Cytoscape (version 3.5).
Results
Landscape of SEGs in 34 TCGA cancer types
First, we comprehensively surveyed SEGs that were highly expressed in single and multiple tissues across 33 cancer types (Figure 1A), 24 paracancerous tissues from TCGA and 30 normal tissues from the GTEx, respectively. As a result, we identified 2558 SEGs highly expressed in 33 cancers, and 1075 of them highly expressed in only one cancer type (Figure 1B, Table S3). The number of SEGs for each cancer type was markedly different, indicating the heterogeneity of these cancers. Most cancers had fewer than 100 SEGs. Some cancers related to the nervous system (GBM, LGG and PCPG), hematological system (DLBC and LAML) and reproductive system (TGCT) had more than 100 SEGs, indicating their specialized systems and diseases. We also detected 4035 SEGs across 24 paracancerous tissues (Figure 1C). Among these SEGs, 1081 SEGs were in single paracancerous tissues and GBM (glioblastoma) had the most SEGs in its paracancerous tissue, whereas several paracancerous tissues, such as KIRC, STAD and UCEC, had no SEGs highly expressed in their single tissues. Furthermore, we identified 3281 SEGs across 30 GTEx normal tissues and 1601 SEGs in single normal tissues (Figure 1D). Among these tissues, testis tissue had the most SEGs.
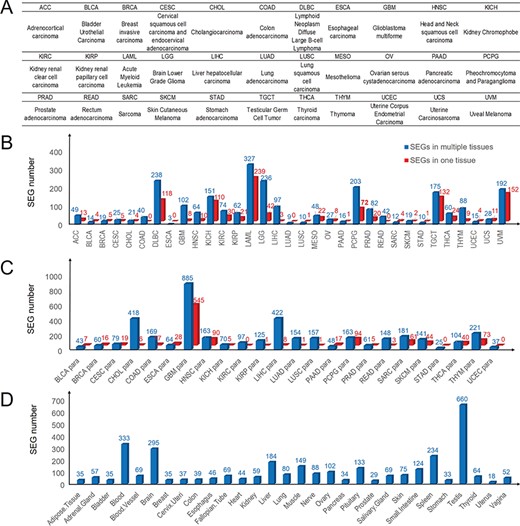
Landscape of SEG distribution in cancers and paracancerous and normal tissues. (A) Abbreviations and full names of 33 TCGA cancer types. (B) Numbers of SEGs in 33 cancers. (C) SEG numbers in 24 paracancerous tissues. (D) Numbers of SEGs in 30 normal tissues. Blue and red bars denote SEGs in multiple tissues and single tissues, respectively.
Identification of cSEGs as diagnosis markers in solid tumors
cSEGs are defined as SEGs specifically and highly expressed in only a single cancer, but not highly expressed in other cancers, paracancerous tissues or normal tissues (Figure 2A). Because 19 TCGA cancer types were matched with 15 normal tissues in the GTEx, we focused on the 19 cancer types. In 15 solid tumors, we identified 233 cSEGs that may serve as diagnostic biomarkers (Figure 2B). To obtain cancer biomarkers with high specificity and sensitivity, we calculated the frequency of highly expressed samples to measure the sensitivity of cSEGs. Interestingly, three cSEGs (OGDH, MUDENG and ACO2) with the highest high expression frequency (>80%) were identified in KICH (kidney cancer) (Figure 2B). In addition, 43 cSEGs with high expression frequency (>70%) were identified and 38 of these cSEGs belonged to KICH. Conversely, very few cSEGs (less than 5) with a frequency of high expression of >50% were detected in seven cancer types, e.g., EFNA1, AKR1C3 and GPC3 in LIHC (liver cancer; Figure 2B).
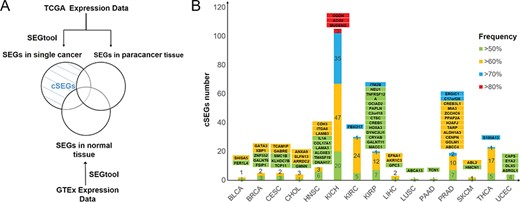
cSEG screening and distribution in 15 cancers. (A) Flow chart of screening cSEGs. (B) Numbers and frequency pattern of cSEGs in 15 cancers. Green, yellow, blue and red bars denote cSEGs with a frequency of high expression higher than 50%, 60%, 70% and 80%, respectively. Gene names with background colors are the corresponding genes with the same color in the bars below.
To explore whether the identified cSEGs were highly specific and had the potential to be diagnostic biomarkers, we compared our identified BRCA (breast cancer) cSEGs (GATA3 and XBP1) with three established biomarkers (ESR1, PGP and ERBB2) in BRCA [24]. GATA3 and XBP1 have a frequency of high expression of higher than 60% in BRCA. However, except for ESR1, the three established makers were not specific in BRCA (Figure S1). Furthermore, although ESR1 was specifically expressed in BRCA cancer tissue, it was also highly expressed in UCEC paracancerous tissue, and thus we did not select ESR1 as a cSEG for BRCA.
Identification of diagnostic markers for early-stage cancers
Early-stage cancer detection appears to be a key approach to reduce cancer mortality; most cancer deaths are preventable through early detection [25]. To detect markers for early-stage cancers, we divided the cancer data into four stages from T1 to T4 based on sample clinical information. We then identified SEGs for each cancer stage. As a result, we obtained 560 SEGs across 21 TCGA cancer types at T1 stage (Figure 3A). Among these SEGs, 233 cSEGs in the T1 stage had a high expression frequency (>50%) across 17 cancers (Figure 3B, Table S4), which may allow the use of these cSEGs as early-stage diagnostic biomarkers. Notably, KICH had 79 T1 stage markers with high expression frequency (>50%). In addition, the high expression frequency of ACO2 and MUDENG in KICH was higher than 90%, indicating their high sensitivity in detection.
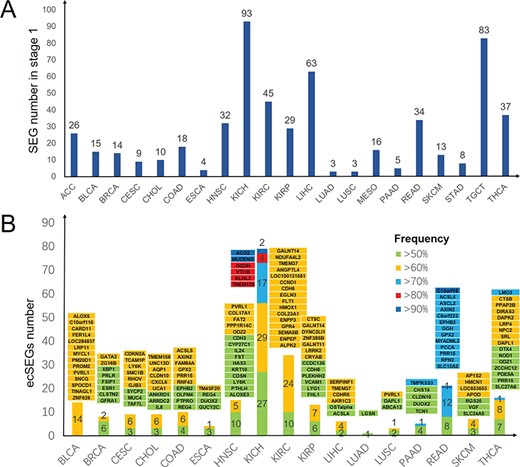
Overview of SEG distribution in 21 T1 stage cancers and markers selected with high frequency in 17 T1 stage cancers. (A) Numbers of SEGs in 21 T1 stage cancers. (B) Numbers of cSEGs and their frequency of high expression (>50%) in 17 T1 stage cancers. Green, yellow, blue, red and dark blue bars denote SEGs with a frequency of high expression higher than 50%, 60%, 70%, 80% and 90%, respectively. Gene names with background colors are the corresponding genes with the same color in the bars below.
Two-gene markers in cancer diagnosis
Application of the two-gene combination has great potential as a biomarker in cancer diagnosis and prognosis prediction. A low frequency of a single cSEG may lead to a high miss rate (low sensitivity). Thus, we conducted a two-gene combination strategy to identify biomarkers with higher sensitivity in multiple cancer types. The two-gene markers with the highest frequency across 13 cancer types are listed in Table 1. Compared with other cancers, KICH shows the highest high expression frequency at 97% in 4 two-gene combinations (ACO2–ARSJ, ACO2–CLNK, DLAT–OGDH and ELOVL7–PPDPF). Moreover, we detected two-gene markers in the T1 stage across 11 cancers (Table S5). The two-gene markers with the highest high expression frequency in each cancer are listed in Table 2. It is noteworthy that 16 combinations in COAD, 87 combinations in READ and 215 combinations in KICH (listed in Table S5) reached the highest possible high expression frequency (100%, Table S5). These two-gene combinations have high sensitivity and specificity for early diagnosis of cancer.
The two-gene combinations with highest frequency as cSEG markers in 13 cancers
| Cancer | Gene 1 | Gene 1 frequency | Gene 2 | Gene 2 frequency | Co-frequency | P-value of two-gene combination |
|---|---|---|---|---|---|---|
| BLCA | FER1L4 | 54% | SHISA5 | 66% | 75% | 5.07E-10 |
| BRCA | GALNT6 | 58% | GATA3 | 63% | 75% | 3.44E-17 |
| CESC | KLHDC7B | 55% | TCAM1P | 61% | 84% | 1.19E-14 |
| CHOL | ARRDC2 | 61% | ANXA9 | 64% | 81% | 0.12 |
| CHOL | ARRDC2 | 61% | GMNN | 58% | 81% | 0.07 |
| CHOL | ARRDC2 | 61% | SLFN13 | 64% | 81% | 0.12 |
| HNSC | LAMB3 | 60% | ALOXE3 | 56% | 80% | 1.10E-16 |
| HNSC | LAMB3 | 60% | TM4SF19 | 56% | 80% | 1.10E-16 |
| HNSC | DNAH17 | 54% | ITGA6 | 61% | 80% | 6.16E-19 |
| KICH | ACO2 | 82% | ARSJ | 58% | 97% | 2.08E-07 |
| KICH | ACO2 | 82% | CLNK | 68% | 97% | 0.000036 |
| KICH | DLAT | 70% | OGDH | 83% | 97% | 0.000072 |
| KICH | ELOVL7 | 67% | PPDPF | 70% | 97% | 0.000018 |
| KIRC | NRP1 | 69% | FBXO17 | 70% | 89% | 1.81E-15 |
| KIRC | NRP1 | 69% | HMOX1 | 66% | 89% | 4.23E-19 |
| KIRC | NRP1 | 69% | SPAG4 | 67% | 89% | 1.05E-17 |
| KIRC | FLT1 | 63% | SPAG4 | 67% | 89% | 5.16E-23 |
| KIRP | C2orf18 | 65% | CREB5 | 62% | 92% | 1.07E-17 |
| KIRP | C2orf18 | 65% | ITM2B | 74% | 92% | 3.46E-15 |
| LIHC | AKR1C3 | 60% | EFNA1 | 65% | 83% | 6.12E-12 |
| PRAD | ERGIC1 | 79% | CREB3L1 | 67% | 91% | 4.22E-20 |
| PRAD | ERGIC1 | 79% | DNAH8 | 59% | 91% | 6.43E-31 |
| SKCM | ABL2 | 65% | HMCN1 | 58% | 83% | 3.99E-17 |
| THCA | S100A13 | 73% | SLC17A5 | 67% | 88% | 2.32E-15 |
| THCA | S100A13 | 73% | LTBP3 | 66% | 88% | 1.81E-16 |
| UCEC | DLX5 | 56% | EYA2 | 58% | 79% | 5.64E-06 |
| UCEC | DLX5 | 56% | CAPS | 58% | 79% | 5.64E-06 |
P-value denotes the significance of two-gene combination compared with the Gene 1 or Gene 2 by Chi-square test. Co-frequency denotes the frequency of high expression of one of the two genes in the cancer type.
The two-gene combinations with highest frequency in T1 stage cancers for early diagnosis
| Cancer | Gene 1 | Gene 2 | Co-frequency |
|---|---|---|---|
| BLCA | SPOCD1 | ALOX5 | 100% |
| BLCA | SPOCD1 | C10orf116 | 100% |
| BLCA | SPOCD1 | CARD11 | 100% |
| BLCA | SPOCD1 | FER1L4 | 100% |
| BLCA | SPOCD1 | LOC284837 | 100% |
| BLCA | SPOCD1 | LRP11 | 100% |
| BLCA | SPOCD1 | MYCL1 | 100% |
| BLCA | SPOCD1 | PM20D1 | 100% |
| BLCA | SPOCD1 | PROM2 | 100% |
| BLCA | SPOCD1 | PVRL1 | 100% |
| BLCA | SPOCD1 | SNCG | 100% |
| BLCA | SPOCD1 | TINAGL1 | 100% |
| BLCA | SPOCD1 | ZNF626 | 100% |
| BRCA | PRLR | ZG16B | 79% |
| CESC | CDKN2A | SMC1B | 89% |
| CHOL | CLDN10 | TMEM156 | 89% |
| CHOL | CLDN10 | UCA1 | 89% |
| CHOL | CLDN10 | UNC13D | 89% |
| CHOL | IL8 | UNC13D | 89% |
| COAD | ACSL5 | GPX2 | 100% |
| COAD | ACSL5 | OLFM4 | 100% |
| ESCA | TM4SF20 | DUOX2 | 74% |
| ESCA | TM4SF20 | REG4 | 74% |
| HNSC | LY6K | PVRL1 | 94% |
| KIRC | BTNL9 | HMOX1 | 89% |
| KIRC | CDH6 | GPR4 | 89% |
| KIRC | HMOX1 | FLT1 | 89% |
| KIRC | HMOX1 | GPR4 | 89% |
| KIRP | LRRK2 | CRYAB | 88% |
| KIRP | LRRK2 | GALNT14 | 88% |
| LIHC | CDHR5 | TMEM37 | 88% |
| LUSC | DAPL1 | PVRL1 | 76% |
| PAAD | CHST4 | TMPRSS3 | 86% |
| PAAD | CLDN10 | DUOX2 | 86% |
| PAAD | CLDN10 | TMPRSS3 | 86% |
| SKCM | AP1S2 | VGF | 90% |
| SKCM | APOD | RGS20 | 90% |
| THCA | DAPL1 | DIRAS3 | 90% |
Co-frequency denotes the frequency of high expression of one of the two genes in the cancer type. Note: the complete list of two-gene combinations, including 87 combinations in READ and 215 combinations in KICH, appears in Supplementary Table S5.
SEGs as potential targets of cancer drug repurposing
Most drugs function by targeting proteins and modulating their activities in a tissue-specific manner, and hundreds of genes are the targets of US FDA-approved drugs [26]. To identify potential drug repurposing based on the SEGs in Figure 1A, we compared targets of US FDA-approved anticancer drugs from DrugBank with our SEGs. As a result, we identified 13 SEGs in 7 cancer types that were targets of dozens of drugs (Figure 4). About half of these drugs were used in the corresponding cancer of that SEG (drugs in green in Figure 4). The other half of the drugs were developed for other cancers, which were not SEG-related cancers (drugs in orange in Figure 4). Thus, we inferred that these drugs may be repurposed to the cancer with the SEG as a drug target. For example, Alemtuzumab is used in the treatment of chronic lymphocytic leukemia [27]; however, its target CD52 is a SEG in DLBC (lymphoma), a leukemia-related disease. Ziv-aflibercept (also known as Aflibercept) is used in therapy against metastatic colorectal cancer [28], but its target VEGFB is a SEG of KICH and UVM. Thus, alemtuzumab and ziv-aflibercept are examples of drugs that can potentially be repurposed to treat other cancers.
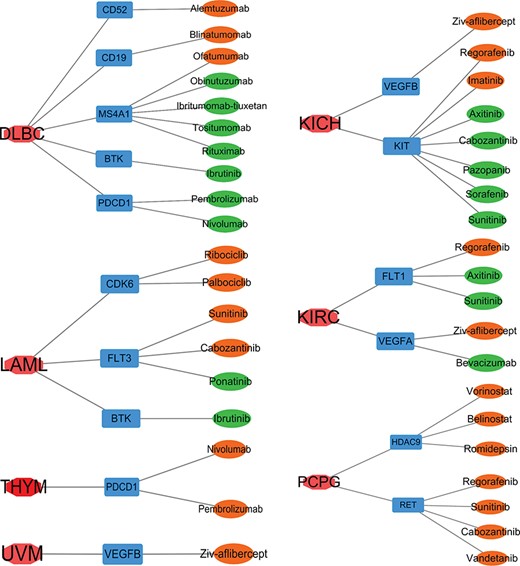
Targets of US FDA-approved drugs in SEGs of seven cancers. Red, cancers; blue: targets of US FDA-approved drugs as SEGs of that cancer; green, a drug that was tested in that cancer; orange, a drug that was developed for cancers other than that cancer.
Regulatory network for SEGs and prognosis analysis for cSEGs
Given that TFs play pivotal roles in cancer initiation and progress [29], we identified TFs and their targets from SEGs, and we conducted regulatory network analysis to reveal how SEGs were regulated. In total, 24 cancers had TFs as SEGs. We selected six cancer types and exhibit their regulatory networks in Figure 5. Among these SEGs, some TFs are specific pivotal genes in cancers, such as TP63 in LUSC [30] and GATA3 in BRCA [31]. Some TFs are related to cancer prognosis, such as GATA2 in KICH [32] and CDX2 in COAD [33]. KICH and GBM had more SEGs, so their specific TF regulatory networks were also more complex than other cancers.
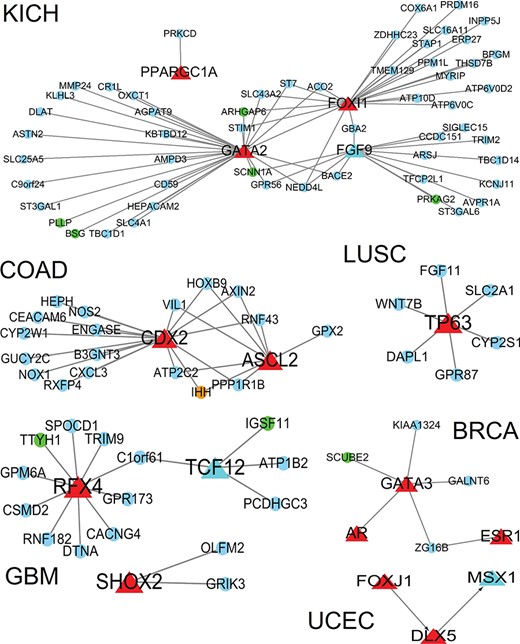
Regulatory network for specifically expressed TFs in six cancers and the target genes from SEGs. Red triangles, TF; circles, target genes; red: nonprognosis-related TFs; light blue triangle: prognosis-related TFs; orange, drug-target related target genes; blue: nonprognosis-related target genes; green: prognosis-related target genes.
To evaluate the prognostic effects of cSEGs in cancer, we used the Kaplan–Meier method in GSCALite [14] to identify prognosis-related genes in all cSEGs. We identified 39 cSEGs as prognosis-related genes across 7 cancer types (BRCA, KICH, KIRC, KIRP, PCPG, THCA and UCEC), and most of them were in 3 kidney cancer subtypes (Table S6). Survival curves of eight prognosis prediction markers with high expression frequency are shown in Figure S2.
Discussion
Although diagnostic cancer biomarkers are playing important roles in personalized oncological patient care, the number of biomarkers in clinical use is pitifully small [34]. One reason is that most tumor markers in one cancer type can also exist in other cancer types, and thus there is a lack of specificity. Therefore, in this study, we screened cSEGs with high sensitivity and specificity that are essential for cancer detection, especially at the early stage. Although we identified many novel cSEGs for some cancers, some have been reported to evolve during cancer progression. For instance, GPC3 is a cSEG highly expressed in LIHC in our work, and it was reported that its upregulation is important to both malignant transformation and tumorigenesis in liver cancer [35]. In addition, NDUFA4L2 was identified as highly expressed in KIRC, which confirmed it as a risk factor for clear cell–renal cell carcinoma progression and mortality [36]. These cSEGs were considered diagnostic tools, including for biopsy and laboratory tests, which still miss many cancer types such as BRAC [37], COAD [38] and KIRC [39]. It is worth mentioning that we identified two-gene markers with much higher sensitivity and specificity, which may provide better diagnostic indicators for early clinical diagnosis. Besides, we evaluated the power of several cSEGs on multiple independent datasets of cancers including PAAD [40] and KIRC [41] (Figure S3). The tendency of expression levels of cSEGs appeared dramatically differences between tumor and normal samples, such as TCN1 in PAAD and KRBA1 in KIRC, etc. (Figure S3). We should note that the frequency of TCN1 in PAAD, KRBA1, PLVAP and VEGFA in KIRC validation datasets is 83%, 83%, 99%, 85% and 100%, respectively, which suggest their higher frequencies in valuation datasets than those in TCGA datasets, which were 54%, 65%, 63% and 65%, respectively. In addition, several cSEGs and their combinations showed similar expression profiles and discriminatory powers on independent datasets. For example, the co-frequency of the two-gene combination of AKRIC3 and EFNA1 on LIHC [42] independent dataset (86%) was consistent with our finding on TCGA and GTEx datasets (83%), suggesting that our results are convincing.
Exploring systematic approaches through various molecular features to find drugs for cancers is crucial. Among these features, gene expression has been the most widely used [43]. Drug repurposing is a very good approach to adapt existing drugs to different diseases. Moreover, molecular drugs/inhibitors with high selective target genes reduce side effects [44]. Our strategy to identify cSEGs with high specificity as drug targets may be suitable as a complementary method to the traditional target-based approach.
Nevertheless, we should note the limitation of cSEGs, which is that we detected cSEGs based on mRNA expression here, but not the protein level. Therefore, a further detection of protein expression, such as flow cytometry, may be necessary. In addition, we calculated the expression of cSEGs in tumor tissue sites rather than in peripheral blood, and biopsies of tumor sites are traumatic. Finally, we did not validate those biomarkers in vivo and in vitro, so experimental validation may warrant further investigation.
In conclusion, these findings have important implications for future practice. First, we selected cancer markers from tissue-specific genes because of the lack of current cancer markers. Moreover, because of the lack of sensitivity of single markers, we also selected two-gene markers to improve sensitivity and accuracy. Finally, we obtained a number of early diagnosis markers with high specificity and sensitivity to some cancers. These results will be very useful in validating the diagnostic and therapeutic biomarkers for cancers.
Author Contributions
Yao Lv and Sheng-Yan Lin contributed equally to this work. Yao Lv, Sheng-Yan Lin and Fei-Fei Hu analyzed and interpreted the data; Yao Lv and Sheng-Yan Lin wrote the manuscript; An Yuan Guo and Yan Wang designed the research and revised the manuscript; Qiong Zhang helped with data analysis and interpretation.
We identified SEGs that were highly expressed in single and multiple tissues across 33 cancer types, 24 paracancerous tissues from TCGA and 30 normal tissues from the GTEx portal.
We identified 233 cSEGs with high specificity and sensitivity as potential markers across 15 solid tumors.
We detected cSEGs as early cancer-sensitive markers in the T1 stage with a frequency >50% across 17 cancers, and we obtained two-gene markers to increase sensitivity.
We performed drug analysis, prognostic analysis and transcriptional regulatory network analysis based on cSEGs in various cancers.
Acknowledgements
We thank members working for the TCGA and GTEx group.
Funding
National Natural Science Foundation of China (NSFC Nos. 31822030, 31771458, 31801113) and China Postdoctoral Science Foundation (Grant No. 2018 M632830).
Yao-Lv is a master student in Huazhong University of Science and Technology, China, working on analyzing and interpreting big data from TCGA and GTEx.
Sheng-Yan Lin is a PhD student in Huazhong University of Science and Technology, China, working on cancer genomics data.
Fei-Fei Hu is a PhD student in Huazhong University of Science and Technology, China, working on data mining in NGS and database.
Zheng Ye is a PhD student in Tianjin Medical University, China, working on data mining in NGS and database.
Qiong Zhang is a Postdoctoral in Huazhong University of Science and Technology, China, developing the novel methods and mining biological data.
Yan Wang is a professor in bioinformatics in Huazhong University of Science and Technology, Wuhan, China. Her research interests in protein structure and function prediction and protein interaction network.
An-Yuan Guo is a professor in bioinformatics in Huazhong University of Science and Technology, Wuhan, China. His research interests in regulatory networks of complex diseases and cancer genomics.
References
Author notes
Co-first authors
