


Abstract
Humans have coexisted with pathogenic microorganisms throughout its history of evolution. We have never halted the exploration of pathogenic microorganisms. With the improvement of genome-sequencing technology and the continuous reduction of sequencing costs, an increasing number of complete genome sequences of pathogenic microorganisms have become available. Genome annotation of this massive sequence information has become a daunting task in biological research. This paper summarizes the approaches to the genome annotation of pathogenic microorganisms and the available popular genome annotation tools for prokaryotes, eukaryotes and viruses. Furthermore, real-world comparisons of different annotation tools using 12 genomes from prokaryotes, eukaryotes and viruses were conducted. Current challenges and problems were also discussed.
Introduction
As the earliest known life forms, microorganisms or microbes have been developing on Earth for approximately four billion years [1–3]. Since modern humans (Homo sapiens) appeared approximately 300 000 years ago [4], microorganisms have interacted with humans and secretly lived together on Earth [5]. Until the first century B.C., our ancestors speculated that some unseen creatures possibly caused serious diseases [6]. In the late 1880s, disease-causing microorganisms, namely, pathogens, were gradually established and studied by scientists. Since then, scientists have been studying why and how these microorganisms, including bacteria, fungi, viruses and parasites, make us sick [7]. To date, approximately 1400 species of human pathogenic microorganisms have been identified. Of these, almost 90 were first reported in humans since 1980 [8]. Although we have accumulated much useful understanding of the emergence, evolution, pandemic and pathogenic mechanism of pathogenic microorganisms, there are still some crucial gaps in our knowledge. For instance, we still know very little about the diversity of pathogens that humans may be exposed to. The prior conditions for determining which pathogens can infect humans and estimating these pathogens’ transmission potential are more challenging [9, 10]. Since the first complete genome sequence of the microorganism Haemophilus influenza was published in 1995 [11], the whole-genome era’s arrival has brought a new dawn for us to fill these gaps. Over the past two decades, the genomes of hundreds of eukaryotes and hundreds of thousands of prokaryotes, including pathogenic microorganisms, have been sequenced. Moreover, many thousands of complete genomes are coming soon [12]. Genome annotation has become a critical element for us to understand genomic biology, especially the genomes of pathogenic microorganisms. Over the years of efforts, genome annotation has flourished. Today, we know not only protein-coding genes but also many other functional elements, such as promoters, enhancers, noncoding RNAs and DNA methylation sites.
Approaches to genome annotation of pathogenic microorganisms
Since the first complete genome was sequenced 25 years ago [11], people have been trying to use various approaches to annotate the genomes more completely and accurately. Generally, genome annotation mainly consists of three parts: structural gene annotation, functional gene annotation and noncoding sequence annotation (Figure 1). Each part contains many different methods for annotations.
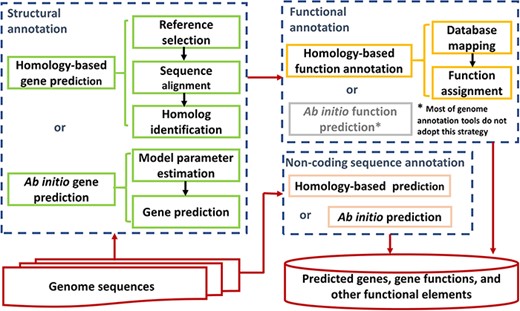
Genome annotation strategies.
Structural gene annotation identifies the coordinates of genes in a genome. Although pathogenic microorganisms cover a wide range of species, including eukaryotes, prokaryotes and viruses, their structural gene annotations generally fall into similar categories as follows: homology-based gene prediction and ab initio gene prediction. For homology-based structural gene annotation, the sequences of proteins, transcripts, genes or even genomes from related species or databases are aligned to the genome to be annotated [13–16]. Commonly, methods based on BLAST [17] or hidden Markov models (HMMs) [18] are used for alignment. BLAST is mainly used to find homologs based on whole sequence alignment, while HMM is mainly used to find remote homologs based on domain structures. If the selected reference and the genome to be annotated are closely related, such as belonging to the same species, BLAST is often selected. Conversely, HMM is often selected if they have a distant relationship. As the output, the homologs and their coordinates in the genome are identified. Boundaries between introns and exons are also found. Ab initio structural gene annotation is a method that uses statistical models to identify gene features, such as exons, introns, start codons and stop codons. The process of ab initio structural gene annotation usually includes the following two components: model parameter estimation and gene prediction. For conventional ab initio methods, model parameter estimation requires constructing training sets of known gene structures. Transcriptome sequences, expressed sequence tags (EST), gene sequences or protein sequences from closely or distantly related species can be used as an initial point to estimate the parameters of the ab initio statistical model [19–21]. Other ab initio methods use self-training algorithms for model parameter estimation, which does not require a user to generate or provide any training set [22–24]. Regardless of the methods used for model parameter estimation, the gene prediction model based on these parameters can identify the gene coordinates in a new genome. In short, homology-based and ab initio gene predictions have advantages and limitations. Furthermore, these predictions are applied in structural gene annotation of various pathogenic bacteria, viruses, fungi and protozoa. In reality, many pipelines for genome annotation use the combination of the two categories to improve genome annotation’s accuracy and efficiency [13, 15, 25–27].
Functional gene annotation predicts gene functions, namely, assigns gene (family) names and attributes. Once the genes in a new genome are obtained, it is natural that we want to know their functions. Similar to structural gene annotation, functional gene annotation also has two strategies in principle, i.e. homology based and ab initio. However, almost all genome annotation pipelines adopt the homology-based strategy for functional gene annotation [13, 15, 20, 26–33], although some ab initio algorithms for gene function prediction have been reported [34–36]. Generally, based on BLAST or HMM, the predicted proteins are searched against a hierarchical collection of protein homologs, protein families and domain architectures from various public databases, such as GenBank, SwissProt and Pfam, among others. Then, the hit name with the highest-precedence evidence is assigned to the proteins.
Although the core feature of genome annotation has been gene prediction, many reports about functional elements in the genome’s noncoding region have prompted efforts to expand the genome annotation to noncoding sequences. Currently, many genome annotation pipelines include the annotation of noncoding functional elements, such as promoters, enhancers, noncoding RNAs and transposable elements [15, 30–32]. In these pipelines, noncoding sequences are annotated by special programs to find various noncoding functional elements. Generally, these programs also employ a homology-based or ab initio strategy to identify distinctive noncoding functional elements in the genome [37–40].
In addition, for eukaryotic pathogens such as fungi and protozoa, sometimes the mitochondrial genome needs to be annotated. Unlike the nuclear genome, the mitochondrial genome uses a different codon translation table, which brings unique annotation challenges [13]. The current genome annotation pipelines generally do not include mitochondrial genome annotations. A researcher may have to employ separate annotation programs or pipelines for this task [41, 42].
Genome annotation tools for pathogenic microorganisms
For the genome annotation of pathogenic microorganisms, many popular tools or pipelines can be selected, which can be divided into two types: stand-alone software and web-based systems. Generally, most stand-alone software tools require the command line to run, which requires the users to have some computer skills of the command line and Linux operating system. In contrast, the web-based system does not require users to have any specific computer skills. Users usually only need to upload their data files in the specified format onto the website. The genome annotation pipeline in the background will automatically analyze the data and return the results to the users. However, the stand-alone version of the software usually runs much faster than the web-based system. A flowchart of the general guideline is provided to help new researchers in the field (Figure 2).

Flowchart of a general guideline for choosing annotation tools.
For the genome annotation of prokaryotic pathogens, popular tools include RAST [31], RASTtk [43], DOE-JGI Microbial Genome Annotation Pipeline (MGAP) [44], GeneSAS [45], Prokka [30] and PGAP [15], among others. RAST (https://rast.nmpdr.org/), as a web-based system of prokaryotic genome annotation, was published in 2008 [31]. To date, RAST has annotated over 60 000 distinct genomes by over 12 000 users [46]. Using this server, protein-encoding, rRNA and tRNA gene coordinates and their functions can be predicted. Additionally, the metabolic network can be reconstructed based on the predicted information. Moreover, the annotated genome can be browsed in the SEED environment [47]. In 2015, a modular and extensible version of RAST, namely, the RAST tool kit (RASTtk), was released [43]. RASTtk is available not only as embedded options on the RAST web server but also as a stand-alone tool to be installed and run locally (https://github.com/TheSEED/RASTtk-Distribution/releases/). The DOE-JGI MGAP is also a web-based system for bacterial and archaeal genome annotation (https://gold.jgi.doe.gov/index). MGAP can annotate protein-encoding and RNA genes, gene functions and CRISPR elements in a genome. The users need first to register a project and submit their assembled nucleotide sequence datasets to the Genomes Online Database (GOLD), and then these datasets are annotated by MGAP [44]. GenSAS (https://www.gensas.org/) is another online platform that can be used for prokaryotic genome annotation [45]. The platform provides a variety of optional tools for structural gene annotation, functional gene annotation and genome visualization. Prokka (https://github.com/tseemann/prokka) is a popular stand-alone tool for prokaryotic genome annotation [30]. Prokka can quickly annotate a bacterial genome on a desktop computer, and it can annotate protein-coding genes, RNA genes and their functions and provide standard-compliant output files for genome browsers. Many integrated genome analysis tools, such as ASA3P [48], TORMES [49] and DFAST [50], directly embed Prokka as their genome annotation function. PGAP (https://github.com/ncbi/pgap) is another stand-alone pipeline for genome annotation of prokaryotes [15]. NCBI has used PGAP for prokaryotic genome annotation (https://www.ncbi.nlm.nih.gov/genome/annotation_prok/). Coding genes, noncoding genes, gene function and CRISPR loci can be predicted with this pipeline, and genes are predicted by the combination of homology-based and ab initio methods.
Because of the complexity of eukaryotic genomes [51], many eukaryotic genome annotation tools, such as PASA [52], Augustus [53], SNAP [54], EVidenceModeler (EVM) [25], MAKER [55], BRAKER [56] and GeneMark-EP+ [57], only focus on structural annotation of genomes. Only a small number of eukaryotic genome annotation tools can perform functional annotation. GenSAS (https://www.gensas.org/) is a web server that can perform structural annotation, functional annotation and visualization [45]. Multiple gene prediction tools, such as Augustus, SNAP and EVM, can be chosen for genome structural annotation in GenSAS. For functional annotation in GenSAS, BLAST+ [58] and Diamond [59] are used to search public databases, such as NCBI RefSeq [60], SwissProt [61] and TrEMBL [61], or any protein files provided by users. Companion is a web server (http://companion.sanger.ac.uk) for the annotation of parasite genomes [33]. A stand-alone version of Companion (https://github.com/sanger-pathogens/companion) is also available for large genome annotation and user confidentiality. The tool performs gene finding, functional annotation, pseudogene detection, comparative analyses based on reference genomes and visualization of annotation and analysis results. For the structural annotation of the genome in the tool, Augustus, SNAP and RATT [62] are used. For functional annotation of the genome in the tool, the OrthoMCL [63] and Pfam [64] databases are searched for homologs by BLAST+ and HMMER [65]. GAAP (http://gaap.hallym.ac.kr/) is a stand-alone pipeline for eukaryotic genome assembly and annotation [66]. The pipeline can directly accept raw DNA/RNA data from the NGS platform and assemble them into the genome and transcriptome. Then, the assembled genome is annotated for structure and function by the pipeline. Augustus, SNAP, Maker, EVM and PASA are combined for genome structural annotation in the pipeline. For the functional annotation portion of the pipeline, commercial software Blast2GO [67] and some public databases, such as NCBI, Pfam, Gene Ontology [68] and KEGG Pathway [69], are used to perform the function. genome annotator light (GAL) (https://hub.docker.com/u/cglabiicb/) is a docker-based package for genome structural and functional annotations for eukaryotes and prokaryotes [70].
Unlike prokaryotic and eukaryotic genome annotation tools, viral genome annotation tools have appeared only relatively recently, as most of them have been published in the past few years. Viral genome annotation system (http://cefg.uestc.cn/vgas/) provides two versions (stand-alone and web server) for viral genome annotation [29], and it uses an ab initio method improved from ZCURVE_V [71] for gene prediction. The resulting predicted genes are aligned with the SwissProt database by BLAST+ for functional annotation. Viral Annotation DefineR (VADR, https://github.com/nawrockie/vadr) is a reference-based tool for viral genome annotation, and it was developed by NCBI and integrated into GenBank for viral submissions [16]. By searching RefSeq, an appropriate reference is identified for the genome to be annotated. The genes and their functions are predicted based on the mapping between the reference and the target genome. Similarly, VAPiD [28] and VIGOR [72] are also reference-based tools and provide the capability for genome submissions to NCBI GenBank.
Performance test of genome annotation tools
To compare the performances of these genome annotation tools, 12 genomes with complete annotation information from prokaryotes, eukaryotes and viruses were selected to test and compare the above genome annotation tools (Table 1). Among them, Clostridioides difficile 630, Klebsiella pneumoniae subsp. pneumoniae HS11286, Neisseria gonorrhoeae FA 1090 and Staphylococcus aureus subsp. aureus NCTC 8325 are important bacterial pathogens from prokaryotes. Plasmodium falciparum 3D7, Toxoplasma gondii ME49 and Babesia microti strain R.I. are eukaryotic parasites. Aspergillus fumigatus Af293 is a fungal pathogen. SARS-CoV-2 (COVID-19), Dengue virus 2 Thailand/16681/84, Hepatitis C virus subtype 1a and Norwalk virus are important viral pathogens. These genomes were used to test prokaryotic, eukaryotic and viral genome annotation tools.
Information about selected reference genome annotation
Information about selected reference genome annotation
The software selected for the performance test of genome annotation
| Applicable object | Softwarea | Software release type | Average running speedb | Source |
|---|---|---|---|---|
| Prokaryotic genome | PROKKA | Stand alone | About 2 min | https://github.com/tseemann/prokka |
| RASTtk | Stand alone | About 4 min | https://github.com/TheSEED/RASTtk-Distribution/releases/ | |
| RAST | Web based | About 40 min | https://rast.nmpdr.org/ | |
| GeneSAS_genemarkS | Web based | Less than 1 h | https://www.gensas.org/ | |
| PGAP | Stand alone | About 5 h | https://github.com/ncbi/pgap | |
| Eukaryotic genome | Companion_web | Web based | About 10 h | http://companion.sanger.ac.uk |
| Companion_cl | Stand alone | About 15 h | https://github.com/sanger-pathogens/companion | |
| GeneSAS_genemarkES | Web based | Less than 1 h | https://www.gensas.org/ | |
| GAL | Stand alone | About 1 day | https://hub.docker.com/u/cglabiicb/ | |
| GAAP | Stand alone | More than 1 day | http://gaap.hallym.ac.kr/ | |
| Viral genome | VADR | Stand alone | About 1 min | https://github.com/nawrockie/vadr |
| VAPiD | Stand alone | About 1 min | https://github.com/rcs333/VAPiD | |
| GeneSAS_genemarkS | Web based | A few minutes | https://www.gensas.org/ | |
| GeneSAS_glimmer3 | Web based | A few minutes | https://www.gensas.org/ |
aFor stand-alone software except for PGAP, they are tested at a workstation with 8 CPU cores and 15 GiB memory. Because high-performance computing (at least over 4 GB memory/CPU) is required for PGAP, PGAP is tested at a server with 16 CPU cores, 376 GiB memory.
bThe average of three running times of all related genome annotations.
Performance test of prokaryotic genome annotation tools based on four species
| Species | Software | Genes | CDS | CDS with function | CDS without function | rRNA | tRNA | Genes with same start and end position (%)a | Genes with same start position (%) | Similarity scoreb |
|---|---|---|---|---|---|---|---|---|---|---|
| Clostridioides difficile | Ref_annotationc | 3904 | 3850 | 3353 (87.09%) | 497 (12.91%) | 32 | 88 | / | / | / |
| PROKKA | 3913 | 3824 | 2124 (55.54%) | 1700 (44.46%) | / | 89 | 3547 (90.86%) | 3714 (95.13%) | 95.02% | |
| RASTtk | 4031 | 3912 | 2930 (74.90%) | 982 (25.10%) | 32 | 87 | 3557 (91.11%) | 3727 (95.47%) | 93.94% | |
| RAST | 4261 | 3904 | 2929 (75.03%) | 975 (24.97%) | 96 | 261 | 3721 (95.31%) | 3900 (99.90%) | 95.53% | |
| GeneSAS_genemarkS | 4087 | 3966 | / | / | 32 | 89 | 3615 (92.60%) | 3755 (96.20%) | 93.98% | |
| PGAP | 3886 | 3829 | 3410 (89.06%) | 419 (10.94%) | 32 | 88 | 3763 (96.39%) | 3828 (98.05%) | 98.28% | |
| Klebsiella pneumoniae | Ref_annotation | 5868 | 5779 | 4085 (70.69%) | 1694 (29.31%) | 25 | 62 | / | / | / |
| PROKKA | 5540 | 5451 | 3889 (71.34%) | 1562 (28.66%) | / | 88 | 4760 (81.12%) | 5100 (86.91%) | 89.41% | |
| RASTtk | 5844 | 5731 | 4826 (84.21%) | 905 (15.79%) | 25 | 88 | 5092 (86.78%) | 5394 (91.92%) | 92.11% | |
| RAST | 6070 | 5731 | 4857 (84.75%) | 874 (15.25%) | 75 | 264 | 5216 (88.89%) | 5517 (94.02%) | 92.43% | |
| GeneSAS_genemarkS | 5544 | 5544 | / | / | / | / | 4581 (78.07%) | 5018 (85.51%) | 87.94% | |
| PGAP | 5467 | 5527 | 5014 (90.72%) | 513 (9.28%) | 25 | 88 | 4858 (82.79%) | 5097 (86.86%) | 89.93% | |
| Neisseria gonorrhoeae | Ref_annotation | 2044 | 1973 | 1600 (81.09%) | 373 (18.91%) | 11 | 54 | / | / | / |
| PROKKA | 2201 | 2145 | 1235 (57.58%) | 910 (42.42%) | / | 55 | 1713 (83.81%) | 1836 (89.82%) | 86.50% | |
| RASTtk | 2642 | 2575 | 1765 (68.54%) | 810 (31.46%) | 12 | 55 | 1731 (84.69%) | 1881 (92.03%) | 80.28% | |
| RAST | 2776 | 2575 | 1783 (69.24%) | 792 (30.76%) | 36 | 165 | 1839 (89.98%) | 1999 (97.80%) | 82.95% | |
| GeneSAS_genemarkS | 2357 | 2357 | / | / | / | / | 1421 (69.52%) | 1683 (82.34%) | 76.48% | |
| PGAP | 2030 | 1960 | 1629 (83.11%) | 331 (16.89%) | 12 | 55 | 1930 (94.42%) | 1967 (96.23%) | 96.56% | |
| Staphylococcus aureus | Ref_annotation | 2842 | 2767 | 1238 (44.74%) | 1529 (55.26%) | 16 | 59 | / | / | / |
| PROKKA | 2693 | 2630 | 1720 (65.40%) | 910 (34.60%) | / | 62 | 2315 (81.46%) | 2476 (87.12%) | 89.47% | |
| RASTtk | 2763 | 2687 | 2157 (80.28%) | 530 (19.72%) | 16 | 60 | 2353 (82.79%) | 2523 (88.78%) | 90.03% | |
| RAST | 2915 | 2687 | 2157 (80.28%) | 530 (19.72%) | 48 | 180 | 2471 (86.95%) | 2647 (93.14%) | 91.96% | |
| GeneSAS_genemarkS | 2683 | 2683 | / | / | / | / | 2320 (81.63%) | 2458 (86.49%) | 88.98% | |
| PGAP | 2782 | 2704 | 2327 (86.06%) | 377 (13.94%) | 16 | 59 | 2580 (90.78%) | 2676 (94.16%) | 95.16% |
aPercentage is equal to (the number of detected identical genes/ref_annotation genes)*100.
bSimilarityScore = ((Genes with same start position)/(Totalx + Totalz))*2*100. Totalx and Totalz are the total number of genes in the software annotation and reference annotation. The function is from BEACON (https://www.ncbi.nlm.nih.gov/pmc/articles/PMC4539851/).
cref_annotation means the reference annotation. It is from NCBI RefSeq.
For the test of eukaryotic genome annotation tools, the Companion web server, Companion command line, GeneSAS, GAL and GAAP were selected to annotate the four eukaryotic genomes (Table 2 and Table 4). Although the Companion web server and its command-line generally performed better on genome annotation, they could only annotate parasite genomes and required reference genome annotation from related species. GeneSAS with the genemarkES method usually performed well on structural gene annotation for most genomes. However, GeneSAS did not have functional gene annotation in the output files. GAL and GAAP generally showed lower annotation accuracy for most genomes, but they could annotate any eukaryotic genome. For GAAP, no functional annotation was tested as a commercial tool (Blast2GO Cloud) was required. Additionally, GAAP is not a wrapped-up pipeline, thereby requiring users to perform all steps separately by themselves. For the running speed, the Companion web server, Companion command-line and GAAP required approximately 1 day to complete the annotation, while GeneSAS completed the annotation in 1 h.
Performance test of eukaryotic genome annotation tools based on four species
| Species | Software | Genes | CDS | CDS with function | CDS without function | rRNA | tRNA | Genes with same start and end position (%)a | Genes with same start position | Similarity scoreb |
|---|---|---|---|---|---|---|---|---|---|---|
| Plasmodium falciparum | Ref_annotationc | 5457 | 5354 | 3616 (67.54%) | 1738 (32.46%) | 28 | 45 | / | / | / |
| Companion_web | 5196 | 5130 | 3072 (59.89%) | 2058 (40.11%) | 14 | 47 | 5009 (91.80%) | 5027 (92.12%) | 94.38% | |
| Companion_cl | 4521 | 4392 | 2672 (60.84%) | 1720 (39.16%) | 19 | 46 | 4317 (79.11%) | 4345 (79.62) | 87.09% | |
| GeneSAS_genemarkES | 5184 | 5108 | / | / | 14 | 62 | 3929 (72.00%) | 4388 (80.41%) | 82.47% | |
| GAL | 1706 | 1706 | 1362 (79.84%) | 344 (20.16%) | / | / | 323 (5.92%) | 753 (13.80%) | 21.02% | |
| GAAP | 5377 | 5377 | / d | / | / | / | 2799 (51.30%) | 3657 (67.01%) | 67.51% | |
| Toxoplasma gondii | Ref_annotation | 8925 | 8292 | 4008 (48.34%) | 4284 (51.66%) | 424 | 183 | / | / | / |
| Companion_web | 4996 | 4488 | 2441 | 508 | 301 | 193 | 1639 (18.36%) | 1976 (22.14%) | 28.39% | |
| Companion_cl | 11 297 | 10 520 | 2151 (20.45%) | 8369 (79.55%) | 566 | 191 | 1067 (12.06%) | 1488 (16.67%) | 14.72% | |
| GeneSAS_genemarkES | / | / | / | / | / | / | / | / | / | |
| GAL | 34 288 | 34 288 | 27 368 (79.82%) | 6920 (20.18%) | / | / | 116 (1.30%) | 796 (8.92%) | 3.68% | |
| GAAP | 26 204 | 26 204 | / | / | / | / | 96 (1.08%) | 545 (6.11%) | 3.10% | |
| Babesia microti | Ref_annotation | 3685 | 3567 | 2335 (65.46%) | 1232 (34.54%) | 16 | 68 | / | / | / |
| Companion_web | 3151 | 3075 | 1 (0.03%) | 3074 (99.97%) | 8 | 64 | 2262 (61.38%) | 2642 (71.70%) | 77.30% | |
| Companion_cl | 2655 | 2572 | 1474 (57.31%) | 1098 (42.69%) | 8 | 63 | 2461 (66.78%) | 2507 (68.03%) | 79.09% | |
| GeneSAS_genemarkES | 3066 | 3066 | / | / | / | / | 2427 (65.86%) | 2740 (74.36%) | 81.17% | |
| GAL | 2104 | 2104 | 2031 (96.53%) | 73 (3.5%) | / | / | 710 (19.27%) | 1200 (32.56%) | 41.46% | |
| GAAP | 1712 | 1712 | / | / | / | / | 466 (12.65%) | 852 (23.12%) | 31.57% | |
| Aspergillus fumigatus | Ref_annotation | 9859 | 9630 | 6977 (72.45%) | 2653 (27.55%) | / | 229 | / | / | / |
| Companion_web | / | / | / | / | / | / | / | / | / | |
| Companion_cl | / | / | / | / | / | / | / | / | / | |
| GeneSAS_genemarkES | 9706 | 9706 | / | / | / | / | 6147 (62.35%) | 7424 (75.30%) | 75.89% | |
| GAL | 8978 | 8978 | 8623 (96.05%) | 355 (4%) | / | / | 6150 (62.38%) | 7250 (73.54%) | 76.98% | |
| GAAP | 8681 | 8681 | / | / | / | / | 5908 (59.92%) | 7036 (71.37%) | 75.90% |
aPercentage is equal to (genes with same start and end position/Ref_annotation genes)*100.
bSimilarityScore = ((genes with same start position)/(Totalx + Totalz))*2*100. Totalx and Totalz are the total numbers of genes in the software annotation and reference annotation. The function is from BEACON (https://www.ncbi.nlm.nih.gov/pmc/articles/PMC4539851/).
cref_annotation means the reference annotation. It is from NCBI RefSeq.
dThe blank is here because the commercial tool CloudBlast is required for functional annotation.
Another thing to note is that all tested tools showed extremely low annotation accuracy for T. gondii ME49. According to the NCBI genome assembly information, the genome dataset contained over 2000 scaffolds, except for 15 chromosomes and plasmids (Table S1). Therefore, we hypothesized that the reason for the low annotation accuracy of all tested tools might be the incomplete assembly of the genome. To verify this hypothesis, we selected another strain of T. gondii (RH-88), which had a more complete genome assembly, to test all the tools. The annotation results showed that these tools had higher annotation accuracy for strain RH-88 than strain ME49 (Table S2), supporting our hypothesis.
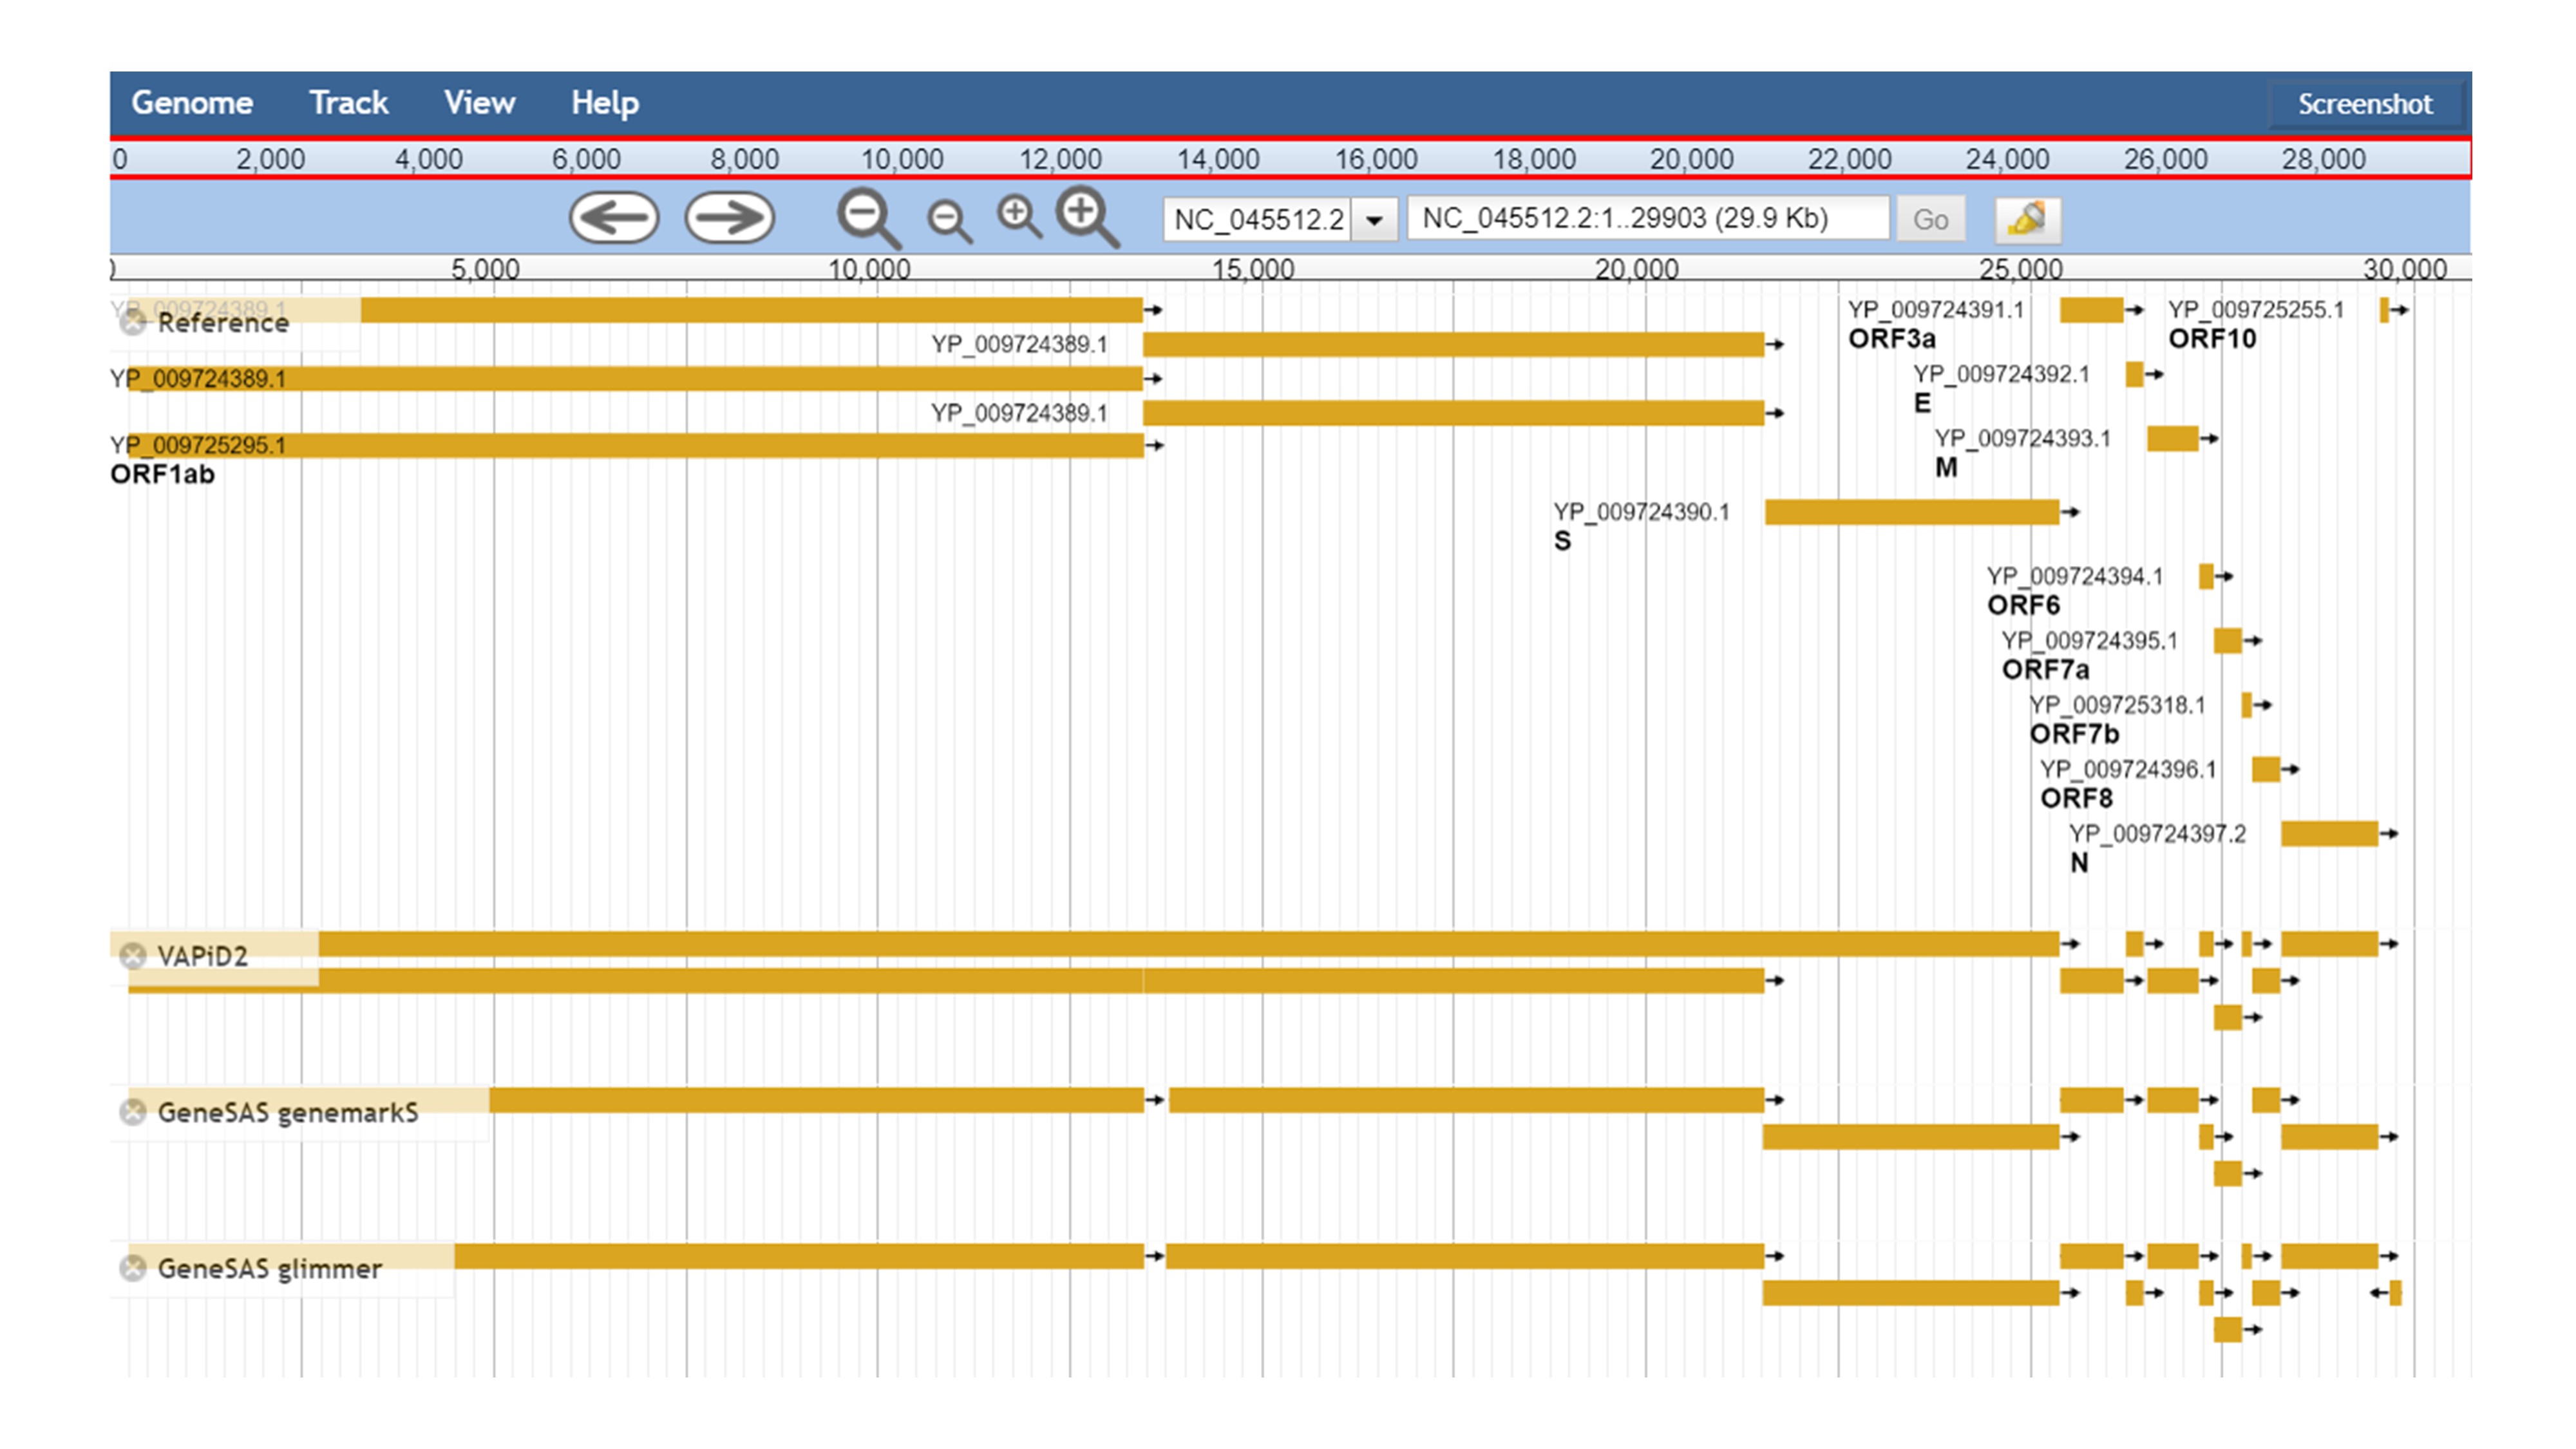
VADR, VAPiD and GeneSAS were selected to annotate the four viral genomes (Table 2 and Table 5). Of these tools, only VADR included the reference model of SARS-CoV-2. To make an unbiased comparison among these tools, the reference model of SARS-CoV-2 was removed from VADR. Because VADR’s default reference models only include Flaviviridae and Caliciviridae, as a result, it cannot find a reference meeting the similarity standard for homology-based annotation of SARS-CoV-2. Although users could build their own reference model for specific genome annotation, only RefSeq genomes are allowed to be used, and the length of a reference genome has to be less than 25 K in VADR. In contrast, VAPiD and GeneSAS can annotate the genome of any virus. To further explore and compare the detailed differences in annotation capabilities of these tools, we visualized the genome annotation results of these tools for SARS-CoV-2 (Figure S1). We found that the main difference in genome annotation of these tools occurred in predicting overlapping genes. It was difficult for most tools to accurately predict overlapping genes in a viral genome. The genome annotation results indicated that VADR and VAPiD generally had more stable and better annotation performance than GeneSAS. With regard to the running speed, all the tested tools needed only one or 2 min to complete the annotation.
Performance test of viral genome annotation tools based on four species
| Species | Software | Genes | CDS | CDS with function | CDS without function | Genes with same start and end position (%)a | Genes with same start position | Similarity scoreb |
|---|---|---|---|---|---|---|---|---|
| SARS-CoV-2 | Ref_annotationc | 11 | 13 | 4 (30.77%) | 9 (69.23%) | / | / | / |
| VADRd | / | / | / | / | / | / | / | |
| VAPiD | 10 | 10 | 4 (40.00%) | 6 (60.00%) | 9 (81.82%%) | 9 (81.82%) | 86% | |
| GeneSAS_genemarkS | 9 | 9 | / | / | 6 (54.55%) | 7 (63.64%) | 61% | |
| GeneSAS_glimmer3 | 12 | 12 | / | / | 8 (72.73%) | 9 (81.82%) | 78% | |
| Dengue virus | Ref_annotation | 1 | 1 | 1 | 0 | / | / | / |
| VADR | 1 | 1 | 1 | 0 | 1 (100%) | 1 (100%) | 100% | |
| VAPiD | 1 | 1 | 1 | 0 | 1 (100%) | 1 (100%) | 100% | |
| GeneSAS_genemarkS | 1 | 1 | / | / | 1 (100%) | 1 (100%) | 100% | |
| GeneSAS_glimmer3 | 2 | 2 | / | / | 1 (100%) | 1 (100%) | 66.67% | |
| Hepacivirus C | Ref_annotation | 1 | 3 | 3 | 0 | / | / | / |
| VADR | 1 | 3 | 3 | 0 | 1 (100%) | 1 (100%) | 100% | |
| VAPiD | 1 | 3 | 3 | 0 | 1 (100%) | 1 (100%) | 100% | |
| GeneSAS_genemarkS | 2 | 2 | / | / | 0 (0%) | 0 (0%) | 0% | |
| GeneSAS_glimmer3 | 3 | 3 | / | / | 1 (100%) | 1 (100%) | 50% | |
| Norwalk virus | Ref_annotation | 3 | 3 | 3 | 0 | / | / | / |
| VADR | 3 | 3 | 3 | 0 | 3 (100%) | 3 (100%) | 100% | |
| VAPiD | 3 | 3 | 3 | 0 | 3 (100%) | 3 (100%) | 100% | |
| GeneSAS_genemarkS | 3 | 3 | / | / | 3 (100%) | 3 (100%) | 100% | |
| GeneSAS_glimmer3 | 3 | 3 | / | / | 3 (100%) | 3 (100%) | 100% |
aPercentage is equal to (Genes with same start and end position/Ref_annotation genes)*100.
bSimilarityScore = ((Genes with same start position)/(Totalx + Totalz))*2*100. Totalx and Totalz are the total number of genes in the software annotation and reference annotation. The function is from BEACON (https://www.ncbi.nlm.nih.gov/pmc/articles/PMC4539851/).
cref_annotation means the reference annotation. It is from NCBI RefSeq.
dVADR with default reference models (Flaviviridae and Caliciviridae) could not annotate the genome of SARS-CoV-2, because VADR could not find anyone in the default model library to meet the similarity standard for homology-based annotation. VADR can annotate SARS-CoV-2 by using its SARS-CoV-2 specific reference model.
Current challenges for genome annotation
Over the past two decades, genome annotation has experienced rapid development and prosperity, making our understanding of genomes more explicit and profound. Genome annotation has become a necessary foundation or critical element in various biological fields. However, the accuracy of genome annotation has always been a considerable challenge for researchers. The impact on the annotation accuracy comes mainly from two aspects as follows: the quality of genome assembly and the selection of annotation tools. Draft assemblies with errors and contamination decrease the accuracy of genome annotation. The existence of many draft genomes has led to less accurate genome annotation [12]. Further improvements in sequencing and assembly technologies may increase the quality of genome assembly, thereby improving the accuracy of downstream genome annotation. The other aspect impacting the accuracy of an annotation is the selection of annotation tools. Although many tools can currently be selected for genome annotation, the annotation results obtained from different tools contain apparent differences. Due to the lack of recognized evaluation standards and systems, it is challenging to evaluate and identify the quality of annotation tools objectively. The introduction of unified evaluation standards or systems would improve the overall quality and accuracy of genome annotation tools.
For the current annotation tools, functional annotation is based on searching homologs in protein databases. However, some reports have indicated that approximately 30%–40% of proteins in databases are under ‘unknown function’ [74–76]. Moreover, for many proteins from new species, their homologs are not found in current databases [77]. Therefore, some nonhomology-based functional annotation methods should be developed and integrated into genome annotation tools to enhance the ability to annotate proteins without homologs or only with homologs of unknown function in public databases.
More ab initio algorithms for viral genome annotation need to be developed to enhance the strength of viral genome annotation tools. In addition, more stand-alone genome annotation pipelines for eukaryotes with full functions should also be developed.
We summarize the strategies and approaches for the genome annotation of pathogenic microorganisms.
Popular genome annotation tools for eukaryotes, prokaryotes and viruses are collected, and their characteristics are presented.
Real-world comparisons of different genome annotation tools using sample genomes are conducted.
Although genome annotation methods have shown rapid development and prosperity, researchers still face challenges such as the inconsistency of genome annotations between tools and the large proportion of proteins with unknown functions.
Funding
National Institute of Allergy and Infectious Diseases (grant no. 3U19AI089672 to L.C. and X.L.).
Yibo Dong: Research associate in bioinformatics research, College of Public Health, University of South Florida.
Chang Li: Postdoc scholar in bioinformatics and genomics research, College of Public Health, University of South Florida.
Kami Kim: Professor and director, Division of Infectious Disease and International Medicine, Department of Internal Medicine, Morsani College of Medicine, University of South Florida.
Liwang Cui: Cohen professor in Malaria Research, Division of Infectious Disease and International Medicine, Department of Internal Medicine, Morsani College of Medicine, University of South Florida.
Xiaoming Liu: Associate professor in population genomics, bioinformatics and genetics of human diseases research, College of Public Health, University of South Florida.
