


Abstract
Gene sets over-representation analysis (GSOA) is a common technique of enrichment analysis that measures the overlap between a gene set and selected instances (e.g. pathways). Despite its popularity, there is currently no established standard for visualization of GSOA results.
Here, we propose a visual exploration of the GSOA results by showing the relationships among the enriched instances, while highlighting important instance attributes, such as significance, closeness (centrality) and clustering.
GSOAP is implemented as an R package and is available at https://github.com/tomastokar/gsoap.
1 Introduction
Gene set over-representation analysis (GSOA) is a method of enrichment analysis that measures the fraction of genes of interest (e.g. differentially expressed genes) belonging to a tested group of genes (e.g. pathway, Gene Ontology terms etc.). Significance of the overlap between the genes of interest (hereafter referred to as query genes) and the tested group of genes (hereafter referred to as instance) is then assessed by statistical test (usually by hypergeometric test). The underlying idea is that instances (e.g. pathways) that significantly overlap with the set of query genes are related to some biological phenomena (e.g. pathology) that are associated with these genes. Despite its name, applicability of GSOA is not limited only to genes and is frequently applied to other molecules (including proteins and microRNAs).
Application of GSOA requires only a set of query genes and a set of instances to be tested, where each instance is defined as a group of genes, having the same nomenclature as the query genes. If hypergeometric test is used to assess significance, GSOA also requires a total number of considered genes (‘universe’) to be specified. After GSOA is performed, typical output comprises the list of overlapping genes across the instances, associated statistical significance [i.e. P-value or false discovery rate (FDR)] and instance name.
Despite popularity of GSOA, there is currently no established standard for its visualization. Researchers typically report GSOA by custom plots, usually showing the number of overlapping genes (i.e. effect size) and the associated significance, while relationships between the individual instances are neither explored nor depicted. To address this, we propose a tool for better exploration and visualization of GSOA results, called GSOAP (Gene Set Over-representation Analysis Plotter).
2 Materials and methods
GSOAP generates plots where instances are depicted as non-overlapping circles whose radius represents the number of query gene members, and distances among them reflect mutual overlaps of instance member query genes. Visual features, such as color and opacity are used to show significance, centrality, or other instance characteristics.
GSOAP is implemented as an R package that contains two major functions: gsoap_layout and gsoap_plot. The first function generates x, y coordinates of the circles, their radius and other properties derived from the input, referred to as layout. The input of the GSOAP is a list of instances along their respective query gene members and associated P-values, or their counterparts adjusted for multiple-testing, which should be obtained from a previously run GSOA (some of the compatible tools are listed in Section 4).
Association matrix is used to calculate dissimilarities between the instances, applying user-specified binary distance measure (Jaccard distance by default). Obtained dissimilarity matrix D is a square real matrix, where Di,k ∈ [0, 1] is a dissimilarity between instance i and instance k.
User-specified projection method is applied to map each instance into a 2D space, so that the Euclidean distances between the projections preserve original dissimilarities. Projection methods include: multidimensional scaling (MDS; Borg and Groenen, 2003), Isomap projection (Tenenbaum et al., 2000), curvilinear component analysis (CCA; Demartines and Hérault, 1997) and t-distributed stochastic neighbor embedding (tSNE; van der Maaten and Hinton, 2008). Obtained x and y coordinates are then scaled to [0, 1] interval.
In order to increase visual clarity, GSOAP applies a procedure known as circle packing (Collins and Stephenson, 2003) to eliminate overlaps between the circles. Circle packing moves the centers of the circles so that the circles do not overlap, but their mutual distances are preserved.
The distortion between the original dissimilarities D and the Euclidean distances of the circles E after packing is evaluated by Kruskal stress (Sturrock and Rocha, 2000) and by Spearman’s rank correlation coefficients; and reported to the user.
Under default parametrization, GSOAP can accommodate up to ∼100 instances, without causing substantial distortion, or reducing visual clarity of the resulting plots. Plotting larger number of instances may require user to decrease the value of the scale factor s.
Weighted hierarchical clustering is then performed using the original dissimilarity matrix D; using instance significance as its weight. Resulting dendrogram is subsequently cut into K clusters, where K may be specified by the user directly, or can be selected by the algorithm from range specified by the user. In the second case GSOAP will identify the optimal number of clusters with respect to either point biserial correlation coefficient, Hubert’s gamma, silhouette, Calinski–Harabasz index, coefficient of determination, Hubert’s C or their combination.
The obtained layout can be then plotted by the gsoap_plot function. Color and opacity (alpha) of the circles can be used to depict instance cluster membership, significance, closeness, or other instance characteristics provided by the user. User can also specify the subset of instances, labels of which are to be depicted in the resulting plot. The labels are repelled from each other to prevent overlaps.
3 Results
GSOAP functionality was demonstrated on the results of pathway enrichment analysis of 72 genes from our previous study (Tokar et al., 2018). The genes were found to be differentially expressed across multiple lung adenocarcinoma datasets. To identify enriched pathways we used Pathway Data Integration Portal (PathDIP; v3.0; Rahmati et al., 2017). PathDIP performs GSOA across an extensive compendium of pathways, collected from multiple pathway sources. Obtained results were then reduced to significantly enriched pathways (FDR < 0.05), comprising 170 pathways. Of these we selected the 100 most significant instances. Finally, we applied GSOAP functions gsoap_layout and gsoap_plot to create the layout and to generate the plots (Fig. 1). To demonstrate visualization options provided by GSOAP, multiple plots were generated, using different settings.
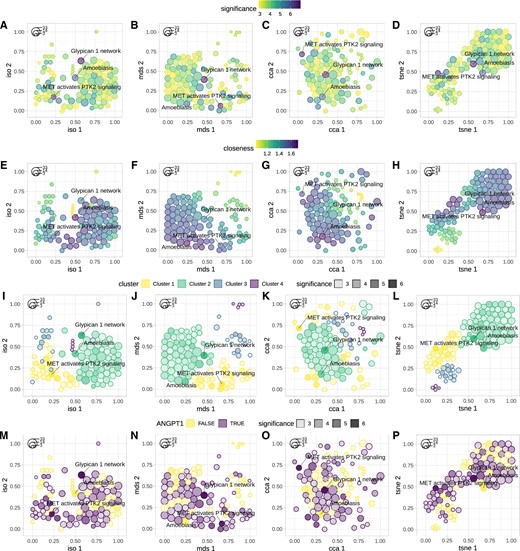
Examples of GSOAP visualization. Instances are depicted as packed circles in 2D space, using Isomap, MDS, CCA or tSNE (left to right). Color is used to highlight instance significance, i.e. −log10 of the FDR-adjusted P-values (A–D), closeness centrality (E–H) and cluster membership (I–L; top to bottom). In addition, color was used to highlight presence of the selected gene (e.g. ANGPT1) across the instances (M–P). Opacity (alpha) was used to depict instance significance (−log10 of FDR; I–P). Effects size (number of overlapping query genes), is mapped to circle size (the legend in the top-left corner of each figure). To demonstrate GSOAP’s ability to depict and repel the instances labels, the three most significant instances were labeled across all the plots
4 Conclusion
GSOAP provides a simple yet efficient tool for exploration and visualization of the results obtained by GSOA. It can visualize the results obtained from the most common GSOA tools, including PathDIP (Rahmati et al., 2017), clusterProfiler (Yu et al., 2012) and topGO (Alexa and Rahnenfuhrer, 2016). GSOAP can be installed from https://github.com/tomastokar/gsoap.
Funding
This work was supported in part by funding from Ontario Research Fund [RDI No. 34876], Natural Sciences Research Council [NSERC No. 203475], Canada Foundation for Innovation [CFI Nos. 225404 and 30865] and IBM and Ian Lawson van Toch Fund.
Conflict of Interest: none declared.
References

