


Abstract
In gene expression and genome-wide association studies, the identification of interaction effects is an important and challenging issue owing to its ultrahigh-dimensional nature. In particular, contaminated data and right-censored survival outcome make the associated feature screening even challenging.
In this article, we propose an inverse probability-of-censoring weighted Kendall’s tau statistic to measure association of a survival trait with biomarkers, as well as a Kendall’s partial correlation statistic to measure the relationship of a survival trait with an interaction variable conditional on the main effects. The Kendall’s partial correlation is then used to conduct interaction screening. Simulation studies under various scenarios are performed to compare the performance of our proposal with some commonly available methods. In the real data application, we utilize our proposed method to identify epistasis associated with the clinical survival outcomes of non-small-cell lung cancer, diffuse large B-cell lymphoma and lung adenocarcinoma patients. Both simulation and real data studies demonstrate that our method performs well and outperforms existing methods in identifying main and interaction biomarkers.
R-package ‘IPCWK’ is available to implement this method, together with a reference manual describing how to perform the ‘IPCWK’ package.
Supplementary data are available at Bioinformatics online.
1 Introduction
Knowledge about interactions among genes plays a crucial role in understanding the functional relationship of genes with gene-pathways. Furthermore, Cordell (2009) indicated that the development of a disease is a complex process that may result from joint effects of multiple genes, that is, epistasis. In gene expression and genome-wide association studies (GWAS), the number of potential biomarkers is far greater than the sample size, hence the discovery of the gene–gene interactions that account for the phenotype of interest is crucial to develop a prediction model for the phenotype. Accordingly, interaction identification has been a very important and widely studied issue in bioinformatics literature (Fang et al., 2017; Hao and Zhang, 2014; Stanislas et al., 2017; Wang and Chen, 2018; Wang et al., 2011, 2012; Xu et al., 2018 and so on).
The traditional statistical methods for interaction screening may not apply in the ultrahigh-dimensional setting of the gene expression analysis and GWAS. Wu et al. (2009) proposed the two-stage selection method, where some important predictors are first selected from all main predictors, then the relevance of the interactions corresponding to the main effects selected in the first step are examined in the second step. The two-stage selection method is easy to implement and hence popular. This method, however, tends to miss interaction effects when the individual marginal main effects are uncorrelated with the trait. Another common strategy is to fit a penalized regression model with both main and interaction effects penalized (see, e.g. Choi et al., 2010; Park and Hastie, 2008). However, such methods are computational expensive and hence less feasible in the ultrahigh-dimensional setting such as GWAS.
In this article, we would like to utilize a marginal statistic to conduct interaction screening. In the context of linear regression models, the Pearson correlation screening (Fan and Lv, 2008) has been shown to be useful for ultrahigh-dimensional data. As indicated in Niu et al. (2018), one intuitive idea for interaction screening is to treat the main and interaction variables just as independent features and rank all the features based on their absolute marginal correlation. This naive method can be problematic in practice, since it ignores the intrinsic relationship of main effects with interactions. To improve the naive correlation ranking method for interaction screening, Niu et al. (2018) considered partial (Pearson) correlation as a marginal statistic for interaction screening. Here, partial correlation is used to measure the relationship between the response variable and the interaction variable conditional on the main effects. Namely, the influence of the parental main effects is removed by using partial correlation when assessing the interaction effect. The ‘interaction screening by partial correlation (ISPC)’ procedure in Niu et al. (2018) thus has some advantages: the ISPC approach does not rely on specific modeling assumptions and is more flexible, and the marginal statistic is easy and fast to calculate for big data with ultrahigh-dimensional features. The ISPC approach can also be extended to non-parametric correlation statistics, such as Spearman’s and Kendall’s tau rank correlation (Kendall, 1942).
Kendall’s tau (Kendall, 1962) is a rank statistic used to measure the ordinal association between two random variables. It has several advantages compared to Pearson correlation. First, the measure is not influenced by outliers, which is a major concern in gene expression data analysis where contaminated data are common. Second, it is a model-free measure, so it is robust and flexible to modeling assumptions. In this work, we use Kendall’s tau to measure the association between the survival trait and the covariates such as gene expressions. Song et al. (2014) proposed a censored rank statistic for screening ultrahigh-dimensional covariates with survival outcome, which uses the inverse probability-of-censoring weighted (IPCW) statistic to accommodate right-censored outcome data and is shown to enjoy the sure screening property. However, as we will show below, the IPCW Kendall’s tau (IPCW-tau) statistic proposed by Song et al. (2014) has the tendency to miss the predictors with negative correlation with the survival outcome. We will propose the IPCW-tau statistic that modifies the IPCW-tau proposed by Song et al. (2014) to eliminate the drawback, and develop a new interaction screening procedure, termed ‘partial correlation IPCW-tau (PC-IPCW-tau)’, using the partial correlation statistic derived from IPCW-tau as a marginal interaction screening statistic.
In simulation studies, we first compare the performance of IPCW-tau with the IPCW-tau proposed by Song et al. (2014) and some other alternatives in the setting of main-effect selection, and then compare the proposed PC-IPCW-tau procedure with some existing methods in the context of interaction screening. In the real data applications, we apply the proposed PC-IPCW-tau procedure to identify epistasis that is associated with the clinical survival outcome of non-small-cell lung cancer (NSCLC), diffuse large B-cell lymphoma and The Cancer Genome Atlas lung adenocarcinoma patients.
2 Materials and methods
We first define our proposed IPCW-tau to measure the association of the survival trait with gene expression, and then utilize the proposed rank statistic to define Kendall’s partial correlation and conduct screening for gene–gene interaction.
2.1 Inverse probability-of-censoring weighted Kendall’s tau
Let T and C denote, respectively, the survival and censoring times of a subject, the censored survival time and the indicator of failure. Let x a p-dimensional covariate vector, where p may be much larger than the cohort size n. Throughout the article, we use X to denote a generic element in x, subindexed notation such as Xj denote the jth element in x () and parenthesized subindices denote subjects in the sample.
We, however, observe that the IPCW-tau statistic in Song et al. (2014) has the tendency to omit covariates with negative association with the survival outcome. The reason is that, owing to the inverse probability-of-censoring weighting, the estimated concordance probability, , and the estimated disconcordance probability, , are not symmetric (about one), that is, their sum is not a constant (one); in fact, their sum is data dependent and not a constant. The IPCW-tau statistic , which considers only the concordance probability, is valid for association screening only when the concordance and disconcordance probabilities are symmetric.
2.2 Kendall’s partial correlation with survival trait
- Standardize the second-order variables:
- Calculate the Kendall’s partial correlation as:
- Determine a data-dependent threshold value λn and obtain a selected set of second-order (quadratic and two-way interaction) predictors for the survival outcome:
2.3 Evaluation of survival prediction performance
In order to assess the performance of survival prediction, let be the estimate of the penalized Cox’s regression parameter in a prediction model obtained from the training data, and the survival and predictor data of subject i in the test data. We consider the Cox’s regression with the MCP penalty (Zhang, 2010) as the prediction model in the following simulations and analysis. Define as the prognosis index (PI) value for subject i. We consider three prediction accuracy measures. The prediction accuracy measure Cox-test is the P-value of PI when PI is used as the covariate in the univariate Cox model for the survival outcome in the test data. The prediction accuracy measure LR-test is the P-value of the log-rank test for the null hypothesis of equality of the survival function between the ‘poor’ and ‘good’ prognosis groups in the test data, which are formed according to whether the PI value is higher or lower than the median PI value in the test data. Smaller values of the Cox-test and LR-test measures would suggest better prediction accuracy. In addition, the prediction accuracy measure c-index proposed by Harrell et al. (1996) is considered, and a larger c-index corresponds to better prediction accuracy.
3 Results
3.1 Comparison with alternative methods in identifying true predictors
We first perform a series of simulations to investigate the performance of the proposed IPCW-tau statistic in identifying true predictors for survival trait, and compare the IPCW-tau method with the ‘PL’, ‘IPCW(S)’ and ‘Kendall’s tau’ methods. The PL method is the partial-likelihood screening, which fits a marginal Cox’s regression model for each predictor and takes the corresponding partial likelihood value as the screening measure; this method is commonly adopted in practice (Fan et al., 2010; Zhao and Li, 2012). The IPCW(S) method is the IPCW-tau statistic proposed by Song et al. (2014). The Kendall’s tau method is the naive method treating censored survival time observations as exact ones and using the conventional unweighted Kendall’s tau statistic.
The censoring time distribution follows a uniform distribution U(0, c), where c is chosen so that the censoring rate is ∼25%, 50% or 80%, respectively. Moreover, the covariates might be contaminated by outliers generated from a t distribution with two degrees of freedom with a probability of 0.1. Such an error distribution represents the case where the expression data can be contaminated by errors with large variation, which is common in gene expression studies. For each simulation scenario, we conduct 200 replications to examine the numerical performances of different methods.
We report the mean numbers of true predictors included by the top 15, 30, 45, 60, 75, 90, 120 and 150 selected variables for each method among 200 replications. The numerical results are summarized in Figure 1 (for cohort size of 100), and Supplementary Figures S1 and S2 (for cohort sizes of 300 and 500). From these figures, we see that the IPCW-tau approach is superior to all alternative methods in variable screening, in that the IPCW-tau approach has the highest mean numbers of true predictors included by the selected set of variables with a given set size. In particular, the IPCW-tau method performs substantially better than all the other methods when the censoring rate is high. The accuracy of the variable screening, as reflected by the mean numbers of true predictors included by the selected variables, for the IPCW-tau method increases when the cohort size increases or the censoring rate decreases.
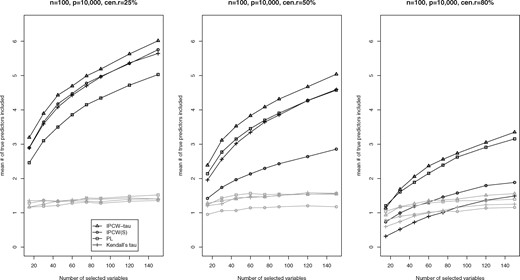
Mean numbers (SDs in gray lines) of true predictors included by the top 15, 30, 45, 60, 75, 90, 120 and 150 selected variables under the scenario with cohort size equal to 100 and contaminated covariates
To assess the impacts of different screening methods on survival prediction, we simulate training and test data from the same survival time/covariate distributions as above, with the training sample size equal to 100 or 300 and the test sample size fixed at 50. We report in Table 1 the proportions of significant LR-test (LR-test P-value <0.05) over 200 simulation replications, which reflect the abilities of distinguishing good and poor prognosis groups for different methods. We can see that the proposed IPCW-tau method performs better in this regard than the other methods.
Proportions of significant LR-test (LR-test P-value <0.05) over 200 simulation replications for different variable screening methods
| Training.s/cen.r (%) | PL | Kendall’s tau | IPCW(S) | IPCW-tau |
|---|---|---|---|---|
| 100/25 | 0.265 | 0.340 | 0.325 | 0.325 |
| 100/50 | 0.245 | 0.215 | 0.085 | 0.285 |
| 100/80 | 0.115 | 0.065 | 0.080 | 0.120 |
| 300/25 | 0.945 | 0.990 | 0.985 | 0.985 |
| 300/50 | 0.870 | 0.905 | 0.190 | 0.915 |
| 300/80 | 0.350 | 0.230 | 0.135 | 0.400 |
Note: The test sample size is fixed at 50.
training.s, training sample size; cen.r, censoring rate.
In Supplementary Section B, we provide further simulation results for the settings with uncontaminated covariates, and with alternative covariate distributions and dependence structures. All these further simulations reveal consistent results about the advantage of the proposed IPCW-tau method in variable screening and survival prediction.
3.2 Comparison with alternative methods in identifying second-order effects
Xu et al. (2018) developed the censored quantile partial correlation (CQpcorr) to identify interaction effects, which applies the quantile regression technique with weights accommodating censoring. We are interested in comparing the CQpcorr approach with our proposed PC-IPCW-tau method in the accuracy of second-order predictor selection. Besides, we consider the IPCW-tau and PL approaches as in Section 3.1, which view each second-order variable as an independent predictor, and apply the IPCW-tau statistic and the partial likelihood value, respectively, to assess the association between each second-order variable and the survival trait without adjusting for the main effects.
The censoring time distribution follows a uniform distribution , where is chosen to control the censoring rate ∼30%, 45%, 60% or 75%, respectively. The covariates might be contaminated by outliers generated from a t distribution with two degrees of freedom with a probability of 0.1. For each simulation setting, we conduct 200 replications to examine the performances of different methods.
In Figure 2, we display the mean numbers of true second-order (quadratic and two-way interaction) predictors included by the top selected variables among 200 replications. From Figure 2, we see that the proposed PC-IPCW-tau approach is superior to all the alternative methods for identifying second-order predictors; in that, the PC-IPCW-tau has the highest mean number of true second-order predictors in the selected variable set with a given set size. In Table 2, we report the median of the minimum model size (MMS) statistic over 200 simulation replications, where the MMS is the minimum size of the selected set of second-order variables that includes all the true active predictors. The MMS statistic is used to assess the resulting model complexity and hence precision for a screening procedure, with a smaller MMS value indicating higher accuracy of variable screening. From Table 2, we can see that the PC-IPCW-tau approach is superior to all the alternative methods for screening second-order predictors. In particular, the PC-IPCW-tau method is more efficient in screening second-order predictors than the IPCW-tau method, showing the advantage of accounting for the relationship between the second- and first-order effects in identifying the second-order effects.
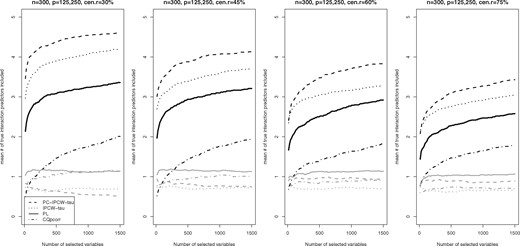
Mean numbers (SDs in gray lines) of true second-order predictors included by the top 15, 30, …, 1485, 1500 selected variables under the scenario with cohort size equal to 300
The median of the minimum model size out of 200 replications under the scenario with cohort size equal to 300
| cen.r (%) | PL | IPCW-tau | PC-IPCW-tau | CQpcorr |
|---|---|---|---|---|
| 30 | 28 684 | 6149 | 633 | 80 817 |
| 45 | 30 412 | 15 797 | 3108 | 78 505 |
| 60 | 45 582 | 27 477 | 5769 | 87 657 |
| 75 | 62 944 | 58 980 | 19 451 | 81 369 |
| cen.r (%) | PL | IPCW-tau | PC-IPCW-tau | CQpcorr |
|---|---|---|---|---|
| 30 | 28 684 | 6149 | 633 | 80 817 |
| 45 | 30 412 | 15 797 | 3108 | 78 505 |
| 60 | 45 582 | 27 477 | 5769 | 87 657 |
| 75 | 62 944 | 58 980 | 19 451 | 81 369 |
cen.r, censoring rate.
The survival prediction accuracy resulting from different second-order screening methods is evaluated by the proportion of significant LR-test (LR-test P-value <0.05) over 200 simulation replications, where the training sample (of size 300) and test sample (of size 100) are simulated from the same survival time/covariate distributions as above. As we can see from Table 3, the PC-IPCW-tau method has the highest survival prediction accuracy, followed by the IPCW-tau method.
Proportions of significant LR-test (LR-test P-value <0.05) over 200 simulation replications for different interaction screening methods
| cen.r (%) | PL | IPCW-tau | PC-IPCW-tau | CQpcorr |
|---|---|---|---|---|
| 30 | 0.205 | 0.340 | 0.315 | 0.200 |
| 45 | 0.280 | 0.290 | 0.350 | 0.260 |
| 60 | 0.360 | 0.470 | 0.510 | 0.220 |
| 75 | 0.560 | 0.630 | 0.685 | 0.320 |
| cen.r (%) | PL | IPCW-tau | PC-IPCW-tau | CQpcorr |
|---|---|---|---|---|
| 30 | 0.205 | 0.340 | 0.315 | 0.200 |
| 45 | 0.280 | 0.290 | 0.350 | 0.260 |
| 60 | 0.360 | 0.470 | 0.510 | 0.220 |
| 75 | 0.560 | 0.630 | 0.685 | 0.320 |
Note: The training and test sample sizes are 300 and 100, respectively.
cen.r, censoring rate.
Moreover, we examine the performances of the PC-IPCW-tau approach under the settings with small effect sizes, with alternative covariate dependence structure and with alternative survival time distributions. These additional simulations show that the PC-IPCW-tau and IPCW-tau methods outperform alternative methods. Please see Supplementary Section B for these additional simulations.
3.3 Real data analysis: NSCLC data
The NSCLC data of Chen et al. (2007) are available from NCBI with accession number GSE4882. The data contain censored survival outcomes from 125 lung cancer patients and their gene expression profiles for 672 genes. The censoring rate is 65%. Following Emura et al. (2012), we consider the subset consisting of 473 genes, which lead to a total of 112 574 main and second-order (quadratic and two-way interaction) predictors. Following Chen et al. (2007), we divide the patients into 63:62 training/test sets.
We apply four screening methods [‘IPCW(S)’, ‘IPCW-tau’, ‘PL’ and ‘PC-IPCW-tau’] to the NSCLC data, where the former three screening methods treat the second-order covariates as independent predictors without adjusting for their dependence on the main covariates. After a grid search from 20 to 160 with step size 5, the number of candidate covariates, including both first- and second-order covariates, that yields the best overall performance for all methods is 140, so the top 140 predictors ranked by each method are selected as the candidate covariates, and the Cox’s regression model with the candidate covariates and the MCP penalty (Zhang, 2010) is applied to the training data to establish the final prediction model. We finally identify no main predictor, but 11, 11, 11 and 3 two-way interaction predictors by the PL, IPCW(S), IPCW-tau and PC-IPCW-tau approaches, respectively, together with the MCP-penalized regression. In addition, the Cox model with the whole 112 574 main and second-order predictors and the MCP penalty is applied directly to the training data to build the prediction model. This ‘Ordinary MCP’ approach finally selects 1 main and 12 two-way interaction predictors as the final prediction model. The penalized Cox’s regression with the MCP penalty can be performed by the R function ‘ncvsurv’ of the R-package ‘ncvreg’ (Breheny and Huang, 2011). The complete lists of the predictors selected by these methods are shown in Supplementary Section C.
Table 4 shows the prediction accuracy performances of different methods in the test set of the NSCLC data, where the three prediction accuracy measures in Section 2.3 are considered. Figure 3 displays the Kaplan–Meier survival curves for the two prognosis groups, ‘poor’ (red) and ‘good’ (blue) prognosis groups classified according to whether the PI value exceeds the median PI value, in the test set of the NSCLC data for each variable screening method.
![Kaplan–Meier survival curves for the two prognosis groups [‘good’ (blue), ‘poor’ (red) groups according to the median of the PI values] in the test sample of the NSCLC data](https://oup.silverchair-cdn.com/oup/backfile/Content_public/Journal/bioinformatics/36/9/10.1093_bioinformatics_btaa017/2/m_bioinformatics_36_9_2763_f3.jpeg?Expires=1716376373&Signature=NCbqGFSuuNAVr7CAGiTZAY-S5nNYv~MI5cv4EbuOwEit9bVpP914me-qMW3qQtsdkl6Xb8caPG3oFmm2IYUOfC3xX9nCNh5Wzg16R2BbfuiwQxDcX~8WlQdEb9QDvUQwZdaUsII2zuz2pVRJUmbUKiW21nWIsx774QB2vOV19rp2dKh-ifALETQikOUddhjOFLysqQRpG5yYtfEwteFMlWKNoxLsRmCW64k07zWTmBglbJCuv-G8a6ndX0hcA0P6P92T1aNjvEJx5b5YKkTYfXi8M-6bClgGdGxIrale5snP94HfImGXMNFuEwbl28mjgkvAAEYIhLLlTJ~cjKtDwQ__&Key-Pair-Id=APKAIE5G5CRDK6RD3PGA)
Kaplan–Meier survival curves for the two prognosis groups [‘good’ (blue), ‘poor’ (red) groups according to the median of the PI values] in the test sample of the NSCLC data
Results of prediction accuracies of different methods in NSCLC data (using the training and test sets as in Chen et al., 2007)
| PL | IPCW(S) | IPCW-tau | PC-IPCW-tau | Ordinary | |
|---|---|---|---|---|---|
| Cox-test | 0.1632 | 0.9189 | 0.4942 | 0.3451 | 0.3347 |
| LR-test | 0.7599 | 0.6670 | 0.1851 | 0.0027 | 0.1266 |
| c-index | 0.5972 | 0.4549 | 0.5858 | 0.6029 | 0.5832 |
| PL | IPCW(S) | IPCW-tau | PC-IPCW-tau | Ordinary | |
|---|---|---|---|---|---|
| Cox-test | 0.1632 | 0.9189 | 0.4942 | 0.3451 | 0.3347 |
| LR-test | 0.7599 | 0.6670 | 0.1851 | 0.0027 | 0.1266 |
| c-index | 0.5972 | 0.4549 | 0.5858 | 0.6029 | 0.5832 |
Note: All methods are applied together with the MCP-penalized Cox regression.
From Table 4, in two (LR-test, c-index) of the three prediction accuracy measures, the PC-IPCW-tau method with the MCP penalty has better performances in the NSCLC test data compared to the other methods. From Figure 3, we see that the survival curves for the good and poor prognosis groups are better separated by the PC-IPCW-tau than by the other methods, and the corresponding LR-test P-value is highly significant (P = 0.0027), even higher than the corresponding results from the compound shrinkage (P = 0.179; Emura et al., 2012) and the overlapping group screening (P = 0.325; Wang and Chen, 2018) methods.
The 3 two-way interaction biomarkers identified by the PC-IPCW-tau method with the MCP penalty are ‘PDCD2-EMP1’, ‘IRF4-WDTC1’ and ‘STAT2-JMJD1A’. The three interaction effects (coefficients) are similar in magnitude, although the PDCD2-EMP1 effect is negative (i.e. beneficial for survival), while the other two are positive (detrimental for survival). We note that the IRF4-WDTC1 interaction is also identified by the IPCW-tau and the ordinary MCP methods. The IRF4 and WDTC1 genes belong to the EGR1 gene set (Brown et al., 2015), which has been shown to function as a tumor suppressor in NSCLC (Zhang et al., 2014). The STAT2 and JMJD1A genes are both found to be associated with NSCLC (Yang et al., 2019; Zhan et al., 2016), and are two common interactors between PCBP2 and ZCCHC3 proteins (McDowall et al., 2009; Scott and Barton, 2007). The PDCD2 and EMP1 genes have co-occurred with the NSCLC tissue in abstracts of biomedical publications from the TISSUES database (Palasca et al., 2018; Santos et al., 2015). Further, using the SCAD (Fan and Li, 2001) instead of the MCP penalty together with the PC-IPCW-tau method identifies the same 3 two-way interaction predictors (see the Supplementary Material for the prediction performance results using the SCAD penalty).
In Supplementary Section C, we provide the analysis results for the diffuse large B-cell lymphoma (Lenz et al., 2008) and The Cancer Genome Atlas lung adenocarcinoma (Chang et al., 2015) data. The proposed PC-IPCW-tau approach consistently performs well in these datasets.
4 Conclusion and discussion
There has been a long-lasting interest for detecting pairwise gene–gene interactions in the bioinformatics field. In this article, we have proposed an IPCW-tau statistic to measure the association of a right-censored survival trait with biomarkers, and the associated Kendall’s partial correlation to reflect the relationship of the survival trait with second-order variables conditional on the main effects. In simulation and real data studies, we demonstrate that the newly proposed method can provide substantially higher accuracy of gene and gene–gene interaction selection and hence lead to more accurate survival prediction than existing methods. We provide the R-package ‘IPCWK’ to compute the proposed IPCW-tau and the Kendall’s partial correlation statistics, together with a reference manual describing how to perform the ‘IPCWK’ package.
In this article, for simplicity, we focus specifically on second-order interactions that contain quadratic and two-way interactions. Although the same idea may be applied to the issue of the assessment of higher order interactions, the associated computational complexity seems challenging and will be studied in detail in our future work. In addition, as gene–environment (G–E) interactions have important implications for the etiology and progression of many complex diseases (Xu et al., 2018), the application of the PC-IPCW-tau procedure in the G–E interaction context is promising and deserves further research.
An important practical issue in a variable screening procedure is to determine the threshold value for screening. In this article, we adopt a hard thresholding rule proposed by Fan and Lv (2008) to select the candidate covariate set; that is, picking a fixed number of top significant predictors as our candidate set of predictors after ranking the covariates. Several alternative strategies for determining the threshold value have also been discussed, such as the soft thresholding rule proposed by Zhu (2011) that incorporates auxiliary variables for thresholding, and the method based on the control of the false-positive rate or false-discovery rate by Zhao and Li (2012). Comparison of the different ways of threshold value determination in the context of interaction screening would be of practical interest and importance. We will also study this issue in our future work.
Acknowledgements
We are very grateful to the referees for their very valuable comments that helped to improve the article.
Funding
This work was supported by the Ministry of Science and Technology of Republic of China (Taiwan) [grant MOST 106-2118-M-001-016-MY3].
Conflict of Interest: none declared.
References

