


Abstract
The studies have indicated that not only microRNAs (miRNAs) or long non-coding RNAs (lncRNAs) play important roles in biological activities, but also their interactions affect the biological process. A growing number of studies focus on the miRNA–lncRNA interactions, while few of them are proposed for plant. The prediction of interactions is significant for understanding the mechanism of interaction between miRNA and lncRNA in plant.
This article proposes a new method for fulfilling plant miRNA–lncRNA interaction prediction (PmliPred). The deep learning model and shallow machine learning model are trained using raw sequence and manually extracted features, respectively. Then they are hybridized based on fuzzy decision for prediction. PmliPred shows better performance and generalization ability compared with the existing methods. Several new miRNA–lncRNA interactions in Solanum lycopersicum are successfully identified using quantitative real time–polymerase chain reaction from the candidates predicted by PmliPred, which further verifies its effectiveness.
The source code of PmliPred is freely available at http://bis.zju.edu.cn/PmliPred/.
Supplementary data are available at Bioinformatics online.
1 Introduction
Non-coding RNAs (ncRNAs) are generally defined as non-protein-coding transcripts that attract a lot of attention (Matsumoto et al., 2017). An increasing number of studies have shown that ncRNAs act in various biological processes, especially microRNAs (miRNAs) and long ncRNAs (lncRNAs) (Wang et al., 2017). miRNAs (sequence length is about 22 nts) regulate gene expression at the post-transcriptional level (Song et al., 2019; Xu et al., 2016; Xu et al., 2019). lncRNAs (sequence length is usually greater 200 nts) involve in epigenetic regulation, transcriptional regulation and so on (Cui et al., 2017, 2019; Liu et al., 2019). In recent years, the interactions between miRNAs and lncRNAs have also been indicated to affect the biological activities. For example, they regulate target genes to play a role in liver fibrogenesis (Bian et al., 2019). The miRNA–lncRNA pairs may be regulatory components during plant resistance to pathogen infection, and some lncRNAs that act as miRNA mimics participated TYLCV and Phytophthora infestans (P.infestans) resistance regulatory process in Solanum lycopersicum (S.lycopersicum) (Jiang et al., 2019; Wang et al., 2015). Pervasive transcription is appeared in different genomes (Bai et al., 2015; Yan et al., 2017; Yu et al., 2018), however, most of related studies focus on the miRNA–lncRNA interactions in animal (Guo et al., 2014; Jalali et al., 2013) and few for plant. The annotation of ncRNAs is far from complete, especially in plant (Bai et al., 2015), and a lot of mechanisms of plant miRNA–lncRNA interaction are unknown. The experimentally confirmed miRNA–lncRNA interactions of plant are quite limited. For example, NPInter v4.0 database (Teng et al., 2019) documents a large number of functional interactions between ncRNAs and biomolecules from more than 30 species, but just 2 species of them are plants. It provides 71 RNA–RNA interactions of these 2 plant species, where only one is an miRNA–lncRNA interaction. To understand the interaction mechanisms between miRNAs and lncRNAs in plant, it is necessary and significant to identify their interactions.
There are three main forms of miRNA–lncRNA interaction in plant. The first is that miRNA targets lncRNA: miR9678 targets lncRNA (WSGAR) and triggers the generation of phased small interfering RNAs that play a role in the delay of seed germination in Triticum aestivum (Guo et al., 2018). The second is that lncRNA suppresses miRNA: lncRNA23468 as a miRNA decoy suppresses the expression of miR482b in S.lycopersicum (Jiang et al., 2019). The last is that lncRNA acts as a precursor of miRNA: lncRNAs TCONS_00012662 and GRMZM2G420571_T01, as the precursors of miR167j and miR172c, respectively, may be responsive to drought stress in Zea mays (Zhang et al., 2014). Quantitative real time–polymerase chain reaction (qRT–PCR) is one of biological methods, which can obtain the expression levels of miRNA and lncRNA to preliminary identify the interaction. For the forms that miRNA targets lncRNA and lncRNA suppresses miRNA, the expression levels of miRNA and lncRNA are negatively correlated, which is focused in this study. Though the biological methods identify the relationships of miRNAs and lncRNAs, they are time-consuming and expensive. The bioinformatics technologies provide the predicted results as the references for biological identification, which save a lot of time and costs. With the rapid development of computer technology, there are constantly powerful methods and tools have been published. About miRNA research: a stacked denoising auto-encoders-based method using different levels of features (DeepMirTar) was proposed for predicting human miRNA targets at the site level (Wen et al., 2018); a random forest (RF) and a convolutional neural network (CNN) model were trained, respectively, and employed to predict plant miRNAs (Zhao et al., 2018). About lncRNA research: a bidirectional long short-term memory model and a CNN layer with three additional hidden layers were constituted for predicting lncRNAs of human and mouse (Liu et al., 2019); a tool, named RNAplonc, used 16 selected features to train REPTree for predicting plant lncRNAs (Negri et al. 2019). About the interactions between RNA and protein research: RPITER was a predictor based on hierarchical deep learning framework, which adopted CNN and stacked auto-encoder for predicting ncRNA–protein interactions from widely used databases (Peng et al., 2019); another predictor named PLRPIM for plant ncRNA–protein interactions was proposed, which used a hybrid method to obtain high accuracies (ACCs) for two species (Wekesa et al., 2019). About the interactions between RNAs research: a web server (LncRRIsearch) was developed for human and mouse lncRNA–lncRNA and lncRNA–message RNA interaction prediction (Fukunaga et al., 2019); 18 RNA–RNA interaction prediction tools for mammalian species were reviewed and tested (Antonov et al., 2019). These studies have made significant contributions; however, they are mainly predicting miRNAs, lncRNAs and ncRNA–protein interactions. Although there have the predictors for RNA–RNA interactions, they are not developed for plant. Our previous work used a shallow machine learning model to predict plant miRNA–lncRNA interactions (Bouba et al., 2019). In addition to this, there are currently few related predictors that have been published. ncRNAs are mainly transcribed by RNA polymerases II and III in animal, however, a part of transcriptions are completed by RNA polymerases IV and V in plant (Zhang et al., 2013; Zhou and Law, 2015). lncRNAs have the characteristic of low sequence conservation, especially among distant species (Noviello et al., 2018). It means that the predictors which are trained using the animal data do not guarantee the reliability when they are applied to plant. Therefore, it is a pressing need to construct reliable and powerful predictors for plant miRNA–lncRNA interactions.
The shallow machine learning methods are usually necessary to manually design the features as the inputs, which limits their ability to process natural data in the raw form (LeCun et al., 2015). The deep learning methods use a general-purpose learning procedure to learn the abstract features from raw data (LeCun et al., 2015), however, they may ignore the useful information in the manually extracted features (Wen et al., 2018). Ensemble model learns the information from multiple perspectives that obtains better performance than a single model (Moyano et al., 2018). Thus, a model can be constructed for predicting plant miRNA–lncRNA interactions that hybridizes both deep learning and shallow machine learning, utilizes both raw sequences and manually extracted features, and comprehensively assesses the decisions from different models. It is interesting and worth trying.
This article proposes a new method based on hybrid model and fuzzy decision for fulfilling plant miRNA–lncRNA interaction prediction (PmliPred). CNN and gated recurrent unit (GRU) are both deep learning technologies. CNN automatically extracts the abstract features from different levels of the raw sequences by convolution operation and compresses them in the flatten layer into a one-dimension vector as the input to GRU, and GRU is suitable for handling such a sequence (vector) with the correlated information (Che et al., 2018; LeCun et al., 2015). The fuzzy set theory simulates the uncertainty and imprecision when a model is making a decision (Rosso-Cerón et al., 2019). It provides a method for dealing with such problems that the imprecision come from the absence of sharply defined criteria for class membership rather than the random variables (Reis, 2019). These techniques and theory are borrowed in the proposed method. A deep learning model [CNN-bidirectional GRU (BiGRU)] is constructed by hybridizing CNN and BiGRU. CNN-BiGRU and a shallow machine model (RF) are trained using the encoded raw sequences and manually extracted features, respectively. Inspired by fuzzy set theory, the trained CNN-BiGRU and RF are hybridized based on fuzzy decision to obtain PmliPred. The parameter and weight strategy of PmliPred are adjusted to maximize the performance. PmliPred is compared with several existing methods to verify the performance and generalization ability. Furthermore, it is applied to predict miRNA–lncRNA interactions in S.lycopersicum. A set of candidates from the predicted results are selected for biological identification, where the expression levels of miRNA and lncRNA of 73% candidates are negatively correlated.
2 Materials and methods
2.1 Construction of datasets
The research for animal can use the experimentally confirmed miRNA–lncRNA interactions to construct the datasets (Huang et al., 2019). For plant, there is currently no public miRNA–lncRNA interaction database available and the experimentally confirmed interactions that can be collected are far less than those of animals are. We download miRNA sequences from miRBase (Release 22.1) (Kozomara et al., 2019) and lncRNA sequences from GreeNC (v1.12) (Gallart et al., 2016) and CANTATAdb2.0 (Szcześniak et al., 2016), and construct the datasets as follows.
RNAhybrid 2.1.2 is used to obtain the original candidates of miRNA–lncRNA interaction that the binding energy is <−25 kcal/mol and the 2–8th in seed region from the 5′ end are ensured to match completely (Krüger and Rehmsmeier, 2006). To enhance the credibility, these candidates are filtered based on RNA structural characters. Three filtering conditions (Franco-Zorrilla et al., 2007; Wu et al., 2013) are the 10–12th from the 5′ end of the miRNA sequence must have at least one raised point; the raised points on the lncRNA sequence except for the both ends are only allowed to contain 2–4 nts; except for both ends and raised points, the number of mismatches on miRNA is not more than 4 and the number of consecutive mismatches is not more than 2. After filtering, the reserved candidates are used as the positive dataset.
The positive dataset involves almost all miRNAs and many lncRNAs (here named PlncRNAs). There are also some lncRNAs are not involved in the positive dataset (here named NlncRNAs). Thus NlncRNAs are aligned one-to-one with PlncRNAs through Needleman–Wunsch algorithm (Nanni and Lumini, 2008), and those with an identity of more than 80% are filtered out (Negri et al., 2019). The reserved NlncRNAs are combined one-to-one with miRNAs as the negative dataset.
We construct the datasets of Arabidopsis thaliana (A.thaliana), Glycine max and Medicago truncatula. 2500 positive samples of each species, totally 7500 samples, are randomly selected from the positive datasets. To solve the unbalance problem, 7500 negative samples which include 2500 samples of each of the three above-mentioned species are randomly selected from the negative datasets. These selected samples are mixed to be a training-validation dataset. We also construct the datasets of Arabidopsis lyrata (A.lyrata) and S.lycopersicum. For each of these two species, 500 samples (250 positive and 250 negative samples) are randomly selected to be a test dataset. Both A.lyrata and A.thaliana belong to the cruciferous family. Solanum lycopersicum and all the species involved in training do not belong to the same family. They are selected as representative species of close genetic relationship and far genetic relationship with the species in training, respectively, to verify the generalization ability of the proposed method for cross-species prediction. In addition, 90 miRNA sequences of S.lycopersicum are selected from the downloaded data. One hundred and fifty lncRNA sequences of S.lycopersicum are selected which have been obtained through transcriptome sequencing in our previous studies (Cui et al., 2020). They are combined to form 13 500 miRNA–lncRNA pairs as the unlabeled dataset. The numeric description of all samples is shown in Supplementary File S1.
2.2 Encoding and feature extraction
The raw sequence of sample is encoded by one-hot encoding (Rodríguez et al., 2018) as the input for CNN-BiGRU. The sample is composed by four different bases, i.e. adenine (A), thymine (T) [uracil (U) in miRNA is encoded according to T], cytosine (C) and guanine (G), which can be transformed into a 0–1 matrix of four rows and N columns, where N is set to the length of the longest sample. For those sequences smaller than N, the zero-padding operation is performed on their empty columns. Here the encoding rule is that, A is encoded as (1, 0, 0, 0)T, T is encoded as (0, 1, 0, 0)T, C is encoded as (0, 0, 1, 0)T, G is encoded as (0, 0, 0, 1)T and zero-padding is encoded as (0, 0, 0, 0)T.
2.3 Architecture of CNN-BiGRU
CNN and BiGRU are hybridized to construct a deep learning model CNN-BiGRU. In CNN, the convolutional layer detects local conjunctions of features from the previous layer to obtain the output feature maps using a set of filters. The pooling layer combines the outputs of one layer of neuron clusters into a single neuron in the next layer. The fully connected layer connects every neuron in one layer to every neuron in another layer. In addition, the batch normalization and dropout layers are added to accelerate training and reduce overfitting. BiGRU includes two gating signals, i.e. an update gate z and a reset gate r, to control the hidden state h at each time t (Che et al., 2018).
The raw sequences of miRNA and lncRNA of each sample are concatenated and encoded to input into CNN-BiGRU. The feature maps are extracted from the encoded sequence by two convolutional layers. The dimensions are reduced by two pooling layers with max-pooling scheme. The feature maps are compressed into a one-dimension vector by a flatten layer. This vector is transferred to BiGRU and the decision is output by the fully connected layer (Fig. 1).
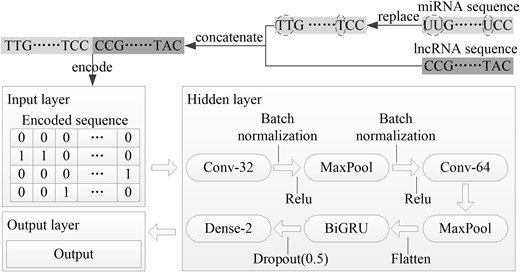
Architecture of CNN-BiGRU. Conv-32 and Conv-64 are the convolution layers with 32 and 64 filters, respectively, Batch normalization is a batch normalization layer, Relu is a Relu activation function, MaxPool is a pooling layer using max-pooling scheme, Flatten is a flatten layer, Dropout(dp) is a dropout layer and its dropout rate is dp, Dense-2 is a fully connected layer with 2 neurons
2.4 Hybridization based on fuzzy decision
The prediction of plant miRNA–lncRNA interactions is originally a two-class classification problem, i.e. using a trained CNN-BiGRU to predict whether there is an interaction between miRNA and lncRNA of a sample or not. Here the decision produced by CNN-BiGRU is fuzzified. It means that, if its decision is not enough to determine whether there is an interaction in the corresponding sample, this decision and the crisp decision produced by a trained RF are comprehensively assessed to finally determine whether there is an interaction in this sample.
2.5 Implementation of PmliPred
CNN-BiGRU is implemented by Keras 2.2.4 and all parameters use the default values from Keras documentation (https://keras.io/). All scripts are written by Python 3.6.5. PmliPred is implemented on PC with 2.81 GHz CPU, 6GB GPU and 8GB RAM memory under a Microsoft Windows 10 operating system.
2.6 Evaluation criteria
The performance of PmliPred is verified according to true positive rate (TPR), positive predictive value (PPV), ACC, F1 score (F1-score) and area under curve (AUC) from receiver operating characteristic (ROC) curve (Wekesa et al., 2019).
2.7 Biological identification
lncRNAs of S.lycopersicum were identified from the transcriptome data of S.lycopersicum L3708 (a resistant accession to P.infestans) uninfected and infected with P.infestans for 3 days in our previous studies (Cui et al., 2018, 2020). PmliPred is applied to predict the interactions between miRNAs and lncRNAs in S.lycopersicum. qRT–PCR is performed to examine their expression levels and identify the interactions.
Solanum lycopersicum L3708 and P.infestans were cultured according to a previous study (Jiang et al., 2018). The five-leaf-stage S.lycopersicum plants were infected with P.infestans spores (106 zoospores/ml) as described previously (Cui et al., 2018). At 0th and 3rd days post-infection, the whole 5th leaf from each S.lycopersicum plant was removed for RNA isolation.
miRNAs, lncRNAs and gene expression were quantified by qRT–PCR using TransScript Green miRNA Two-Step qRT–PCR SuperMix (Transgen Biotech) and SYBR Premix Ex TaqTM II kit (TaKaRa). The S.lycopersicum actin was used as a reference gene, with all primer sequences were listed in Supplementary File S3. All reactions were carried out using three biological replicates. The 2−ΔΔCT method was used to determine and normalize the levels of transcripts in each case.
3 Results
3.1 Effect of threshold and weight strategy variations
The effects of different thresholds (T) and weighted strategies of PmliPred on ACCs are evaluated using 10-fold cross validation (Fig. 2).
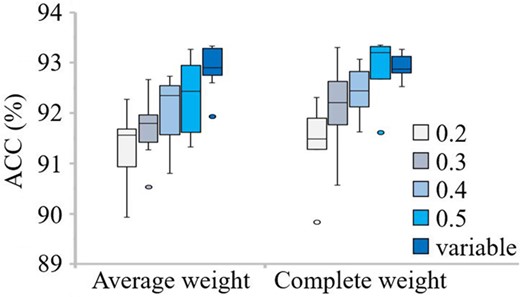
ACCs obtained by PmliPred on different thresholds and weight strategies using 10-fold cross validation
When the average weight strategy is adopted, for the constant threshold, as the value is increased, the obtained result is better, and for the variable threshold, the obtained result is the best. When the complete weight strategy is adopted, the obtained result is also better as the constant threshold is increased, and for the variable threshold, the obtained result is slightly worse than that of using a constant threshold (T = 0.5) and better than those of using the other constant thresholds. However, the result of adopting the complete weight with a constant threshold (T = 0.5) has an abnormal value. No matter which strategy is used, the result of using the variable threshold is better. As the threshold is increased, the constraint Equation (5) is easier to be satisfied. It means that more samples are predicted through comprehensive assessment and higher ACC can be obtained, which matches the above results. The variable threshold can be adaptively adjusted according to different samples and has higher flexibility and diversity. Therefore, it obtains competitive ACC of not lower than a constant threshold, which also matches the above results. When the variable threshold is used, the results of adopting the average weight and complete weight strategies are similar. Since the obtained result of using the average weight strategy has an abnormal value, the complete weight strategy with variable threshold is determined in the following experiments.
3.2 Selection of shallow machine learning model and effect of hybrid method
CNN-BiGRU can be hybridized with various shallow machine learning based on fuzzy decision. Four common shallow machine learning models [support vector machine (SVM), decision tree (DT), k-nearest neighbor (k-NN) and RF] are compared using 10-fold cross validation to select the best one for constructing PmliPred. In addition, PmliPred is compared with the single shallow machine learning (SVM, DT, k-NN and RF) and deep learning (CNN and CNN-BiGRU) methods using 10-fold cross validation to evaluate the effect of hybrid method. The average results are obtained (Fig. 3).
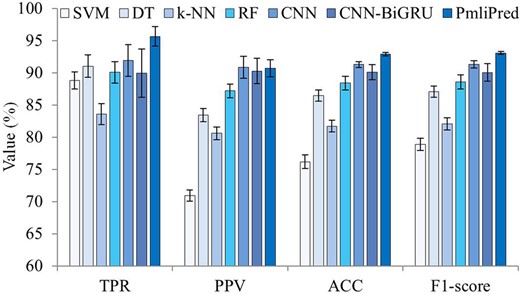
Average results obtained by 7 methods using 10-fold cross validation
RF obtains the best PPV, ACC and F1-score and the second best TPR among all shallow machine learning methods. It shows good stability from its standard deviation bars. PmliPred obtains the best TPR, ACC and F1-score compared with other methods. Just PPV obtained by CNN is slightly better than it obtained by PmliPred. PmliPred also obtains good standard deviation values that show its stability.
Least significant difference test is used to statistically test the results of four measurements obtained by PmliPred compared with six methods. The test results are shown in Table 1.
Least significant difference comparisons of PmliPred and compared methods
| Compared method | P-value | |||
|---|---|---|---|---|
| TPR | PPV | ACC | F1-score | |
| SVM | ≤0.001 | ≤0.001 | ≤0.001 | ≤0.001 |
| DT | ≤0.001 | ≤0.001 | ≤0.001 | ≤0.001 |
| k-NN | ≤0.001 | ≤0.001 | ≤0.001 | ≤0.001 |
| RF | ≤0.001 | ≤0.001 | ≤0.001 | ≤0.001 |
| CNN | ≤0.001 | 0.775 | ≤0.001 | ≤0.001 |
| CNN-BiGRU | ≤0.001 | 0.491 | ≤0.001 | ≤0.001 |
Note: P-value ≤0.05 means that there is a significant difference between the results obtained by PmliPred and compared method at the significant level of mean difference of 0.05.
P-value ≤0.05 means that there is a significant difference between the results obtained by PmliPred and compared method at the significant level of mean difference of 0.05.
PmliPred shows significant TPR, ACC and F1-score over all compared methods and its PPV is also significantly better than that of each shallow machine learning method.
The above results explain the reason why RF is selected for hybridization, show the effect of the proposed hybrid method over each single method, and indicate that PmliPred can predict miRNA–lncRNA interactions of four species involved in training of the model.
3.3 Comparison with existing methods on test datasets
PmliPred is compared with the above six existing methods on two test datasets to verify the performance and generalization ability. To make the results reliable, 10 times of independent experiment are made on each test dataset and the average results are obtained (Fig. 4).
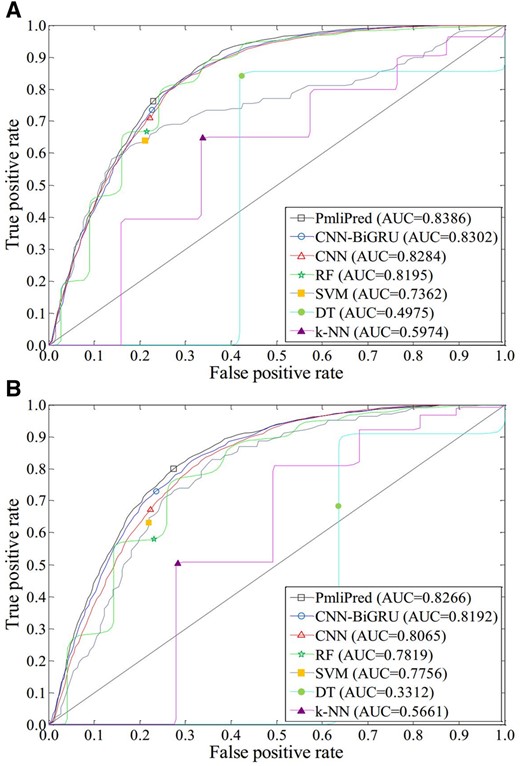
ROC curves obtained by 7 methods on test datasets of two plant species. (A) Arabidopsis lyrata. (B) Solanum lycopersicum
The AUC values obtained by PmliPred on A.lyrata and S.lycopersicum test datasets are 0.8386 and 0.8266, respectively. It shows good performance and generalization ability of PmliPred for cross-species (including the species of close and far genetic relationship with the species in training of the model) prediction.
3.4 Test on identified miRNA–lncRNA interactions
The studies have shown sly-miR482b and sly-miR399 interact with lncRNA23468 and slylnc1077, respectively, in S.lycopersicum (Jiang et al., 2019; Wang et al., 2015). To further verify the performance and generalization ability, PmliPred is used to predict these interactions. Thirty times of independent prediction are made to obtain the results (Fig. 5).
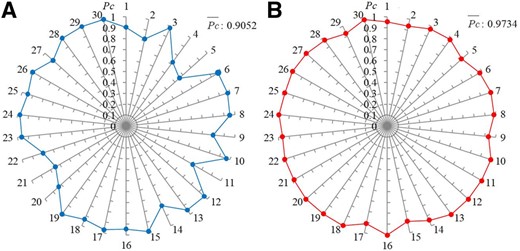
Confidence probability Pc and average confidence probability obtained by PmliPred. (A) Prediction of sly-miR482b–lncRNA23468 interaction. (B) Prediction of sly-miR399–slylnc1077 interaction. 1, 2, …, 30 represent the 1st, 2nd, …, 30th independent prediction, respectively
PmliPred obtains the Pc values of more than 0.5 in all 30 times of independent prediction for these interactions, where the Pc values achieve 0.9 in 21 and 29 times and the values are 0.9052 and 0.9734, respectively. The Pc values obtained by CNN-BiGRU and RF on 30 independent predictions are also recorded in Supplementary File S4. For sly-miR482b–lncRNA23468 interaction, since the complete weight strategy is adopted, 5 of 30 Pc values from PmliPred are provided by RF. Although CNN-BiGRU makes incorrect predictions (Pc obtained by CNN-BiGRU is <0.5) on four of these five independent predictions, the constraint Equation (5) is satisfied and the Pc values of CNN-BiGRU are completely replaced by those of RF, which makes PmliPred to correctly predict the interaction. For sly-miR399–slylnc1077 interaction, 6 of 30 Pc values from PmliPred are provided by RF. CNN-BiGRU makes 30 correct predictions and RF further ensures the ACC. Although in some cases the predicted results are determined by CNN-BiGRU, RF has also proven to be necessary in the hybrid method.
PmliPred can successfully predict these identified miRNA–lncRNA interactions in all independent predictions and the values are both more than 0.9. It means that PmliPred is feasible to provide predicted results for biological identification.
3.5 Biological identification of predicted results obtained by PmliPred
To further verify the effectiveness of PmliPred, it is applied to predict the interactions in miRNA–lncRNA pairs from the unlabeled dataset. qRT–PCR is performed to examine the expression levels of miRNAs and lncRNAs and identify the interactions. To save time and costs and enhance the credibility, the results with the average Pc values of <0.95 from multiple independent predictions are filtered out to obtain the predicted results. It is found that nine lncRNAs are interacted with at least two miRNAs in these results. Therefore, 26 samples which contain these 9 lncRNAs are selected as the candidates for biological identification (Fig. 6).
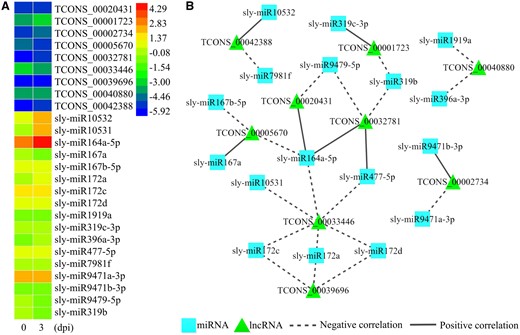
Biological identification of predicted results. (A) Heat map of the expression levels of miRNAs and lncRNAs from the candidates. (B) Interaction network of miRNAs and lncRNAs from the candidates, the dotted line indicates a negative correlation between the expression levels of miRNA and lncRNA, the solid line indicates the opposite
The expression levels of miRNA and lncRNA of 19 candidates are negatively correlated, accounting for 73% of all candidates. For example, the expression levels of TCONS_00033446 and sly-miR172a are falling and rising, respectively. Another case is that, the expression level of a lncRNA is affected by more than one miRNA simultaneously, it could not determine whether there is an interaction between miRNA and lncRNA even if their expression levels are positively correlated (Jiang et al., 2018). For example, the expression level of TCONS_00005670 is affected by sly-miR167b-5p to make it falling, which is positively correlated with the expression level of sly-miR167a, but the correlation between TCONS_00005670 and sly-miR167a in the case of removing sly-miR167b-5p is uncertain. Thus it needs to further identify the other seven candidates whose expression levels of miRNA and lncRNA are positively correlated. sly-miR172a–TCONS_00033446 interaction is selected from the above results and its Pc values during the prediction are recorded in Supplementary File S4. Three of 30 Pc values from PmliPred are provided by RF, which ensures that this interaction is not filtered out from multiple independent predictions. These results further verify the effect of the proposed hybrid method.
A total of 19 new miRNA–lncRNA interactions in S.lycopersicum are successfully identified from the predicted results obtained by PmliPred. It indicates that PmliPred is feasible to provide credible results as the references for biological identification.
4 Conclusions
This article proposed a new method based on hybrid model and fuzzy decision, PmliPred, that was applied to plant miRNA–lncRNA interactions prediction. It hybridizes CNN-BiGRU and RF, utilizes raw sequences and manually extracted features. PmliPred obtains better performance and generalization ability compared with existing methods. By the biological experiments, several new miRNA–lncRNA interactions in S.lycopersicum are successfully identified from the candidates predicted by PmliPred, which further verifies its effectiveness.
Given that there are currently few specialized plant miRNA–lncRNA interaction predictors have been published, PmliPred is quite an efficient method. In addition, there is currently no public plant miRNA–lncRNA interaction database available, which is sharp contrast with miRNA and lncRNA. The predicted results of PmliPred may lay the foundation for the construction of the database in future. PmliPred may also provide valuable references for other related studies.
Funding
This work was supported by the National Natural Science Foundation of China [61872055 and 31872116].
Conflict of Interest: none declared.
References

