


Abstract
Epistasis may play an etiologic role in complex diseases, but research has been hindered because identification of interactions among sets of single nucleotide polymorphisms (SNPs) requires exploration of immense search spaces. Current approaches using nuclear families accommodate at most several hundred candidate SNPs.
GADGETS detects epistatic SNP-sets by applying a genetic algorithm to case-parent or case-sibling data. To allow for multiple epistatic sets, island subpopulations of SNP-sets evolve separately under selection for evident joint relevance to disease risk. The software evaluates the identified SNP-sets via permutation testing and provides graphical visualization. GADGETS correctly identified epistatic SNP-sets in realistically simulated case-parent triads with 10 000 candidate SNPs, far more SNPs than competitors can handle, and it outperformed competitors in simulations with many fewer SNPs. Applying GADGETS to family-based oral-clefting data from dbGaP identified SNP-sets with possible epistatic effects on risk.
GADGETS is part of the epistasisGA package at https://github.com/mnodzenski/epistasisGA.
Supplementary data are available at Bioinformatics online.
1 Introduction
Substantial missing heritability remains for many complex diseases. Genome-wide association studies (GWAS) have identified many susceptibility alleles, but typically with small relative risks. Most analyses have focused on individual single nucleotide polymorphisms (SNPs) while overlooking the potential role of epistasis, in part, because of methodologic limitations. Because biologic systems often involve failure-resistant redundancy, deleterious traits may require joint effects of several SNPs whose marginal signals are weak (Shi and Weinberg, 2011). Our goal was to develop methods to identify sets of SNPs that jointly increase risk of a dichotomous disease outcome.
The search space can be huge for detecting epistatic effects. While genome-wide exhaustive search methods exist for pairwise interactions (Purcell et al., 2007), run times quickly become prohibitive for higher-order interactions. For example, even for a set of 10 000 candidate SNPs, there are 49 995 000 two-SNP sets but 416 416 712 497 500 four-SNP sets. As a consequence, methods for detecting higher-order interactions must constrict the search space. Some approaches, like Multifactor Dimension Reduction (MDR; Ritchie et al., 2001), exhaustively search all possible interactions in a small set of candidate SNPs, but one must restrict the number of candidate SNPs using external criteria. Others, like SNPHarvester (Yang et al., 2009) search for interactions among SNPs that first passed a filter based on statistical associations. Still others, like BEAM (Zhang and Liu, 2007), use Markov Chain Monte Carlo search techniques to explore the sample space. More recently, other stochastic search algorithms like ant colony optimization (Jing and Shen, 2015; Wang et al., 2010) and heuristic search algorithms (Aflakparast et al., 2014) have been used.
Another limitation of existing methods is that few are applicable to family studies. Family studies typically genotype an affected child and either both parents (case-parent triad) or an unaffected sibling (affected/unaffected sib-pairs). Such studies resist bias due to population stratification and can allow assessment of maternally mediated genetic effects and imprinting effects, but they may require more genotyping than a case–control study. MDR-PDT (Martin et al., 2006) extends MDR to case-parent triad or affected/unaffected sib-pair studies, and further extensions have been developed (Cattaert et al., 2010; Chen et al., 2014; Fang and Chiu, 2012; Liu et al., 2019; Lou et al., 2008). All of these search exhaustively, limiting the number of candidate SNPs that they can process. Trio logic regression (Li et al., 2010) and its extension TrioFS (Schwender et al., 2011) can also search for epistatic interactions using case-parent triads but permit a maximum of 500 candidate SNPs. GCORE is applicable genome-wide (Sung et al., 2016) but only considers pairwise interactions. EPISFA-LD (Xiang et al., 2020) does not require an exhaustive search and can detect higher-order interactions, but how successfully it scales up beyond 200 candidate SNPs has not been demonstrated.
Here, we propose GADGETS (Genetic Algorithm for Detecting Genetic Epistasis using Triads or Siblings) to detect higher-order interactions in family studies. For a specified SNP-set size, the algorithm stochastically searches for SNP-sets that may jointly be associated with disease, and nominates multiple sets. After running the algorithm allowing for a range of set sizes, we use permutations to test whether the algorithm overall provides evidence of association with risk. For an identified SNP-set, we propose a further method to probe whether those SNPs have a joint effect that is super-multiplicative. We also propose graphical methods for visualizing epistatic sets of SNPs nominated as risk-related by GADGETS.
This paper is organized as follows. We first describe GADGETS and our proposed permutation tests. We illustrate our algorithm’s performance using realistically simulated data for 10 000 SNPs where risk depends on more than one epistatic set. Then we compare our proposal to MDR-PDT, TrioFS and EPISFA-LD after restricting to a smaller number of candidate SNPs to accommodate their limitations. Finally, we apply our method to candidate SNPs from a GWAS of cleft lip (Beaty et al., 2010; Li et al., 2015) to explore epistatic effects.
2 Materials and methods
2.1 Algorithm for identifying sets of single nucleotide polymorphisms
We code the genotypes for a diallelic autosomal SNP as 0, 1 or 2, counting copies of the minor allele. We genotype either affected/unaffected sib-pairs, or unrelated cases and their parents. When parents are used, each case is paired with a ‘complement’, a hypothetical pseudo-sibling who inherited the parental alleles not transmitted to the case. We use ‘control’ generically to mean either the complement or the unaffected sibling.
To identify risk-associated SNP-sets, GADGETS employs a stochastic search algorithm, known as a genetic algorithm, that mimics biological evolution through natural selection (Holland, 1975). Specifically, GADGETS (i) initializes a fixed-size population of chromosomes, each a set of SNPs, by randomly sampling without replacement from all available SNPs; (ii) calculates a ‘fitness score’ for each chromosome that measures its association with case status and influences its chance of passage to the next generation; (iii) passes that fixed-size population of chromosomes through multiple generations where stochastic processes of mutation, crossover and preferential selection for higher fitness increasingly enrich the population for risk-related (fittest) chromosomes (Fig. 1).
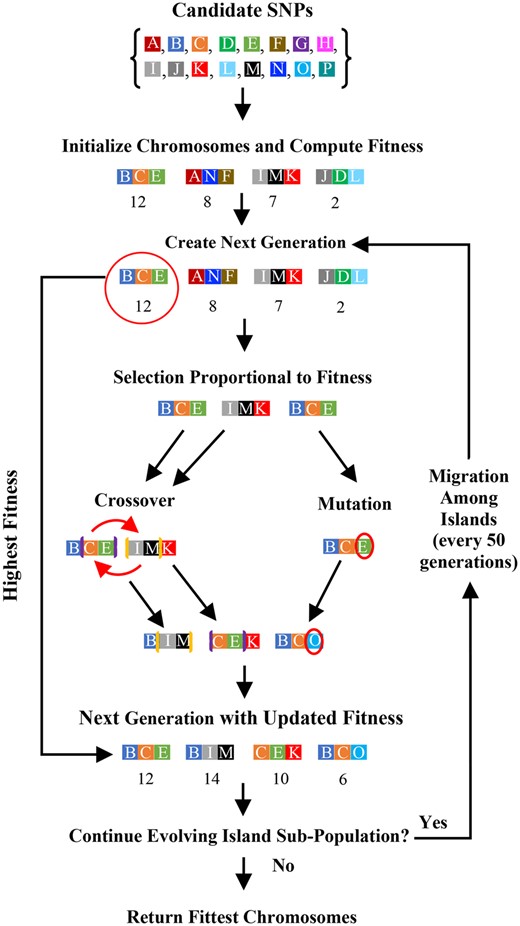
Flowchart of the GADGETS algorithm for a single island. In this simple illustration, we include four chromosomes of size d = 3. The text describes chromosome migration among islands
2.1.1 Initialization
For a specified number () of SNPs per chromosome, the algorithm randomly and without replacement draws an initial population of 200 chromosomes from the SNPs being considered. We consider d from 2 to 6.
2.1.2 Fitness score
We designed a chromosome’s fitness score () based on three objectives. First, the score should be high if those SNPs were jointly transmitted to cases much more frequently than to their paired controls. Second, the computation cannot be burdensome. Third, we would ideally be able to determine which component SNPs contribute most to its fitness score, so we could favor propagation of those SNPs.
We base our fitness score on paired case–control genotype difference vectors. For a given chromosome, let and be vectors with elements, each element containing minor allele counts for the ith case and control, respectively, and let . That is, the elements of correspond to the difference in minor allele counts between cases and controls. If a chromosome’s SNPs exhibit multi-SNP effects, these difference vectors should be consistently different from the zero-vector and preferentially point in a particular direction across families. To assess how well a given chromosome meets these expectations, we upweight families based on the number of nonzero genotype differences and compute a weighted mean difference vector, . The fitness score compares that to the zero-vector using a quadratic form similar to a paired Hotelling’s statistic (Supplementary Appendix A).
This fitness score satisfies all three aims. Let be the element of corresponding to SNP , and let be the square root of the diagonal element of the estimated weighted covariance matrix. We reasoned that, among a chromosome’s SNPs, those with larger values of show stronger association with disease. We use these measures at the mutation and crossover steps to prioritize selection of promising SNP subsets for propagation into subsequent generations (Supplementary Appendix B). Additionally, a positive (negative) sign of nominates the minor (major) allele as enhancing disease risk in that chromosome; the allele’s mode of inheritance is provisionally assigned as recessive or not using a data-driven approach (Supplementary Appendix A).
2.1.3 Passage to next generation
One copy of the chromosome with the highest fitness score passes to the next generation intact, guaranteeing a nondecreasing maximum fitness score over generations. The remaining 199 chromosomes for the next generation are created by sampling chromosomes from the current generation [including the top scorer(s)], with replacement and with probabilities proportional to their fitness scores. A random 80% of these are randomly paired with another chromosome and subjected to crossover. The remaining chromosomes are mutated. In crossover, a nonempty proper subset of a chromosome’s SNPs is exchanged with an equally sized subset in another. For a given pair of chromosomes assigned to crossover, elements of the lower-scoring chromosome with larger are preferentially exchanged with the elements having smaller in the higher-scoring chromosome (Supplementary Appendix B).
For each chromosome to be mutated, a random number of SNPs with the smallest are exchanged with SNPs from the input candidate pool (Supplementary Appendix B). Selection of SNPs from the candidate pool to be inserted as mutations is random with selection probability proportional to the statistic from a likelihood ratio test of its marginal disease association (Cordell and Clayton, 2002) but could alternatively be a preset probability based on prior information. For both mutation and crossover, no single chromosome can contain redundant SNPs; but any generation after the first can contain multiple copies of the same chromosome. On completion of the new generation, fitness scores are calculated for the new chromosomes and the process repeats.
To enlarge the effective range of the stochastic search, the algorithm creates independently evolving subpopulations of chromosomes, referred to as islands (Andre and Koza, 1996); we randomly partition islands into disjoint clusters of four. Within a cluster, island subpopulations evolve independently except for periodic interisland migration, and distinct island clusters evolve entirely independently from one another (Supplementary Appendix C). Evolution of an island subpopulation continues over generations until stopping criteria related to stable top-scoring chromosomes are satisfied or a prespecified number of generations is reached. We harvest each island’s fittest chromosome from the final generation for later analysis (Appendix C). We run GADGETS repeatedly on the same input data over a range of d, typically 2 through 6, harvesting a top list for each d.
2.2 Permutation-based inference
We consider two kinds of questions: (i) Taking all chromosome sizes 2–6 together, can we reject a global no-effect null? (ii) Does epistasis contribute to a specific SNP-set’s association with risk?
2.2.1 Global tests integrating evidence across single-nucleotide-polymorphism-set sizes
To create an outcome-permuted dataset, we randomize the case and control labels in each family. We create outcome-permuted datasets and run GADGETS on each. Calculating a test statistic for each permuted dataset based on its harvested fitness scores provides a null reference distribution.
To construct a test of the omnibus null that no SNPs are associated, either marginally or epistatically, with risk, first consider tests using SNP sets of size . For each separately, and each dataset, we sum the fitness scores of the highest scoring distinct chromosomes. (If, for the observed data or any permute, GADGETS identifies fewer than distinct chromosomes for a particular letting denote the minimum number of distinct chromosomes in any of the lists, we instead sum the scores for each list for that d.) We then rank the sums among the observed and permuted datasets, assigning rank 1 to the smallest. Let denote the rank for dataset , where denotes the observed data.We compute for every dataset. The p-value of the test is p = (Phipson and Smyth, 2010). In practice, we used = 101 and = 10. We caution readers that if candidate SNPs are chosen based on marginal association with disease, the null hypothesis is false a priori.
2.2.2 Quantifying evidence for epistasis for a candidate single nucleotide polymorphism set
Because high fitness of some chromosomes may be attributable to marginal rather than synergistic effects, we developed a permutation-based assessment of epistasis. It uses data only from families that are informative (Supplementary Appendix A) for the specified chromosome and requires at least two component SNPs not in linkage. We consider SNPs on the same biological chromosome to be in linkage, but other definitions could be used. Whereas our global test for association permutes case/control labels while retaining family identity, this measure retains case/control identity while independently permuting family labels.
First, suppose no two SNPs in the chromosome are in linkage. We exploit that independence by preserving the paired case/control genotypes and randomly reassembling those paired single-SNP genotypes into pseudo-family chromosomes to form a permuted dataset in which individual SNP transmission distortions are preserved but epistatic associations are disrupted (Supplementary Appendix D). Assuming only multiplicative marginal effects with no epistasis, these pseudo-family genotypes are as likely as the observed genotypes to occur (Piegorsch et al., 1994). For each permuted dataset, we calculate the fitness score for the chromosome. This permutation process generates a null reference distribution of fitness scores, thereby allowing a calculation of a permutation-based epistasis ‘p-value’ in the same way as the global test. We used 10,000 permutations.
If one or more pairs of SNPs in a chromosome are in linkage, we proceed similarly except that we treat linked loci as a unit. If all SNP pairs in a chromosome are in linkage, however, other methods are needed. When this assessment of epistasis is carried out on SNP-sets identified through GADGETS, caution is needed because the stochastic search may have selected sets that appear to be interacting, even under a multiplicative-effects null. We regard these epistasis ‘p-values’ as primarily useful for constructing network plots, to be described. To test epistasis with full control of the type I error rate, one would need to use independent validation data. To avoid misleading interpretations of these ‘p-values’ not computed using independent data, we instead refer to them as ‘h-values’.
2.3 Clustering single nucleotide polymorphisms as risk-related: a graphical approach
We restrict attention to top-scoring chromosomes. If we have permuted datasets under the global null, we use chromosomes with fitness scores exceeding the 95th percentile of the maximal scores from the permuted datasets for each . Otherwise, we use the 10 top-scoring distinct chromosomes of size , or all distinct chromosomes if GADGETS nominates fewer than 10. For each chromosome surviving that filter, we compute an epistasis h-value. If all SNPs are linked and the h-value cannot be computed, we set h = 0.5. We remove chromosomes whose h-value exceeds a specified threshold, defaulting to 0.05. We then identify all distinct SNPs and SNP-pairs that appear within the remaining chromosomes and assign two graphics scores. We assign a pair-specific graphics score to SNP-pair that reflects evidence for epistasis across as , where represents the number of chromosomes of size containing pair . Analogously, we assign a SNP-specific graphics score to SNP : , where represents the number of chromosomes of size containing SNP .
To improve the legibility of network graphs, we plotted the SNPs and connectors included in the top 25% of those highest scoring SNP-pairs. The thickness of the SNP-to-SNP connectors is proportional to and the area of the node circle (identifying an SNP) is proportional to .
2.4 Simulations
We used a simulation method that creates realistic simulated data using actual GWAS data from case-parent triads, approximating the linkage disequilibrium (LD) structure in the genome. It effectively clears away any signal present in the original data by scrambling the transmitted and untransmitted genomes. We seed in one or more sets of risk-related SNPs (Shi et al., 2018). GADGETS simulations were based on oral-cleft case-parent triads downloaded from dbGaP (Beaty et al., 2010). To construct input data, we first conducted modest LD pruning to ensure that no two SNPs in the input data had pairwise R2 > 0.8. From those remaining, we randomly selected 2500 SNPs from each of four chromosomes (chromosomes 10, 11, 12 and 13). Each simulated dataset contained 1000 case-parent triads.
We simulated five datasets under each of four risk scenarios and four datasets under a fifth scenario; each scenario involved more than one risk-associated SNP-set (Supplementary Tables S1 and S2). The risk SNPs were located roughly evenly across the 10 000 SNPs. Due to computational demands, we carried out permutation testing of the global null hypothesis for only one randomly selected simulated dataset from each scenario.
2.5 Comparison to competing methods
We compared our proposed method with three existing methods designed for family analysis: TrioFS, MDR-PDT and EPISFA-LD (Supplementary Appendix E). For these comparisons, we used simulated data from simplified versions of scenario 2 with only the three-SNP risk set and scenario 5 with only the first four-SNP risk set. To accommodate restrictions in the competing methods’ capabilities, we used 25, 100 and 500 candidate SNPs. Other than the simulated risk set, SNPs were randomly and independently chosen from the 10,000 for each candidate set size. We report the maximal number of risk-set SNPs nominated by each method in a single model among its 10 highest-ranking models. When GADGETS identified fewer than 10 distinct top chromosomes, we report the maximal number of risk-set SNPs among the selected chromosomes. EPISFA-LD does not rank-order the sets it identifies, so we report the maximal number of risk-set SNPs returned among any of its output models and, for k > 1 models, we assign the rank as ‘top k’.
3 Results
3.1 Risk-associated sets of single nucleotide polymorphisms identified via GADGETS
Though designed to aggregate information across chromosome sizes, GADGETS also performed well at the true risk-related SNP-set size (Supplementary Tables S3–S7). The highest scoring chromosome matched one of the multi-SNP risk sets in 18 of 29 simulations across scenarios and replicates (counting d = 3 and d = 5 separately for scenario 2, and only counting d = 4 for scenario 3) and three of the four risk-set SNPs for four simulations. In 4 of 19 simulations with two multi-SNP risk sets of equal size, GADGETS identified both as the top two chromosomes.
3.2 Risk-associated sets of single nucleotide polymorphisms identified from network graphs
Integrating results across chromosome sizes, our network plots typically identified at least one of the risk-associated SNP-sets in each scenario (Fig. 2 and Supplementary Figs S1–S23). Visualization performance was particularly strong when using global permutations to filter chromosomes that contributed to the plots (Fig. 2 and Supplementary Figs S1–S4). Among five scenarios, four network plots contained all complete multi-SNP risk-related sets, and the remaining plot contained one complete risk set and three of the four SNPs in the second. Even without global permutations, however, visualization performance was good. Over 19 simulations (Supplementary Figs S5–S23), 16 plots contained at least one complete multi-SNP risk-related set and 18 contained at least one risk-related SNP. Of 15 simulations with two multi-SNP risk-related sets, five plots contained both sets and three contained one set and three of four SNPs in the second.
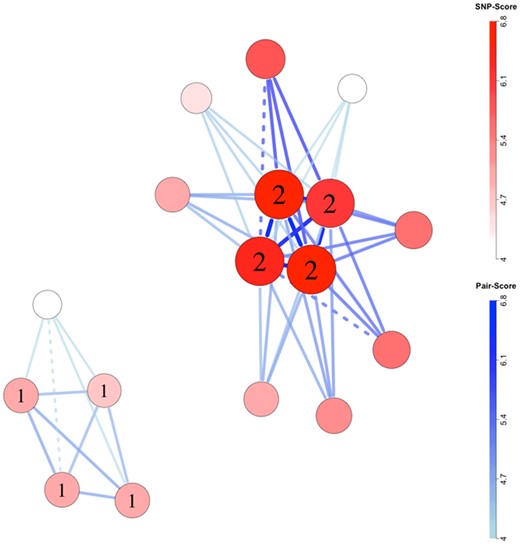
Network plot for scenario 1, replicate 2. Chromosomes were filtered for inclusion using global permutations. SNP labels ‘1’ and ‘2’ indicate membership in epistatic risk sets 1 and 2, respectively. Larger, darker nodes and thicker, darker edges correspond to larger SNP and SNP-pair scores, respectively. Dashed connections indicate pairs of SNPs located on the same biological chromosome with pairwise R2 of at least 0.1 in complement pseudo-siblings
3.3 Permutation inference
The global test declared the presence of risk-associated SNP-sets for all five scenarios/datasets, regardless of the number of highest-ranking chromosomes used in the calculation (Supplementary Table S8). Chromosomes identified by GADGETS as having the highest-ranking fitness score also showed strong epistasis (Supplementary Table S9), although one was a spurious finding, having no risk-related SNPs.
3.4 Run times
Running GADGETS on an input dataset of 10 000 SNPs and 1000 families is computer intensive. On a computing cluster allowing up to 135 simultaneous single core (NVIDIA V100 Tensor Core GPU, 16G—32G memory) jobs per user, running GADGETS over all chromosome sizes typically took around 15 min. For smaller datasets, precise timings for single core jobs, not incorporating the distributed-computing capability of GADGETS, are reported in Table 1. The epistasis test required seconds to complete.
Comparison of GADGETS to competitors in finding simulated three-SNP and four-SNP risk sets over a range of input SNP numbers
| Replicate Input SNPs | GADGETS | MDR-PDT | TrioFS | EPISFA-LD | |||||
|---|---|---|---|---|---|---|---|---|---|
| Max risk SNPs founda (Rankb) | Run time | Max risk SNPs founda (Rankb) | Run time | Max risk SNPs founda (Rankb) | Run time | Max risk SNPs foundc (Rankc) | Run time | ||
| Scenario 2 | |||||||||
| 1 | 25 | 3(1) | 00:01:27 | 2(1) | 00:00:05 | 3(1) | 00:51:57 | 3(1) | 00:00:45 |
| 100 | 3(1) | 00:01:28 | 0 | 00:04:30 | 2(1) | 00:51:30 | 3(1) | 00:04:24 | |
| 500 | 3(1) | 00:07:17 | 0 | 10:10:36 | 0 | 04:21:09 | ** | ** | |
| 2 | 25 | 3(1) | 00:01:23 | 2(4) | 00:00:05 | 2(1) | 00:49:39 | 3(1) | 00:00:38 |
| 100 | 3(1) | 00:01:31 | 0 | 00:04:39 | 2(1) | 00:52:20 | 3(1) | 00:01:59 | |
| 500 | 3(1) | 00:07:39 | 0 | 10:05:11 | 0 | 05:08:08 | ** | ** | |
| 3 | 25 | 3(1) | 00:01:31 | 2(1) | 00:00:05 | 2(1) | 00:50:41 | 3(1) | 00:00:47 |
| 100 | 3(1) | 00:01:34 | 0 | 00:05:03 | 2(1) | 01:01:15 | ** | ** | |
| 500 | 3(1) | 00:07:59 | 0 | 09:54:09 | 0 | 05:08:00 | ** | ** | |
| 4 | 25 | 3(1) | 00:01:36 | 2(3) | 00:00:05 | 3(1) | 00:51:02 | 3(1) | 00:00:41 |
| 100 | 3(1) | 00:01:46 | 0 | 00:05:08 | 3(1) | 01:00:43 | 3(1) | 00:03:35 | |
| 500 | 3(1) | 00:08:16 | 0 | 10:15:04 | 0 | 05:08:30 | ** | ** | |
| 5 | 25 | 3(1) | 00:01:24 | 2(10) | 00:00:05 | 3(1) | 00:52:22 | 3(1) | 00:00:43 |
| 100 | 3(1) | 00:01:27 | 0 | 00:04:29 | 3(3) | 01:16:02 | 3(1) | 00:03:05 | |
| 500 | 3(1) | 00:08:26 | 0 | 10:09:43 | 0 | 05:49:41 | ** | ** | |
| Scenario 5 | |||||||||
| 1 | 25 | 4(1) | 00:06:22 | 2(1) | 00:00:42 | ** | ** | 3(Top 2) | 00:02:18 |
| 100 | 4(1) | 00:06:41 | 1(6) | 05:22:33 | 2(1) | 03:37:32 | 3(Top 2) | 00:03:46 | |
| 500 | 3(1) | 01:10:29 | ** | ** | 0 | 15:28:29 | ** | ** | |
| 2 | 25 | 4(1) | 00:07:55 | 2(1) | 00:01:15 | 3(1) | 02:48:52 | 3(1) | 00:00:49 |
| 100 | 4(1) | 00:06:03 | 1(3) | 05:20:51 | 4(2) | 03:38:17 | 3(1) | 00:03:48 | |
| 500 | 3(1) | 00:47:38 | ** | ** | 0 | 15:14:56 | ** | ** | |
| 3 | 25 | 4(1) | 00:05:52 | 2(6) | 00:00:39 | 4(2) | 02:26:17 | 4(1) | 00:00:37 |
| 100 | 3(1) | 00:06:12 | 1(1) | 04:55:31 | 3(3) | 03:39:14 | 4(1) | 00:02:52 | |
| 500 | 3(1) | 00:46:16 | ** | ** | 0 | 12:32:09 | ** | ** | |
| 4 | 25 | 4(1) | 00:07:03 | 2(6) | 00:00:55 | 4(1) | 02:56:46 | 4(Top 2) | 00:01:09 |
| 100 | 4(1) | 00:07:21 | 1(1) | 04:55:50 | 3(3) | 02:35:18 | 3(1) | 00:04:42 | |
| 500 | 4(1) | 00:41:00 | ** | ** | 0 | 14:23:52 | ** | ** | |
Note: Due to limitations in the number of SNPs that competitors could analyze with reasonable run times, we reduced the number of SNPs input to the procedures to at most 500. Run times are hours:minutes:seconds.
Maximum number of SNPs in the risk set contained in any single chromosome/model among the top 10 highest-ranking chromosomes/models.
Indicates TrioFS or EPISFA-LD failed to output results or MDR-PDT could not be run due to projected run times exceeding one month.
Rank of the chromosome/model (1 = highest) among the top 10 that contained the most SNPs from the risk set. Ranks are not specified when zero risk-set SNPs were found.
Maximum number of SNPs in the risk set among any output model. A rank of ‘Top 2’ indicates EPISFA-LD output two unordered models.
3.5 Comparison of GADGETS to competitors
When compared with MDR-PDT, TrioFS and EPISFA-LD, GADGETS typically outperformed them by more completely identifying risk-related sets and by running substantially faster (Table 1). For 500 candidate SNPs, GADGETS always identified all three risk-related SNPs for scenario 2 and identified at least three of four risk-related SNPs for scenario 5. No other method could identify even a single risk-related SNP among 500 candidates. MDR-PDT was stopped for scenario 5 due to projected run times exceeding one month, and EPISFA-LD did not run with 500 candidate SNPs for any replicate of either scenario.
For 100 candidate SNPs, GADGETS either ran faster or more completely identified risk-related SNPs than competitors for every scenario except for scenario 5, replicate 3. For 25 candidate SNPs, MDR-PDT and EPISFA-LD ran faster than GADGETS, but MDR-PDT failed to completely identify risk sets. Both TrioFS and EPISFA-LD occasionally failed to output results, even with fewer than 500 input SNPs.
3.6 Application to oral-cleft data
Cleft lip (with or without cleft palate) (CL/P) is a strong candidate for multi-SNP effects. Based on substantial recurrence risk within families (Sivertsen et al., 2008), clefting is largely genetic; yet one would expect strong genetic selection against any individual risk allele because of high neonatal mortality before modern surgical repairs. We used GADGETS to reanalyze candidate SNPs curated by Li et al. (2015) from a GWAS of CL/P (Beaty et al., 2010). Because etiology may differ among ethnic groups (Beaty et al., 2010), we analyzed Asian and European families separately. In the Asian data, we analyzed 347 SNPs from 889 families. In Europeans, we analyzed 395 SNPs across 668 families. Candidate SNPs were chosen based on marginal associations with CL/P or from genes in the WNT signaling pathway (Li et al., 2015).
Global test p-values were low for both ancestry groups, which would in part reflect selection of SNPs based on marginal effects. Network plots suggested possibly epistatic SNP-sets in the Asian (Fig. 3 and Supplementary Tables S10–S14) and European ancestry groups (Fig. 4 and Supplementary Tables S15–S19), with some overlap. For both, the ABCA4 region (rs952499, rs560426) exhibited a strong signal. In Asians, the top-scoring five-SNP set (rs952499, rs2013162, rs12506428, rs9788972, rs6102085; risk alleles: TCCAG, none recessive) appeared prominently in the network, and epistasis permutations suggested that epistasis within the set contributes to the etiology of CL/P (h = 0.0004; joint relative risk = 3.2; Supplementary Table S13). In Europeans, the second ranked four-SNP set (rs560426, rs4254782, rs987525, rs8069536; risk alleles: GAAT, none recessive) was prominent in the network plot and showed evidence of epistasis (h = 0.0009; joint relative risk = 4.7; Supplementary Table S17). Comparable evidence for epistasis among SNPs in the ABCA4 and NTN1 regions was also seen in three of the five top-scoring six-SNP sets in Asians (Supplementary Table S14). Recapitulating findings from Li et al. (2015), markers from IRF6 appeared in several potentially epistatic sets in Asians, and markers from the 8q24 region appeared to be epistatic in Europeans.
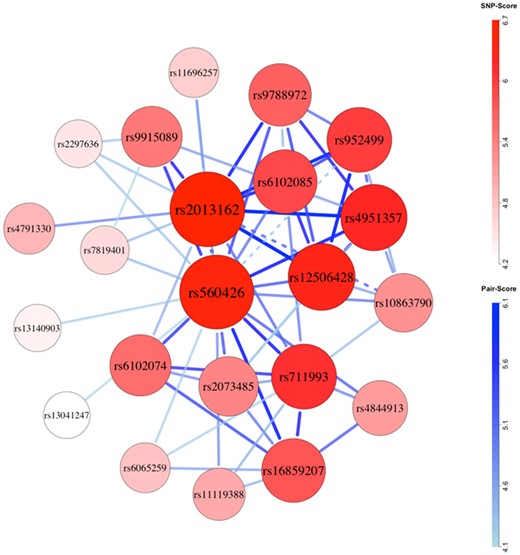
Network plot for Asian (cleft lip with or without cleft palate) case-parent triad data. Chromosomes were filtered for inclusion using global permutations. Larger, darker nodes and thicker, darker edges correspond to larger SNP and SNP-pair scores. Dashed connections indicate pairs of SNPs located on the same biological chromosome with pairwise R2 of at least 0.1 in complement pseudo-siblings
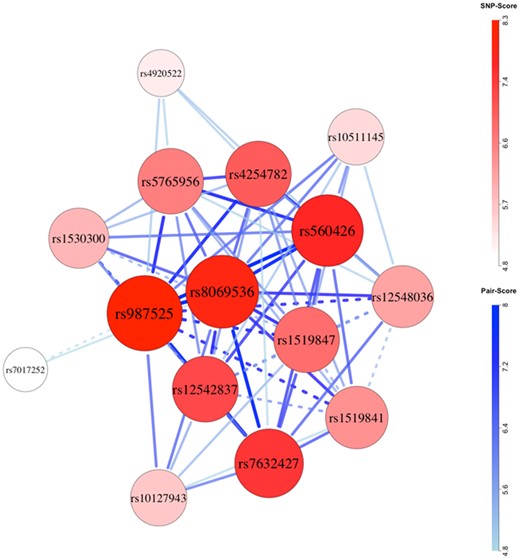
Network plot for European (cleft lip with or without cleft palate) case-parent triad data. Chromosomes were filtered for inclusion using global permutations. Larger, darker nodes and thicker, darker edges correspond to larger SNP and SNP-pair scores. Dashed connections indicate pairs of SNPs located on the same biological chromosome with pairwise R2 of at least 0.1 in complement pseudo-siblings
4 Discussion
We showed through simulations that, despite a search space exceeding 1021 (implied by searching SNP-sets of size 2 through 6 with 10 000 SNPs), GADGETS could correctly identify multiple jointly acting SNP-sets even when attributable fractions were small. Further work is needed to determine how well GADGETS scales up beyond 10 000 SNPs, but it outperformed the existing family methods while accommodating substantially more candidate SNPs.
In assessing epistasis using nuclear families, we were looking for sets of SNPs that were jointly transmitted to affected offspring more frequently than expected based on their parents. We needed a ‘fitness’ measure that could quantify that excess transmission. Our measure is an informativeness-weighted version of the paired Hotelling’s T2 statistic, based on comparing multi-SNP genotypes in cases versus their sibling (or pseudo-sibling). The genetic algorithm then enables one to sift through a very large number of possible combinations by imitating biological evolution through natural selection.
For our simulations, we started with a collection of up to 10 000 candidate SNPs based on chromosomes 10 through 13 after some filtering for LD. (In practice, candidates would be chosen genome-wide based on biology or marginal association and LD filters are not necessary.) We then randomly sample a fixed number of SNP-sets of fixed size, and let that ‘population’ evolve by selecting the fittest combinations across successive generations. Diversity is enhanced by allowing mutation and an analog of crossover in each generation. Because there could be more than one set of SNPs with interacting effects, parallel evolutions take place in many separate ‘island’ populations to allow distinct epistatic sets to emerge.
Oral cleft is a particularly good candidate for epistasis because, while familial recurrence risk is high (Sivertsen et al., 2008), historically the phenotype must have implied high infant mortality and any single-SNP effect should have been strongly selected against. When we reanalyzed an oral-clefting dataset using candidate SNPs (Li et al., 2015), we identified potentially novel epistatic sets in Asians and Europeans. These results support epistasis in the etiology of clefting and suggest particular SNP-sets that warrant further investigation.
The selection of candidate SNPs for applications of GADGETS can exploit the fact that epistatic effects typically induce small marginal individual SNP associations for the SNPs that participate. However, in our simulations, we directly simulated candidate SNPs without conducting selection. GADGETS can build toward the higher-order epistatic sets through mutation and crossover because subsets of risk-related SNP-sets will also show lower-order epistatic associations and chromosomes containing those subsets will preferentially propagate.
GADGETS requires a number of tuning parameters, family weights being the most consequential. Aggressively upweighting families where SNPs in an SNP-set are jointly differentially transmitted prioritizes identification of SNP-sets whose components act jointly rather than only through their individual marginal effects, and does so in a computationally efficient way. As evidenced by simulation results, GADGETS’ default weights work well across a diverse set of risk scenarios. An automated method for selecting family weights (and other tuning parameters) may ultimately be achievable, but must be weighed against increases in run time.
The performance of GADGETS is also impacted by marginal associations of candidate SNPs with disease. In particular, SNPs with larger marginal effects are more frequently considered due to higher mutation sampling probabilities and thus are more readily incorporated into top-scoring chromosomes. In our simulations, risk-related SNPs generally had a mix of large and small marginal effects (Supplementary Table S2). We feel these scenarios are realistic examples of how epistatic SNPs might function.
The extent to which singleton risk-related SNPs obscure jointly risk-related SNP-sets from GADGETS is not completely clear. In simulation three, GADGETS found the multi-SNP set in three of five replicates despite the presence of singleton risk-related SNPs (Supplementary Table S5). We did not, however, examine scenarios with dozens or hundreds of singletons, as might be possible for complex traits. Although the global p-value reflects both marginal and epistatic effects, GADGETS more often nominated epistatic SNP-sets than those with only marginal effects on risk; we believe a low global p-value may signal epistatic effects rather than those due only to marginal effects.
GADGETS can be applied to case-parent triad data, to disease-discordant sibling pairs or a mix of the two. A mixed design may be easiest to implement, where, for each case, one genotypes parents when available but an unaffected sibling otherwise. Whether the two sorts of data should be weighted differently in GADGETS is an open question.
GADGETS does accommodate missing SNP genotypes. If any family member’s genotype is missing for a particular SNP, that family is considered uninformative for that SNP but still contributes information from their remaining nonmissing genotypes. At present, it does not accommodate genotypes imputed with uncertainty, sometimes known as dosages. For those SNPs, the most likely genotype could be used.
The extent to which undetected epistasis explains missing heritability for complex diseases remains to be explored. GADGETS should help to advance that work. We expect purely genetic synergisms to be most important for conditions like oral clefting, for which any single risk-related SNP variant would have been very strongly selected against. For other diseases, environmental factors and behavioral factors might interact with multi-SNP sets; that possibility will be a focus of future work.
Acknowledgements
The authors thank Dr Joan Bailey-Wilson, Dr Terri Beaty and Dr Qing Li for their list of candidate SNPs, and Dr Bailey-Wilson and Dr Shaina Alexandria for their helpful comments.
Funding
This work was supported by the Intramural Research Program of the National Institutes of Health, National Institute of Environmental Health Sciences, through Intramural Project Number ES040007.
Conflict of Interest: none declared.
Data availability
The code, simulated datasets and candidate SNPs used in this study are available from the corresponding author on request. The data used for the oral-clefting application are available at https://www.ncbi.nlm.nih.gov/projects/gap/cgi-bin/study.cgi?study_id=phs000094.v1.p1
References
Author notes
The authors wish it to be known that, in their opinion, Michael Nodzenski and Min Shi should be regarded as Joint First Authors.

