


Abstract
Thermal properties of proteins are of great importance for a number of theoretical and practical implications. Predicting the thermal stability of a protein is a difficult and still scarcely addressed task.
Here, we introduce Thermometer, a webserver to assess the thermal stability of a protein using structural information. Thermometer is implemented as a publicly available, user-friendly interface.
Our server can be found at the following link (all major browser supported): http://service.tartaglialab.com/new_submission/thermometer_file.
Supplementary data are available at Bioinformatics online.
1 Introduction
The thermal behavior of a protein is influenced by environmental factors such as the pH of the solution, presence of ions, excipients or cofactors and internal characteristics, such as the amino acids′ composition of the protein sequence and their disposition in the 3D structure (Kumar et al., 2000; Miotto et al., 2019). In particular, specific amino acids contribute to thermal stability (Vijayabaskar and Vishveshwara, 2010) and salt bridges in hyperthermostable proteins have stronger electrostatic interactions than their mesostable counterparts (Lee et al., 2014). Importantly, proteins from thermophilic organisms display a more interwired network of interactions with respect to mesophile counterparts (Miotto et al., 2020). A lower number of cavities and a higher average relative contact order have been observed when comparing thermostable proteins with mesostable paralogs and orthologs (Robinson-Rechavi and Godzik, 2005). Based on these observations, we previously proposed an innovative approach of representing proteins as energy-weighted graphs and comparing them using ensembles of random interaction networks (Miotto et al., 2019). Our parameter-free network descriptor allows us to distinguish thermostable and mesostable proteins with an accuracy of and area under the receiver operating characteristic curve of 78% (see Section 2).
2 Materials and methods
The Thermometer webserver assesses protein thermal stability from a given structure in PDB format. At its basis there are four steps: (i) each protein structure is represented as a residue interaction networks (RIN), where protein residues correspond to graph nodes while Coulombic and van der Waals energetic interactions between couples of nodes correspond to the network link weights; (ii) starting from the calculated RIN, an ensemble of randomized networks is built in which the nodes and architecture are preserved but each link weight is randomly sampled from an energy distribution typical of mesostable proteins. (iii) The Ts descriptor is defined as where and are the mean strengths (sum of all the weights of a node) over the protein nodes, for the real network and the random ensemble, respectively. is the square root of the strength variance over the random ensemble. Finally, (iv) a clustering analysis is performed considering for each protein the set of three global Ts descriptors obtained using total energy, Coulombic energy and Lennard–Jones interactions as network links. The clusters are discriminated by the Euclidean distance in the three-dimensional space of the Ts descriptors using the Ward method. The thermal properties of the given protein can thus be compared with those of a large dataset of proteins with known melting temperatures. The dataset has been manually collected starting from the most recent version of the proTherm database (Nikam et al., 2021) and imposing the same set of constraint used in Miotto et al. (2019) (pH range, known Tm, absence of ions, ligands, mutations, and/or missing residues, etc.). We obtained 15 additional protein structures to be added to the dataset proposed in Miotto et al. (2019). The ratio of found thermo/mesostable proteins is one over three, in accordance with literature. The complete dataset is reported in the Supporting Information.
As one can see from the cluster shown in Figure 1, we retrieve a good two-group separation (thermostable proteins are colored in red, while mesostable in blue) performing a clustering analysis on the 99 proteins of the assembled dataset using the three Ts descriptors. More in detail, the ‘mesostable’ cluster (prevalence of blue labels) is composed of 46 proteins, with 39 mesostable ones (85%). The ‘thermostable’ cluster is instead composed of 53 proteins, 33 of which are thermostable (62%). The overall performance is (the error is obtained assuming to swap two proteins between the clusters) in classifying 99 proteins with an area under the receiver operating characteristic curve of 0.78.
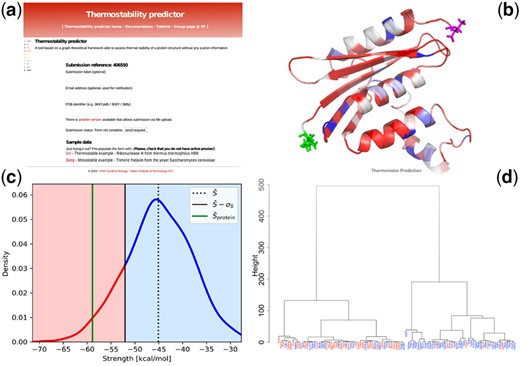
(a) Input page of the Thermometer webserver (running examples are provided therein); (b) ribbon and stick representation of the protein with residues colored according to the single residue score ; (c) the mean strength value of the whole protein is compared with a distribution generated using randomized networks; (d) clustering analysis of the novel Thermostable dataset composed of 99 proteins with known melting temperature. In the graphical representation, proteins with Tm higher (respectively lower) than 70°C are colored in red (respectively, blue)
3 Input and output description
3.1 Input
Following the link: http://service.tartaglialab.com/new_submission/thermometer_file, the user reaches the main page (Fig. 1a), where she/he can upload the PDB file of the protein of interest using the upload button. The size of the provided PDB structure must not exceed 500 residues, due to running time issues. As sample data, we provided one case of a thermostable protein (PDB id: 1ril) and one mesostable (PDB id: 3oeq). By clicking on the PDB id (in red), the example is loaded in the input boxes.
3.2 Output
The output of Thermometer consists of: (i) A ribbon and stick representation of the submitted protein is provided with residues colored according to the single residue score (Fig. 1b) from different orientations. The score ranges from blue to red as the descriptor increases. (ii) The distribution (displayed in Fig. 1c) of the random Strength scores, the black dotted line marks the value of the mean, while the black solid line indicates the mean less one standard deviation. The green line represents the mean strength value of the network for the case of interest, while the red and blue regions in the random strength distribution show the thermostable and mesostable propensity regions, respectively. (iii) A clustering, where proteins with melting temperature Tm higher (respectively, lower) than 70°C are colored in red (respectively, blue), while the submitted protein is marked in green (Fig. 1d). The thermal properties of the top 10 proteins of the original dataset, found closest to the submitted one in the ad hoc run, are also reported to help the user compare the melting temperatures between the submitted protein and the reference dataset.
For each protein, one can find the PDB code, its distance from the submitted protein, the melting temperature and the three normalized Ts scores used for the clustering. (iv) Finally, we reported the complete contact matrix of the RIN associate to the submitted protein in table format. All data and figures are also provided in a zip file, which can be downloaded.
4 Conclusion
The Thermometer web server is fast and for a 50-residue-long protein, results are available to the user in about 4 minutes, while for a protein of average size (250 resides) the waiting time is of nearly 20 minutes. Moreover, the webserver is user-friendly and can be run without any a priori knowledge on theoretical or computational biology. We believe Thermometer can contribute to better understanding thermal stability and we hope that it could be useful in a number of practical applications.
Acknowledgements
The authors acknowledge Andrea Vandelli, Alessio Colantoni and Claudia Giambartolomei for discussions.The data underlying this article are available in the article and in its online supplementary material.
Funding
The authors thank European Research Council [RIBOMYLOME 309545 and ASTRA 855923], the H2020 projects IASIS 727658 and INFORE 25080.
Conflict of Interest: none declared.

