


Abstract
Telomeres are the repetitive sequences found at the ends of eukaryotic chromosomes and are often thought of as a ‘biological clock,’ with their average length shortening during division in most cells. In addition to their association with senescence, abnormal telomere lengths are well known to be associated with multiple cancers, short telomere syndromes and as risk factors for a broad range of diseases. While a majority of methods for measuring telomere length will report average lengths across all chromosomes, it is known that aberrations in specific chromosome arms are biomarkers for certain diseases. Due to their repetitive nature, characterizing telomeres at this resolution is prohibitive for short read sequencing approaches, and is challenging still even with longer reads.
We present Telogator: a method for reporting chromosome-specific telomere length from long read sequencing data. We demonstrate Telogator’s sensitivity in detecting chromosome-specific telomere length in simulated data across a range of read lengths and error rates. Telogator is then applied to 10 germline samples, yielding a high correlation with short read methods in reporting average telomere length. In addition, we investigate common subtelomere rearrangements and identify the minimum read length required to anchor telomere/subtelomere boundaries in samples with these haplotypes.
Telogator is written in Python3 and is available at github.com/zstephens/telogator.
Supplementary data are available at Bioinformatics online.
1 Introduction
Telomeres are the repetitive regions capping the end of eukaryotic chromosomes that protect chromosomes from enzymatic degradation. Typically measured from leukocytes, telomere lengths (TLs) of young humans are 10–12 kb on average and shorten as cells divide (Riethman et al., 2004). Telomeres also play a regulatory role in the expression of genes located on their chromosome, a function that is also affected by their length (Lou et al., 2009; Pedram et al., 2006; Robin et al., 2014).
Telomerase activity and TL are known to be associated with tumor malignancy, and the relationship between shortened telomeres and cancer risk has been studied in lung (Jang et al., 2008), breast/ovary (Bojesen et al., 2013), colon (Druliner et al., 2016; Engelhardt et al., 1997) and others (Han et al., 2009; Ma et al., 2011; Zhu et al., 2016). In short telomere syndromes, aberrant TL is associated with premature aging disorders affecting cutaneous, musculoskeletal and cardiovascular systems, as well as the accelerated development of major geriatric disorders (Armanios, 2009; Barbaro et al., 2016; Mangaonkar and Patnaik, 2018; Schulz et al., 1996; Stables and Morley, 1994).
While many studies have observed correlations between TL and health or disease risk, the statistical power of these studies remains limited by the experimental methods available for measuring TL. A vast majority of studies use average TL values (across all chromosome arms) or shortest TL, which are suspected to be of limited diagnostic value. An increasing number of potential associations between disease and chromosome-specific TL have been reported: shortening of telomere 4p is linked to patients with rheumatoid arthritis (Blinova et al., 2016), whereas shortening of telomere 17p and 12q is associated to increased risk of esophageal cancer (Xing et al., 2009). Abnormal length of telomeres 8p, Xp, 21p and 21q are markers of chronic myeloid leukemia (Samassekou et al., 2009). Abnormal elongation and shortening of specific telomeres has also been observed in patients with bronchial asthma (Barkovskaya et al., 2019).
Currently, experimental methods for measuring the lengths of individual telomeres are either (i) limited in the number of chromosome arms they can characterize, (ii) limited in the resolution of reported lengths or (iii) complex and labor intensive. Summaries of experimental methods and their limitations have been recently reviewed in Lai et al. (2018); Lindrose et al. (2021) and Kahl et al. (2020). Emerging work using nanochannel array linearization of DNA alongside CRISPR-Cas9 labeling has demonstrated the ability link telomere sequences to subtelomeres at the haplotype level (Uppuluri et al., 2021; Young et al., 2017), though these assays are not yet broadly available and additional validation may be needed to characterize their limitations (e.g. high variance in TL estimates).
Sequencing-based methods are attractive due to their ubiquity in clinical labs, though software designed to characterize telomeres with this data are similarly limited. There are many methods for reporting average TL from short reads (Farmery et al., 2018; Feuerbach et al., 2019), though no reliable methods exist for reporting chromosome-specific TL. This is in part due to the poorly characterized chromosome ends in the hg38 human reference genome, where telomeres and subtelomeres (the ∼500 kb preceding the telomere repeats) are either missing entirely or not structurally representative of an average human’s sequence in these regions. Many subtelomeres are prohibitive to analyze with short reads due to their high frequency of repetitive sequences and structural variation (Riethman et al., 2004), a challenge which is exacerbated by the wide variety of subtelomere haplotypes across populations (Young et al., 2020).
Recent advancements in the throughput and affordability of long read sequencing has fueled interest in its application to analyzing telomeres and subtelomeres. The recently published human reference genome from the Telomere-to-Telomere (T2T) consortium leveraged long reads to significantly improve representations of many challenging genomic regions, including centromeres, subtelomeres and telomeres (Graham, 2021; Nurk et al., 2021). The T2T reference resolves about 150Mbp of unknown sequence, which includes subtelomeres with recent segmental duplications. The T2T reference also resolves erroneous sequences and replaces sequences that were previously procedurally generated (due to the challenges associated with directly sequencing them). Notably, the T2T reference provides, for the first time, a high-quality reference sequence for acrocentric chromosomes.
In recent work, long reads have been applied to telomere analysis in yeast (Sholes et al., 2021) and in human (Grigorev et al., 2021; Jain et al., 2018), showing promise in their ability to characterize telomere sequence and in many cases ‘anchor’ telomere sequence to a specific chromosome arm. Building on these methods, and leveraging the T2T reference genome, we present Telogator, a new method for measuring chromosome-specific TL from long reads. Telogator uses a combination of alignment, string matching and clustering strategies to identify subtelomere/telomere boundaries in noisy long reads, and without assumptions of where telomeres will be located. These features allow Telogator to be applied to samples with subtelomere structural variation, or samples sequenced using reads with high error rates, e.g. PacBio continuous long reads (CLR) or Oxford Nanopore reads. We demonstrate Telogator’s accuracy in identifying chromosome-specific TL from simulated samples and demonstrate its ability to handle real data by applying it to whole-genome CLR reads from 10 samples. We suspect that the ability to accurately measure chromosome-specific TL will enable higher-resolution studies to refine our understanding of the role of telomere dynamics in disease and improve clinical care.
Telogator is available at github.com/zstephens/telogator.
2 Materials and methods
Telogator’s overall strategy is to measure TL at each chromosome arm by finding reads with telomere sequences that can be aligned to that arm’s subtelomere. TL is then reported using reads mapped to the same subtelomere/telomere boundary on that arm (Fig. 1). Telogator is composed of four primary steps: (i) extracting reads from subtelomeres and telomeres, (ii) identifying candidate telomere sequences, (iii) clustering reads by their telomere/subtelomere boundaries and (iv) reporting TL for each cluster. Telogator takes as input long reads in FASTA or FASTQ format and produces an output report (in TSV format) of telomere/subtelomere boundaries and their associated TLs, as well as summary plots and statistics.
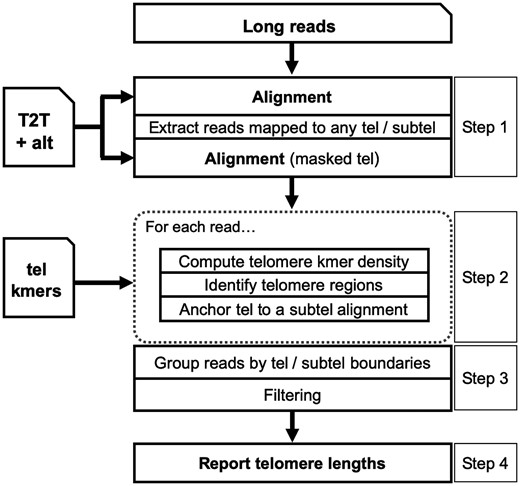
Overview of Telogator. ‘Tel’ and ‘subtel’ are used as abbreviations for telomere and subtelomere, respectively. ‘T2T + alt’ indicates the telomere-to-telomere reference genome augmented with alternate subtelomere assemblies
2.1 Extract subtelomere and telomere aligned reads
Telogator begins by aligning long reads to a copy of the T2T reference genome that is augmented with alternate subtelomere assemblies (Stong et al., 2014). Reads that align to telomere or subtelomere regions are extracted from the initial FASTA/FASTQ files to construct a reduced set of reads. In our experience with sequencing whole-genome PacBio CLR reads, this reduced read typically contains of the reads from the original FASTA/FASTQ files.
The reduced set of reads is then aligned to a copy of the T2T reference which contains only subtelomeres and the alternate subtelomere assemblies, with telomere sequences masked and appended as additional reference contigs. The reasoning for separating the telomere sequence is to prevent reads from being preferentially mapped to the specific telomere/subtelomere boundary positions in the T2T reference in cases where the telomere is anchored elsewhere in the subtelomere. For PacBio CLR reads, the pbmm2 aligner is used with the –preset SUBREAD parameter. For Nanopore reads, we instead use minimap2 with the parameters -ax map-ont -N 5 -Y -L.
2.2 Identify candidate telomere regions and telomere/subtelomere boundaries
Building upon the strategy used by edgeCase (Grigorev et al., 2021), Telogator identifies telomere regions based on the local density of telomere-specific kmers. The sequence of each aligned read is then directly queried for matches to telomere kmers (Supplementary Table S1), both their forward (FWD) and reverse-complement (REV) and allowing up to an edit distance of e = 1 (i.e. allowing 1 mismatch, insertion or deletion). Telomere kmers were identified by analyzing the 46 telomere regions extracted from the T2T reference genome. Specifically, the kmer spectrum of the telomere sequences was computed, and a manually curated list of the most frequent kmers was extracted.
The density of read positions which match to a telomere kmer is computed across sliding windows of length W (default: 100 bp) along the length of the read. Specifically, we consider:
: fraction of window matching FWD kmers (e = 0).
: fraction of window matching FWD kmers ().
: fraction of window matching REV kmers (e = 0).
: fraction of window matching REV kmers ().
The signals are then smoothed using wavelet denoising with the Daubechies D4 wavelet.
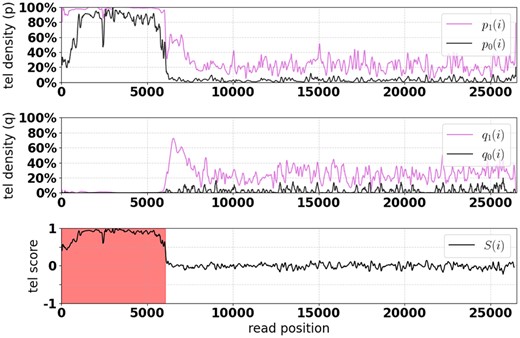
An example read from HG002 showing the kmer density and telomere scoring functions for a telomere in chr2p. The red highlighted section indicates read coordinates identified as telomere sequence
2.3 Filtering and clustering telomere/subtelomere boundaries
To contend with high sequencing error rates, ambiguous alignments involving telomere-like regions, and other systematic artifacts, the following filters are applied to reads with candidate telomeres identified from the previous steps:
Telomeres must terminate only one end of the read sequence and must comprise no more than 80% of the read length, to remove reads containing entirely (or nearly-entirely) telomere sequence.
At least 20% non-telomere portion of the read must align to a subtelomere, to remove reads that are not sufficiently anchored in a subtelomere reference sequence.
The average value of the scoring function S in non-telomere regions of the read must not exceed 0.25, to remove reads that are likely composed entirely of telomere sequence but have scores above the threshold due to sequencing errors or minor variation.
The remaining reads are then clustered together if their telomere/subtelomere boundaries are within 1k bp of each other, and then a final read-count filter is applied (by default discarding clusters that are not supposed by at least 2 reads). For each cluster, the boundary position and TLs from all reads are tabulated in an output report.
2.4 Reporting TLs
The strategy for choosing a representative TL for a chromosome arm (given a collection of reads spanning telomere/subtelomere boundaries on that arm) should take into consideration the distribution of read lengths, the possibility of multiple alleles with different TL and the cellular heterogeneity of the sample which may include cells with different TLs. For high coverage data with reads lengths exceeding the TL of the sample, choosing the maximum observed TL (barring extreme outliers) may be the best approach. We have found that choosing the 90th-percentile TL accomplishes also this, selecting a value close to the maximum while avoiding large outliers.
It is also known that in the bulk sequencing of DNA from multiple cells that there may be heterogeneity in the lengths of telomeres in those cells. It is for this reason that experimental protocols for measuring TL of specific chromosomes will usually report the mean length across all identified telomeres. In addition, it is also possible that in a single cell at the two alleles on a specific chromosome arm may have different TLs. This has been observed in STELA results as bimodal distributions of TL which could not be attributed to cellular heterogeneity (Norris et al., 2021). While Telogator does not presently detect such cases, in ongoing work we are developing an extended workflow to analyze subtelomeres, including phasing of telomere/subtelomere boundaries (using proximal heterozygous variation, if present). This strategy will potentially allow Telogator to report TL at the allele-specific level.
Since Telogator analyzes reads which may be distributed across various points in telomere (i.e. reads that begin mid-telomere and extend into subtelomere), TL estimates will likely underestimate the true length. In addition, if the length of a telomere is greater than the length of a read spanning its telomere/subtelomere boundary then the TL reported by that read will be limited to its length (minus the necessary sequence required to anchor the read in its subtelomere). It is for this reason that Telogator also produces distributions of read lengths for each chromosome arm, so that users can compare these lengths to the reported TL values. If the length of the reads is substantially larger than the reported TL, then there is an increased confidence that the supporting reads have spanned the entire length of the telomere region.
3 Results
3.1 Simulated data
To assess performance as a function of read error rate, read length and coverage, we generate simulated datasets where the ground truth TL can be compared against Telogator’s output.
Each simulated subtelomere starts by copying the corresponding 500 kb from the T2T reference, choosing a random anchor position and appending a randomly generated telomere sequence. Telomeres are positioned at randomly selected reference coordinates with randomly selected lengths between 1 and 10 kb. The randomly generated telomere sequence is produced by sampling from a Markov model using the kmer transition frequencies observed in the T2T telomeres. The transition matrix describes the likelihood of observing the next telomere kmer in a sequence, given the current kmer (Supplementary Fig. S1). As expected, the canonical CCCTAA motif is the most frequent, with other variations also present.
Reads are then simulated using the PBSIM read simulator with ‘CLR’ error mode. These reads are aligned to the T2T+alt subtelomere reference and the resultant BAM is processed by Telogator. For each cluster of reads supporting a telomere/subtelomere boundary, TL was determined by the longest TL found in any of the reads (Fig. 3).
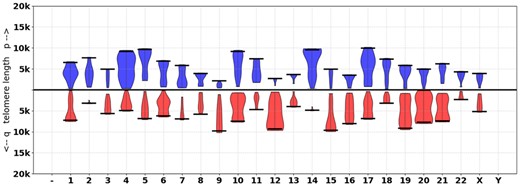
An example violin plot produced by Telogator on simulated data (read length 20k, error rate 10%). Black lines indicate the ground truth telomere length
This simulation procedure was performed with read error rates 0%, 5%, 10% and 15%, and read lengths 10k, 20k, 30k and 40k (Fig. 4). When simulating 10 kb reads, TLs are restricted to be at most 7 kb. For each parameter, combination 10 simulations were performed, for a total of 1600 runs ( simulated telomeres). Coverage was fixed at .
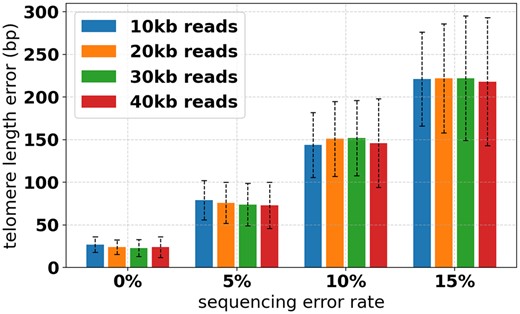
Telomere length estimation error for different sequencing error rates and read lengths
To assess the minimum viable coverage to run Telogator, we simulated data across a range of coverage values and reported the fraction of telomeres that were missed at each coverage (Fig. 5) as well as the average TL estimation error (Supplementary Fig. S2). Reads were simulated at 0%, 5%, 10% and 15% error, with read length fixed at 10k. Again, each combination was simulated 10 times, for a total of 40 samples per coverage value.
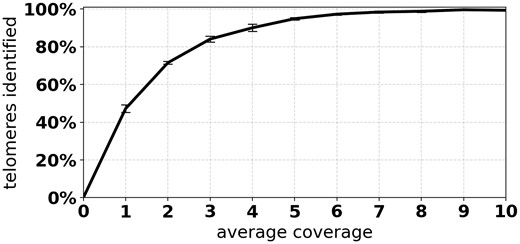
Percentage of telomeres identified by Telogator at different average coverage rates
3.2 Application to 10 germline samples
Next, we applied Telogator to 10 publicly available samples from the Sequence Read Archive (SRA) for which short reads and long reads were both available (Supplementary Table S2). The short reads are from an Illumina NovaSeq 6000, and the long reads are PacBio CLR reads from a Sequel II. For each sample, the lengths of telomeres anchored on each chromosome arm are reported alongside violin plots (example shown in Fig. 6). Telogator is able to report TL at nearly every chromosome arm in each sample, with the exception of 6p and 8p (details presented in the Discussion section).
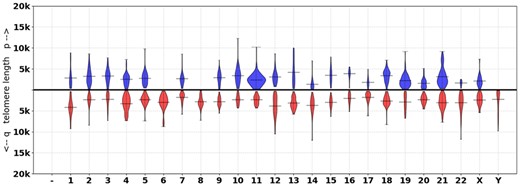
Chromosome-specific telomere length for HG002 (NA24385). The lines indicate the mean TL at each chromosome arm
3.3 Comparison of average TL to TelomereHunter
We applied the popular tool TelomereHunter (Feuerbach et al., 2019) to short reads from the same 10 samples (Supplementary Table S2). TelomereHunter is a method for reporting average TL, with very high correlation to telomere qPCR measurements (r = 0.94). The mean of all chromosome-specific TLs from Telogator is compared against the ‘tel_content’ measurement reported by TelomereHunter, yielding a correlation of r = 0.91 (Fig. 7). Based on these results, we observe that Telogator is a viable method for accurately reporting average TL, and that using the 90th-percentile for selecting representative TL at each chromosome arm yields a better correlation with short read results than using mean.
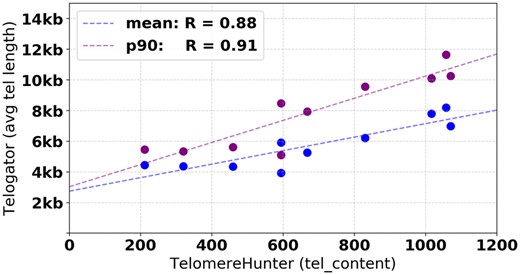
Comparison of average TLs reported by Telogator versus TelomereHunter
3.4 Chromosome-specific TL in HG002: PacBio versus Nanopore
To compare Telogator across different long read sequencing technologies, we compare results from HG002 using two publicly available datasets: whole-genome reads sequenced on a PacBio Sequel II (SRA run ID SRR11008518), and whole-genome reads sequenced on a Nanopore PromethION (SRA run ID SRR12898351). From the PacBio data Telogator reports TL for 44/46 chromosome arms (excluding Yp/Yq as it is not yet included in the T2T reference genome), with only 6p and 8p absent. From the Nanopore data, Telogator reports TL for 39/46 chromosome arms, with 6p, 8p, 9p, 15p, 17p, 19q and 22p absent. We attribute this difference to the comparatively lower coverage of the Nanopore data (Supplementary Fig. S3).
From the 39 chromosome arms where Telogator reported TL on both datasets, we observe a correlation of R = 0.76 (Fig. 8), with an average difference of 1.5 kb. Due to the significantly higher coverage and lower variance in reported TLs, we believe the estimates from the PacBio data are more likely to represent the true TL in this sample. The differences across these two datasets highlights the importance of coverage depth for using whole-genome long reads to estimate TL.
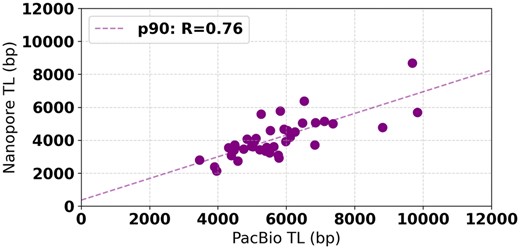
Correlation of TL as reported from PacBio reads versus Nanopore
4 Discussion
From the simulated data, we see that at low read error rates Telogator very accurately reports TL, differing from the ground truth by no more than 100 bp on average. For reads with higher error rates, Telogator’s TL estimation error is ∼200 bp on average, which we consider to be of sufficient resolution for telomere studies. Interestingly, read lengths had a minimal effect on TL accuracy, with longer reads only marginally improving performance. From Figure 5, we see that at coverage, effectively all telomeres were identified. That is, for virtually all simulated subtelomeres, at least one read was found spanning a telomere/subtelomere boundary at the simulated position. Based on these results, we are confident in applying Telogator to WGS PacBio CLR reads produced by a Sequel II platform, where typical read lengths are 10–30k, with coverage and 10–15% read error rate.
4.1 HG002—subtelomeres 6p and 8p
Owing to their variability, it is expected that we will encounter samples with subtelomeres substantially different from any of the reference sequences used by Telogator (including alternate assemblies). Such subtelomeres often contain rearrangements involving sequence from subtelomeres of other chromosome arms. Because of this, it is possible that the subtelomere sequence used by Telogator to ‘anchor’ a telomere sequence to a chromosome arm may originate from a different subtelomere than it was mapped to in our workflow. In several of the samples, we analyzed, this manifests in the Telogator’s results as not identifying any telomere/subtelomere boundaries in arms 6p and 8p.
We attribute Telogator’s ‘missed’ telomere in 6p to the presence of a haplotype with a large rearrangement involving subtelomere 20q. Using publicly available Nanopore reads for HG002 (SRA project ID PRJNA678534), we observe a ∼100 kb dispersed duplication of sequence originating from subtelomere 20q which is inserted at the telomere/subtelomere boundary in 6p (Fig. 9). This particular subtelomere haplotype has been previously observed in HG001 (Young et al., 2017). This impact of this haplotype is that telomere-spanning reads originating from 6p are aligned instead to 20q, and Telogator misattributes them as such.
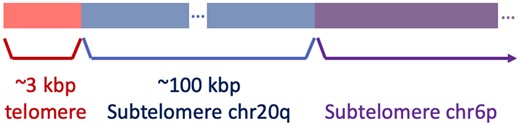
Very long Nanopore reads were found to span a 100 kb section of subtelomere 20q between telomere sequence and subtelomere 6p in HG002
The PacBio HG002 alignment processed by Telogator did not have any telomere-containing reads mapped to subtelomere 8p or its alternates. However, in the Nanopore alignment, we find a telomere/subtelomere boundary (in alternate assembly 8p), but only in reads that are long enough to span a large repetitive region nearby (Supplementary Fig. S4). Telomere sequence was found in Nanopore reads of length > 130 kb which were able to span the large stretch of repeated sequence. In the PacBio alignment the coverage drops substantially in this region and no reads containing telomere sequence were found.
4.2 Coverage requirements
From Figure 8 we see that there can be substantial variation in Telogator’s reported TL, which we largely attribute to coverage variation as described above. We observed similar issues when applying Telogator to HiFi PacBio datasets where the very low coverage (4–5× on average) resulted in many chromosome arms without any reads spanning subtelomere/telomere boundaries. While our results on simulated data show that Telogator will report telomeres at all chromosome arms for average coverage, higher coverage may be needed in real samples to increase the likelihood of having reads which span the entire lengths of the telomere regions. We acknowledge that high coverage long read data can be prohibitively expensive to generate, and in ongoing work we are pursuing strategies for selectively enriching telomere and subtelomere genomic regions. This would allow us to multiplex samples to reduce sequencing costs, while retaining sufficient coverage to be confident in the TL values reported by Telogator.
Financial Support
This work was funded in part by the National Cancer Institute grant: CA204013.
Data availability statement
The sequencing data used in this work is publicly available at the Sequence Read Archive under the accession ids listed in Supplementary Table 2.
Conflict of Interest: none declared.

