


Abstract
Easily navigating chemical space has become more important due to the increasing size and diversity of publicly-accessible databases such as DrugBank, ChEMBL or Tox21. To do so, modelers typically rely on complex projection techniques using molecular descriptors computed for all the chemicals to be visualized. However, the multiple cheminformatics steps required to prepare, characterize, compute and explore those molecules, are technical, typically necessitate scripting skills, and thus represent a real obstacle for non-specialists.
We developed the ChemMaps.com webserver to easily browse, navigate and mine chemical space. The first version of ChemMaps.com features more than 8000 approved, in development, and rejected drugs, as well as over 47 000 environmental chemicals.
The webserver is freely available at http://www.chemmaps.com.
1 Introduction
With the growing size and diversity of chemical biological databases (e.g. DrugBank, ChEMBL, Tox21), there is high demand from researchers, teachers and students to be able to easily browse and explore those complex chemical spaces. Chemography, defined as the field for navigating a chemical space (Oprea and Gottfries, 2001), typically relies on projection techniques such as principal component analysis (Wold et al., 1987) or generative topographic mapping (Bishop et al., 1998; Kireeva et al., 2012) to represent a set of molecules into a two- or three-dimensional space. As those molecules are defined in hundreds of dimensions corresponding to descriptors computed from their chemical structures, there are obvious limitations to such dimensional reduction techniques. (Fourches and Tropsha, 2013). Moreover, all these methods are technical, typically require coding or scripting skills, and have been strictly designed to be used by specialists. With the emergence of web3D libraries, several new interactive tools to visualize chemical space have been developed recently. For example, the webDrugCS webserver (Awale and Reymond, 2016) or ChemGPS-NPWeb (Rosén et al., 2009) are capable of projecting the drug space based on different types of molecular fingerprints and descriptors. However, as of today, there is no fully interactive, easy-to-use tool that anyone could use to rapidly explore a given chemical space.
Herein, we report on the development of ChemMaps.com, a webserver-based tool especially designed to easily navigate chemical space. Based on the Three.js web technology, users can immediately explore entire compound libraries using a responsive, mouse-based navigation interface. Similar to the popular navigation tool Google Maps, ChemMaps.com includes a dedicated search bar (e.g. name, indications, pharmacological class), different visualization options (e.g. color option, zoom) and an interactive description panel. ChemMaps.com aims to become the go-to website for anyone wanting to search, mine or visualize chemical space.
2 Materials and methods
Computing chemical space: ChemMaps.com uses a complex compendium of 1D, 2D and 3D pre-computed molecular descriptors to generate the chemical space in three dimensions. The first two dimensions were defined using a principal component analysis from a set of 648 1D/2D RDKit descriptors computed using the Python library PyDPI (Cao et al., 2013). Only informative descriptors (i.e. no null variance, no correlated descriptors with pairwise R > 0.9) were conserved. The third dimension was computed using 502 3D descriptors adapted from PyDPI library filtered using the same protocol. Importantly, 3D chemical structures were generated from SMILES strings using Ligprep from the Schrödinger software suite (release 2017.3), with only the lowest-energy conformation conserved for each chemical. Before computing descriptors, all SMILES were pre-processed, standardized and curated using MolVS (https://molvs.readthedocs.io). In particular, SMILES were canonicalized, and organic mixtures were removed (Fourches et al., 2016).
Web-server navigation: ChemMaps.com was developed in html/JavaScript using the Three.js library, which allows for an interactive, mouse-based, easy-to-use navigation in any internet browser on mobile or computer platforms. Since all information and coordinates of the molecules are pre-computed, the browsing does not require computational skills and is instantaneous (especially if the device has a dedicated GPU with >1GB of memory), allowing for a smooth and natural utilization by non-specialists. ChemMaps.com was developed to work on usual Web browsers in their latest versions (e.g. Firefox >59, Chrome >65, Safari >5) and requires the WebGL JavaScript API as a dependence.
Navigation options: Inspired by popular tools such as Google Maps, users have different options accessible from the main panel (see Fig. 1): (i) A dedicated search bar allowing users to rapidly identify a specific compound based on its chemical name, ID or generic name; (ii) A description panel including chemical properties such as logP or molecular weight and the chemical structure rendering of the selected molecule. This panel also includes options to connect and/or extract up to twenty most similar molecules in that space; (iii) A visualization panel including options to choose which types of compounds are displayed (e.g. approved drugs, withdrawn, in development; known toxicities), and options to color compounds based on chemical properties.
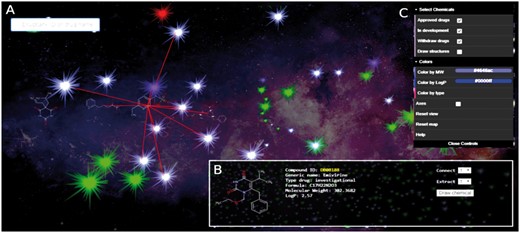
Screenshot of the ChemMaps.com main window. Each compound is represented using a dynamic star. Map also includes: (A) search engine, (B) descriptor panel including the names and properties of the compound selected by the user and (C) a control panel for compound drawing options, selection and color schemes according to various filters and properties (Color version of this figure is available at Bioinformatics online.)
3 Applications
This first version of ChemMaps.com focused on the chemical space defined by all drugs from the DrugBank database (Law et al., 2014) with 8752 compounds (DrugMap: release date December 20, 2017). Only small molecules and small peptides were considered. Drugs’ first and second coordinates were computed from 116 1D and 2D descriptors, representing 14.0% (X-axis) and 8.5% (Y-axis) of the overall variance in the descriptor space. The third coordinate was computed from 122 3D descriptors defining 20.4% of descriptor variability. Overall, users can search, mine and explore this incredible library of drugs as easily as they would look at a city map. For instance, one can visualize compounds with high molecular weight on the right of the map, including mostly small peptides and natural product derivatives such as antifungal drugs (e.g. pasireotide, caspofungin, anidulafungin). ChemMaps.com could open new perspectives for drug repurposing, e.g. by directly visualizing the proximity and structure similarity between two drugs being very close in the drug space. Studying proximities of approved drugs to molecules in clinical trials, or searching for the most similar molecules to a given drug are complex tasks now being easily feasible by anyone with ChemMaps.com.
The chemical coverage of ChemMaps.com is now being expanded to include environmental chemical space, e.g. based on the U.S. EPA TSCA inventory (https://www.epa.gov/tsca-inventory), as well as toxicological categorizations derived from curated animal study data and predictive high-throughput screening signatures. This EnvMap currently includes 47 804 chemicals (release date: February 1, 2018) curated and computed using the same protocol as for the drugs. Beyond the obvious utility in toxicological read-across, identifying under-studied areas of the chemical (and drug) space is a further application of high scientific interest.
4 Conclusion
ChemMaps.com is a cheminformatics-powered webserver aiming at facilitating visual browsing and inspection of a given chemical space. In the first release of ChemMaps.com, we focused on the drug space and providing a ready-to-use tool for anyone. This generic tool is easily upgradable to other compound libraries (publicly accessible or via secured intranet for private molecule collections). Future versions of ChemMaps.com will notably include full navigation of the Tox21, ChEMBL and DSSTox databases. ChemMaps.com is freely available at http://www.chemmaps.com.
Acknowledgements
The authors gratefully thank the NC State Chancellor’s Faculty Excellence Program for funding and support. The opinions expressed here are those of the authors and do not represent official US government policy.
Funding
Funding received from the NC State Chancellor’s Faculty Excellence Program.
Conflict of Interest: none declared.
References

