


Abstract
Identification of enhancers and their strength is important because they play a critical role in controlling gene expression. Although some bioinformatics tools were developed, they are limited in discriminating enhancers from non-enhancers only. Recently, a two-layer predictor called ‘iEnhancer-2L’ was developed that can be used to predict the enhancer’s strength as well. However, its prediction quality needs further improvement to enhance the practical application value.
A new predictor called ‘iEnhancer-EL’ was proposed that contains two layer predictors: the first one (for identifying enhancers) is formed by fusing an array of six key individual classifiers, and the second one (for their strength) formed by fusing an array of ten key individual classifiers. All these key classifiers were selected from 171 elementary classifiers formed by SVM (Support Vector Machine) based on kmer, subsequence profile and PseKNC (Pseudo K-tuple Nucleotide Composition), respectively. Rigorous cross-validations have indicated that the proposed predictor is remarkably superior to the existing state-of-the-art one in this area.
A web server for the iEnhancer-EL has been established at http://bioinformatics.hitsz.edu.cn/iEnhancer-EL/, by which users can easily get their desired results without the need to go through the mathematical details.
Supplementary data are available at Bioinformatics online.
1 Introduction
Enhancers are noncoding DNA fragments but they play a key role in controlling gene expression for the production of RNA and proteins (Omar et al., 2017). Enhancers can be located up to 20 kb away from a gene, or even in a different chromosome (Liu et al., 2016a); while promoters (a kind of gene proximal elements) are located near the transcription start sites of genes. Such locational difference makes the identification of enhancers much more challenging than that of promoters.
In the earlier days, identification of enhancers was carried out purely by the experimental techniques, such as the pioneering works reported in Heintzman and Ren, (2009) and (Boyle et al. (2011). The former was to detect enhancers via their combination with TF (transcription factor) such as P300 (Heintzman et al., 2007; Visel et al., 2009), and hence it would miss or under-detect the targets concerned because not all enhancers are occupied by TFs, resulting in high false negative rate (Chen et al., 2007). The latter was to identify enhancers via the DNase I hypersensitivity, and hence some other DNA segments or non-enhancers might be incorrectly or over detected as enhancers (Liu et al., 2016a,Liu et al., 2018b), leading to high false positive rate (Chen et al., 2007). Although the follow-up techniques of genome-wide mapping of histone modifications (Ernst et al., 2011; Erwin et al., 2014; Fernández and Miranda-Saavedra, 2012; Firpi et al., 2010; Kleftogiannis et al., 2015; Rajagopal et al., 2013) can alleviate the aforementioned shortcomings in detecting the enhancers and promoters and improve the detection rate, they are expensive and time-consuming.
In order to fast identify enhancers in genomes, several computational prediction methods have been developed, including CSI-ANN (Firpi et al., 2010), EnhancerFinder (Erwin et al., 2014), RFECS (Rajagopal et al., 2013), EnhancerDBN (Bu et al., 2017) and BiRen (Yang et al., 2017). These bioinformatics tools differ with each other in using different sample formulation and/or operational algorithm during the 2nd and/or 3rd steps of the 5-step rule (Chou, 2011). For instance: CSI-ANN (Firpi et al., 2010) is featured by using ‘efficient data transformation’ to formulate the samples, and the algorithm of Artificial Neural Network (ANN); EnhancerFinder (Erwin et al., 2014) is featured by incorporating the evolutionary conservation information into the sample formulation, and the combined multiple kernel learning algorithm; RFECS (Rajagopal et al., 2013), featured by the random forest algorithm (Rajagopal et al., 2013); EnhancerDBN (Bu et al., 2017) is based on the deep belief network; BiRen (Yang et al., 2017) improved the predictive performance by using deep learning techniques. Using these bioinformatics tools, users can easily obtain their desired data. However, enhancers are a large group of functional elements formed by many different subgroups (Shlyueva et al., 2014), such as strong enhancers, weak enhancers, poised enhancers, inactive enhancers, etc. The iEnhancer-2L (Liu et al., 2016a) is the first predictor ever developed that is able to identify both the enhancers and their strength based only on the sequence information alone, and hence has been increasingly used in the genomics analysis. The iEnhancer-2L (Liu et al., 2016a) is featured by the Pseudo K-tuple nucleotide composition (PseKNC) (Chen et al., 2014,, 2015a). Later, this method was further improved by incorporating other sequence-based features, for examples, the EnhancerPred (Jia, 2016 #45), bi-profile Bayes (Shao et al., 2009), pseudo-nucleotide composition (Chen et al., 2014), EnhancerPred2.0 (He and Jia, 2017) and electron–ion interaction pseudopotentials of nucleotides (Nair and Sreenadhan, 2006).
However, the success rates of these predictors need to be further improved, particularly in discriminating the strong enhancers from the weak ones. This study was initiated in an attempt to deal with this problem.
According to the Chou's 5-step rules (Chou, 2011) that have been followed by a series of recent studies (see e.g. Cheng et al., 2018a; Feng et al., 2017; Liu et al., 2017a,b,c,, 2018b; Song et al., 2018b; Xiao et al., 2017; Xu et al., 2017), to develop a really useful predictor for a biological system, one should make the following five steps logically very clear: (i) benchmark dataset construction or selection, (ii) sample formulation, (iii) operation engine or algorithm, (iv) cross-validation and (v) web-server.
Below, let us elaborate the five steps one by one.
2 Materials and methods
2.1 Benchmark dataset
2.2 Sample formulation
One of the prerequisites in developing an effective bioinformatics predictor is how to formulate a biological sequence with a discrete model or a vector, yet still considerably keep its sequence-order information or key pattern characteristic. This is because all the existing machine-learning algorithms can only handle vectors but not sequences, as elucidated in a comprehensive review (Chou, 2015). However, a vector defined in a discrete model may completely lose all the sequence-pattern information (Chou, 2001a). To avoid this, here the DNA sequence samples were converted into vectors via the BioSeq-Analysis tool (Liu, 2018) to incorporate the information of kmer (Liu et al., 2016b), subsequence profile (Lodhi et al., 2002; Luo et al., 2016; Yasser et al., 2008) and pseudo k-tuple nucleotide composition (PseKNC) (Chen et al., 2014,, 2015b), as detailed below.
2.2.1 Kmer
There is one parameter (k) in the kmer approach.
2.2.2 Subsequence profile
The subsequence profile (Lodhi et al., 2002; Luo et al., 2016; Yasser et al., 2008) allows non-continuous mismatching, which may improve the Kmer approach in dealing with the cases of residue mutation, deletion and replacement during the biological sequence evolutionary process. Its detailed formulation has been clearly elaborated in Luo et al. (2016), and hence there in no need to repeat here.
The subsequence profile contains two parameters k and ; the latter is used to reflect the mismatch’s extent (Luo et al., 2016).
2.2.3 Pseudo k-tuple nucleotide composition
There are three parameters in PseKNC (Chen et al., 2014): k, w (the weight factor) and [the number of sequence correlations considered (Chou, 2005)].
2.3 Operation engine
In this study we chose to use SVM (Support Vector Machine) to operate the prediction. SVM is a machine-learning algorithm that has been widely used in the realm of bioinformatics (see e.g. Chen et al., 2013,, 2016; Ehsan et al., 2018; Khan et al., 2017; Liu et al., 2014; Meher et al., 2017; Rahimi et al., 2017; Tahir et al., 2017). For a brief formulation of SVM and how it works, see the papers (Cai et al., 2003; Chou and Cai, 2002) without the need to repeat here. For more details about SVM, see a monograph (Cristianini and Shawe-Taylor, 2000).
The LIBSVM package (Chang and Lin, 2011) with the radial basis function (RBF) kernel was used to implement the learning machine, in which there are two parameters (for the regularization) and (for the kernel width), which will be given later via an optimization approach.
Accordingly, when using SVM on kmer, subsequence profile, or PseKNC, we have a total of (2 + 1) = 3, (2 + 2) = 4 or (2 + 3) = 5 uncertain parameters, respectively. The values for the two SVM-related parameters and are determined by the final optimization as will be given later.
Therefore, we have a total of (6 + 15 + 150) = 171 different elementary classifiers.
2.4 Ensemble learning
As demonstrated by a series of previous studies (Chou and Shen, 2006a; Jia et al., 2015,, 2016a; Liu et al., 2016b,, 2017a; Qiu et al., 2017), the ensemble predictor formed by fusing an array of individual predictors via a voting system can yield much better prediction quality.
There are two fundamental issues for developing an ensemble-learning predictor: one is how to select the key individual classifiers from the elementary ones to reduce the noise, and the other is how to fuse the selected key classifiers into one final classifier. Inspired by the works (Lin et al., 2014a; Liu et al., 2016b,, 2017a), the treatment for the issue has been elaborated in Lin et al. (2014a) and Liu et al. (2016b,, 2017a). The essence is that using the ‘affinity propagation clustering algorithm’ (Frey and Dueck, 2007) to cluster the elementary classifiers into a set of groups (Fig. 1a) and how the key classifiers were selected from these groups (Fig. 1b). For those who are interested in the detailed process, see Supplementary Information S3.
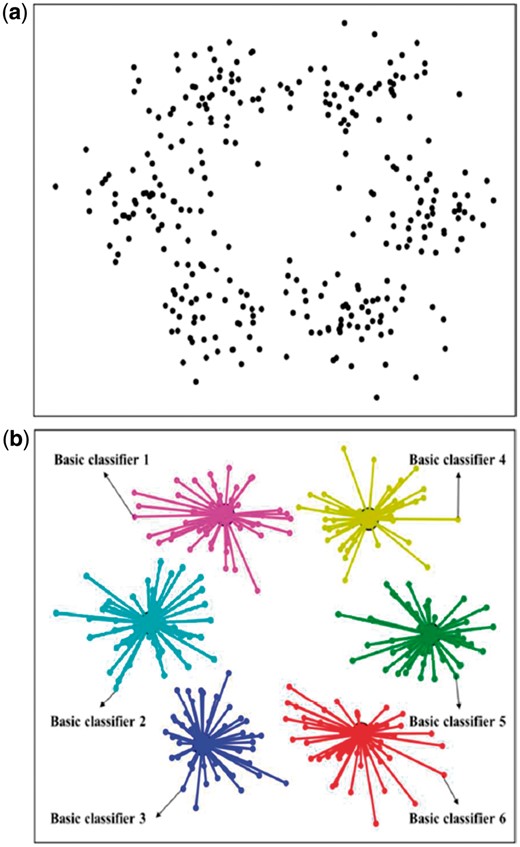
An illustration to show (a) how the elementary classifiers were clustered into a set of groups, and (b) how to select the key classifiers from these groups
List of the six key individual classifiers selected from the 171 elementary classifiers in Eqs. 8, 10 and 12 by using the affinity propagation clustering algorithm (Frey and Dueck, 2007) as done in (Liu et al., 2016a) for the 1st-layer prediction
| Key individual classifier | Feature vector | Dimension |
|---|---|---|
| PseKNCa | 77 | |
| PseKNCb | 81 | |
| PseKNCc | 4113 | |
| Subsequence profiled | 64 | |
| Kmere | 64 | |
| Kmerf | 4096 |
| Key individual classifier | Feature vector | Dimension |
|---|---|---|
| PseKNCa | 77 | |
| PseKNCb | 81 | |
| PseKNCc | 4113 | |
| Subsequence profiled | 64 | |
| Kmere | 64 | |
| Kmerf | 4096 |
The parameters used: k = 3,λ = 13, w = 0.1,.
The parameters used: k = 3,λ = 17, w = 0.1, .
The parameters used: k = 6,λ = 17, w = 0.1, .
The parameters used: k = 3, = 0.5,.
The parameters used: k = 3, .
The parameters used: k = 6, , .
List of the ten key individual classifiers selected from the 171 elementary classifiers in Eqs. 8, 10 and 12 by using the affinity propagation clustering algorithm (Frey and Dueck, 2007) as done in (Liu et al., 2016a) for the 2nd-layer prediction
| Key individual classifier | Feature vector | Dimension |
|---|---|---|
| PseKNCa | 9 | |
| PseKNCb | 9 | |
| PseKNCc | 9 | |
| PseKNCd | 13 | |
| PseKNCe | 29 | |
| PseKNCf | 77 | |
| PseKNCg | 81 | |
| PseKNCh | 265 | |
| Kmeri | 64 | |
| Kmerj | 4096 |
| Key individual classifier | Feature vector | Dimension |
|---|---|---|
| PseKNCa | 9 | |
| PseKNCb | 9 | |
| PseKNCc | 9 | |
| PseKNCd | 13 | |
| PseKNCe | 29 | |
| PseKNCf | 77 | |
| PseKNCg | 81 | |
| PseKNCh | 265 | |
| Kmeri | 64 | |
| Kmerj | 4096 |
The parameters used: k = 1,λ = 5, w = 0.1, .
The parameters used: k = 1,λ = 5, w = 0.7.
The parameters used: k = 1,λ = 5, w = 0.9, .
The parameters used: k = 1,λ = 9, w = 0.9,
The parameters used: k = 2,λ = 13, w = 0.1, .
The parameters used: k = 3,λ = 13, w = 0.3, .
The parameters used: k = 3,λ = 17, w = 0.7, .
The parameters used: k = 5,λ = 9, w = 0.7, .
The parameters used: k = 3,.
The parameters used: k = 6, ,.
The proposed predictor for identifying enhancers and their strength is called iEnhancer-EL, where ‘i’ stands for ‘identify’ and ‘EL’ for ‘ensemble learning’. In Figure 2 is a flowchart to illustrate how the predictor is working.
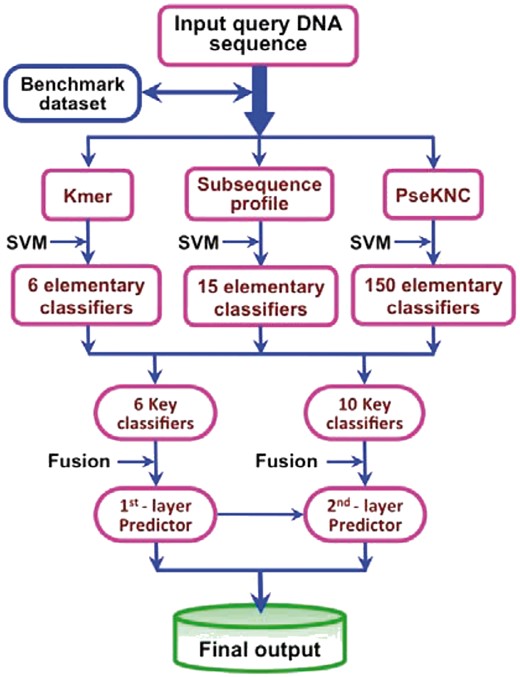
A flowchart to illustrate how iEnhancer-EL is working
2.5 Cross-validation
To objectively evaluate the performance of a new predictor, we need to consider the following two issues: (i) what metrics should be used to reflect its performance in a quantitative way? (ii) what method should be adopted to derive the metrics?
Based on the definition of Eq. 17, the meanings of Sn, Sp, Acc and MCC have become much more intuitive and easier to understand, as discussed and used in a series of recent studies in various biological areas (see e.g. Chen et al., 2018a; Ehsan et al., 2018; Feng et al., 2017, 2018; Khan et al., 2018; Liu et al., 2017a,b,c, 2018a,b; Song et al., 2018c; Xu et al., 2014, 2017; Yang et al., 2018). In addition, the Area Under ROC Curve (AUC) (Fawcett, 2006) was also used to measure quality of the predictor.
With a set of quantitative metrics clearly defined, the next is how to test their values. As is well known, the independent dataset test, subsampling (or K-fold cross-validation) test and jackknife test are the three cross-validation methods widely used for testing a prediction method (Chou and Zhang, 1995). To reduce the computational cost, in this study we adopted the 5-fold cross-validation (namely ) to optimize the parameters in our method as done by many investigators with SVM as the prediction engine (see e.g. Khan et al., 2017; Meher et al., 2017; Rahimi et al., 2017; Tahir et al., 2017). The concrete process is as follows. The benchmark dataset was randomly divided into five subsets with an approximately equal number of samples. Each predictor runs five times with five different training and test sets. For each run, three sets were used to train the predictor, one set was used as the validation set to optimize the parameters, and the remaining one was used as the test set to give the predictive results. In this study, the jackknife test was also used to evaluate the performance of different methods.
3 Results and discussion
3.1 Comparison with the existing methods
Listed in Table 3 are the metrics rates (Eq. 17) achieved by iEnhancer-EL via the jackknife test on the benchmark dataset (cf. Supplementary Information S1). For facilitating comparison, listed there are also the corresponding rates obtained by iEnhancer-2L using exactly the same cross-validation method and same benchmark dataset.
A comparison of the proposed predictor with the state-of-the-art predictor in identifying enhancers (the 1st-layer) and their strength (the 2nd-layer) via the jackknife test on the same benchmark dataset (Supplementary Information S1)
| Method | Acc(%) | MCC | Sn(%) | Sp(%) | AUC(%) | |
|---|---|---|---|---|---|---|
| First layer | iEnhancer-ELa | 78.03 | 0.5613 | 75.67 | 80.39 | 85.47 |
| iEnhancer-2Lb | 76.89 | 0.5400 | 78.09 | 75.88 | 85.00 | |
| EnhancerPredc | 73.18 | 0.4636 | 72.57 | 73.79 | 80.82 | |
| Second layer | iEnhancer-ELa | 65.03 | 0.3149 | 69.00 | 61.05 | 69.57 |
| iEnhancer-2Lb | 61.93 | 0.2400 | 62.21 | 61.82 | 66.00 | |
| EnhancerPredc | 62.06 | 0.2413 | 62.67 | 61.46 | 66.01 |
The predictor proposed in this paper.
The predictor reported in Liu et al. (2016a).
The predictor reported in Jia and He (2016).
From Table 3 we can see the following. (i) For the 1st-layer prediction, namely in discriminating enhancers from non-enhancers, except for Sn, the success rates achieved by the proposed predictor for the other metrics are all higher than those by the existing state-of-the-art predictors. (ii) For the 2nd-layer prediction, namely in identifying the strength of enhancers, except for Sp, all the other three metrics rates as well as the AUC value obtained by the proposed predictor are higher than those by the existing state-of-the art predictors. It is instructive to point out that, of the four metrics in Eq. 17, the most important are the Acc and MCC. The former is used to measure a predictor’s overall accuracy, and the latter for its stability. Under such a circumstance, the iEnhancer-EL outperformed both iEnhancer-2L and EnhancerPred according to the Acc and MCC metrics.
3.2 Independent dataset test
An independent dataset was used to further evaluate the performance of various methods, which was constructed based on the same protocol as the one used in constructing the benchmark dataset. The independent dataset contains 100 strong enhancers, 100 weak enhancers and 200 non-enhancers (Supplementary Information S4). None of the samples in the independent dataset occurs in the training dataset. The CD-HIT software (Li and Godzik, 2006) was used to remove those samples in the independent dataset that have more than 80% sequence identity to any other in a same subset. The results obtained by the proposed predictor by the independent dataset test are given in Table 4, where for facilitating comparison, the corresponding results by other two methods were also listed. It can be clearly seen from the table that the iEnhancer-EL predictor is superior to its counterparts in nearly all the four metrics. Although the new predictor is slightly lower than iEnhancer-2L in Sp by 2.5%, its Sn rate is 4.5% higher than that of the iEnhancer-2L.
A comparison of the proposed predictor with the state-of-the-art predictors in identifying enhancers (the 1st-layer) and their strength (the 2nd-layer) on the independent dataset (Supplementary Information S4)
| Method | Acc(%) | MCC | Sn(%) | Sp(%) | AUC(%) | |
|---|---|---|---|---|---|---|
| First layer | iEnhancer-ELa | 74.75 | 0.4964 | 71.00 | 78.50 | 81.73 |
| iEnhancer-2Lb | 73.00 | 0.4604 | 71.00 | 75.00 | 80.62 | |
| EnhancerPredc | 74.00 | 0.4800 | 73.50 | 74.50 | 80.13 | |
| Second layer | iEnhancer-ELa | 61.00 | 0.2222 | 54.00 | 68.00 | 68.01 |
| iEnhancer-2Lb | 60.50 | 0.2181 | 47.00 | 74.00 | 66.78 | |
| EnhancerPredc | 55.00 | 0.1021 | 45.00 | 65.00 | 57.90 |
The predictor proposed in this paper.
The predictor reported in Liu et al. (2016a).
The predictor reported in Jia and He (2016).
Note that, of the four metrics in Eq. 17, the most important are the Acc and MCC: the former reflects the overall accuracy of a predictor; while the latte, its stability in practical applications. The metrics Sn and Sp are used to measure a predictor from two different angles. When, and only when, both Sn and Sp of the predictor A are higher than those of the predictor B, can we say A is better than B. In other words, Sn and Sp are actually constrained with each other (Chou, 1993). Therefore, it is meaningless to use only one of the two for comparing the quality of two predictors. A meaningful comparison in this regard should count the rates of both Sn and Sp, or even better the rate of their combination that is none but MCC, for which the proposed predictor achieved the highest rate as shown in Table 4.
3.3 Web-server and its user guide
As pointed out in (Chou and Shen, 2009) and supported by a series of follow-up publications (see e.g. Chen et al., 2018b; Cheng et al., 2017, 2018a,b; Jia et al., 2015,, 2016b; Lin et al., 2014b; Liu et al., 2018b; Song et al., 2018a,b,c; Wang et al., 2017, 2018; Xiao et al., 2013; Xu et al., 2013b), user-friendly and publicly accessible web-servers represent the future direction for developing practically more useful predictors. Actually, a new prediction method with the availability of a user-friendly web-server would significantly enhance its impacts (Chou, 2015), driving medicinal chemistry into an unprecedented revolution (Chou, 2017). In view of this, the web-server for iEnhancer-EL has been established. Furthermore, to maximize the convenience of most experimental scientists, the step-by-step instructions are given below.
Step 1. Open the web-server at http://bioinformatics.hitsz.edu.cn/iEnhancer-EL/ and you will see its top page as shown in Figure 3. Click on the Read Me button to see a brief introduction about the server.
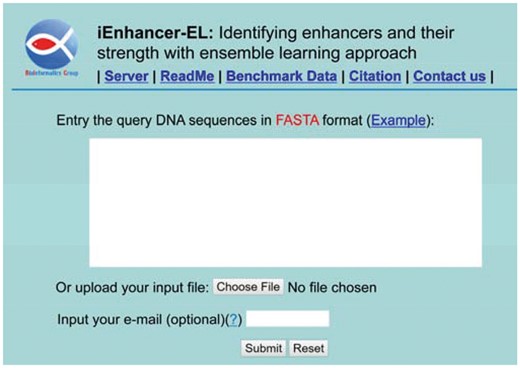
A semi-screenshot to show the top page of iEnhancer-EL web server. Its web-site address is at http://bioinformatics.hitsz.edu.cn/iEnhancer-EL/
Step 2. You can either type or copy/paste the query DNA sequence into the input box at the center of Figure 3, or directly upload your input data by the Browse button. The input sequence should be in the FASTA format. Not familiar with it? Click the Example button right above the input box.
Step 3. Click on the Submit button to see the predicted result. For example, if using the example sequence to run the web server, you will see the following outcome: (i) the first query sequence contains nine strong enhancers: sub-sequences 1-200, 2-201, 3-202, 4-203, 5-204, 6-205, 7-206, 8-207 and 9-208; (ii) the second query sequence contains one strong enhancer at sub-sequence 1-200; (iii) both the third and fourth query sequences contain one weak enhancer at sub-sequence 1-200; (iv) the fifth and sixth query sequences contain no enhancer. All these predicted results are fully consistent with experimental observations.
Step 4.You can download the predicted results into a file by clicking the Download button on the results page.
Acknowledgement
The authors are very much indebted to the four anonymous reviewers, whose constructive comments are very helpful for strengthening the presentation of this article.
Funding
This work was supported by the National Natural Science Foundation of China (No. 61672184, 61732012, 61520106006), Guangdong Natural Science Funds for Distinguished Young Scholars (2016A030306008), Scientific Research Foundation in Shenzhen (Grant No. JCYJ20170307152201596), Guangdong Special Support Program of Technology Young talents (2016TQ03X618), Fok Ying-Tung Education Foundation for Young Teachers in the Higher Education Institutions of China (161063) and Shenzhen Overseas High Level Talents Innovation Foundation (Grant No. KQJSCX20170327161949608).
Conflict of Interest: none declared.
References

