


Abstract
Correct taxonomic identification of DNA sequences is central to studies of biodiversity using both shotgun metagenomic and metabarcoding approaches. However, no genetic marker gives sufficient performance across all the biological kingdoms, hampering studies of taxonomic diversity in many groups of organisms. This has led to the adoption of a range of genetic markers for DNA metabarcoding. While many taxonomic classification software tools can be re-trained on these genetic markers, they are often designed with assumptions that impair their utility on genes other than the SSU and LSU rRNA. Here, we present an update to Metaxa2 that enables the use of any genetic marker for taxonomic classification of metagenome and amplicon sequence data.
We evaluated the Metaxa2 Database Builder on 11 commonly used barcoding regions and found that while there are wide differences in performance between different genetic markers, our software performs satisfactorily provided that the input taxonomy and sequence data are of high quality.
Freely available on the web as part of the Metaxa2 package at http://microbiology.se/software/metaxa2/.
Supplementary data are available at Bioinformatics online.
1 Introduction
Sequencing of DNA has revolutionized taxonomy, providing unprecedented resolution for species identification and definition (Hibbett et al., 2016; Woese et al., 1990). Similarly, the advent of large-scale sequencing techniques has opened entirely new windows on ecology, both for microbes and multicellular species (Crampton-Platt et al., 2016; Yoccoz, 2012). In particular, high-throughput assignment of species and genus designations based on mixed samples of organisms or environmental substrates, so called DNA metabarcoding (Taberlet et al., 2012), has made it possible to perform fine-tuned investigations of taxonomic diversity and to understand ecological interactions in different types of environments. However, an important bottleneck in such analyses is the size and quality of the reference sequence data to which the newly generated sequence reads are compared (Bengtsson-Palme et al., 2016a; Nilsson et al., 2006). Furthermore, no single genetic marker seems to be sufficient for covering all taxonomic groups with satisfactory accuracy for species or even genus assignments (Wang et al., 2015). For example, the small subunit (SSU) 16S/18S rRNA gene broadly employed in studies of microbial diversity provides poor taxonomic resolution in a variety of eukaryotic lineages (Bruns and Taylor, 2016; Lindahl et al., 2013). This has led to the establishment of a wide range of other genetic markers for DNA barcoding and metabarcoding in different organisms. For example, the rbcL, matK, trnL and trnH genes are frequently used for plant barcoding (Richardson et al., 2015), the internal transcribed spacer (ITS) region is commonly employed for barcoding of fungi (Schoch et al., 2012), the COI gene is commonly used for species delineation in animals (Hebert et al., 2003b), and the ATP9-NAD9 region has been proposed for separating species in the genus Phytophthora of the Oomycota phylum (Bilodeau et al., 2014). These alternative DNA barcodes present challenges for sequence classification tools, which usually were developed with the rRNA genes in mind (Edgar, 2016; Soergel et al., 2012; Wang et al., 2007). Although some of these software tools can be re-trained on other reference datasets, or have their reference databases exchanged for datasets representing other genes, they still make assumptions with regards to the reference data—such as global alignability—that often negatively affect performance, or prevent software operation altogether. In addition, their sensitivity seems to be inversely related to their accuracy, such that increasing stringency with regards to correct taxonomic assignment comes at the cost of lower proportion of classified sequences (Richardson et al., 2017). This tendency has been shown for some taxonomic classifiers also when operating on the rRNA genes (Bengtsson-Palme et al., 2015). The classification tool that appeared least prone to show such a relationship was the recently developed Metaxa2 software, which is based on a combination of hidden Markov models and sequence alignments (Bengtsson et al., 2011; Bengtsson-Palme et al., 2015). Metaxa2 examines arbitrary DNA sequence datasets, such as genomes, metagenomes or amplicons, and extracts the SSU and/or large subunit (LSU) rRNA genes; classifies the sequences to taxonomic origin; and optionally computes a range of diversity estimates for the studied community (Bengtsson-Palme et al., 2016b). However, Metaxa2 has so far been strictly limited to operation on the SSU and LSU rRNA genes, preventing its use for other DNA barcodes. Yet, the capability of Metaxa2 to achieve high precision for its classifications while maintaining relatively high sensitivity would be highly desirable also for alternative barcoding markers, particularly as these genes often are under-sampled in terms of species coverage (Richardson et al., 2017). Against this backdrop, the aim of this study was to adapt the Metaxa2 software for any DNA barcode. To this end, the paper presents an update to Metaxa2 itself, allowing the use of custom databases. We also introduce the Metaxa2 Database Builder—a software tool that allows users to create customized databases from DNA sequences and their associated taxonomic affiliations. Finally, we present an online repository of databases for Metaxa2, which can be used to easily install additional reference sets to meet the needs of the user.
2 System and methods
The Metaxa2 Database Builder (metaxa2_dbb) is a command-line, open source, Unix/Linux tool implemented in Perl. The software requires, on top of Perl, the Metaxa2 (Bengtsson-Palme et al., 2015), HMMER3 (Eddy, 2011), NCBI BLAST (Altschul et al., 1997) and MAFFT (Katoh and Standley, 2013) software to be installed. In addition, USEARCH (Edgar, 2010) or VSEARCH (Rognes et al., 2016) is highly recommended for full functionality. The Metaxa2 Database Builder is freely available as part of the Metaxa2 package (version 2.2 and later) from http://microbiology.se/software/metaxa2/
3 Algorithm
In short, the metaxa2_dbb tool creates the hidden Markov models (HMMs) and BLAST reference database required to build a custom Metaxa2 classification database (for an overview flowchart, see Supplementary Fig. S1). The metaxa2_dbb tool can be run in three different operating modes, depending on how similar the sequences in the reference database are to each other. In the conserved mode, used when sequences have regions of relatively high sequence similarity, the software first identifies a suitable main reference sequence, either by user selection or by clustering the sequences at 80% identity using USEARCH, and then selecting the representative sequence of the largest cluster. Next, it uses the (5′) start and (3′) end of the main reference sequence to define which of the other sequences in the input dataset that should be considered to be full-length, and extracts those regions using Metaxa2. Thereafter, the identified full-length sequences are aligned using MAFFT, and the regions outside of the start and end of the main reference sequence are trimmed away before re-aligning the trimmed sequences. The final alignment is used to determine the degree of sequence conservation across the alignment to identify the regions that are more conserved and the ones that are more variable. The conserved regions of the alignment are extracted and aligned individually using MAFFT. Those alignments are used to build separate HMMs for each conserved region with hmmbuild of the HMMER package. The full-length input sequences matching at least half of those HMMs are then used to build the BLAST classification database, and their sequence IDs are edited to be compatible with the Metaxa2 database structure.
In the divergent mode, the input sequences are first clustered into groups with at least 20% sequence identity using USEARCH. Each such cluster is aligned separately using MAFFT. The alignments are subsequently split at the mid position (including gaps), and each pair of alignments is used to build two separate HMMs using hmmbuild. The input sequences matching at least one of those HMMs are then used to build the BLAST database for classification, and their sequence IDs are edited as above. The third mode—the hybrid mode—is a combination of the conserved and divergent modes, in which the database builder will cluster the input sequences at 20% identity using USEARCH, and then proceed with same approach as in the conserved mode on each resulting cluster separately.
From this point, the analysis proceeds identically for the three modes. The software reads taxonomy data in any of the following formats: ASN.1, NCBI XML and INSD XML formats, as provided by GenBank (Clark et al., 2016); FASTA format with taxonomy data as part of the sequence headers, as provided by the SILVA (Quast et al., 2013) and Greengenes (McDonald et al., 2012) databases; and the Metaxa2 tabulated taxonomy format. Optionally, the taxonomy data can be filtered to exclude sequences from uncultured or unknown organisms or with low-resolution taxonomic annotation information. The sequence data and taxonomic information are subsequently crosschecked such that entries are only retained if both sequence and taxonomy data are present. The remaining sequences are then compiled into a BLAST database using formatdb or makeblastdb of the BLAST/BLAST+ packages. Thereafter, unless pre-determined sequence identity cutoffs are provided by the user, suitable identity thresholds for taxonomic assignments at different classification levels are determined automatically. This is done by aligning the sequences in the BLAST database using MAFFT and then calculating the pairwise percent identity within and between taxonomic groups (e.g. intra- and inter-specific sequence identity). The identity cutoff for each taxonomic level is then set to be below the lowest intra-specific pairwise identity and, if possible, above the highest inter-specific pairwise identity. The cutoff can never be set to be above 99% identity for any taxonomic level.
Finally, the metaxa2_dbb software can perform an optional database evaluation step, which is further described below. A more thorough description of the database construction process can be found in the software manual (Supplementary Item S1), and an example step-by-step guide is provided as Supplementary Text S1. It should also be noted that to make the Metaxa2 classifier more reliable across a variety of barcoding regions, we have modified the algorithm for assigning reliability scores (see the manual for details; Supplementary Item S1). These modifications in general have very little effect on SSU and LSU classifications, but can nevertheless result in slight differences when the same dataset is classified using this version of Metaxa2 and versions prior to 2.2.
3.1 Automatic correction of taxonomic data
If the user chooses, metaxa2_dbb can attempt to adjust the supplied taxonomy data in order to better match the taxonomic levels to those proposed by the Metaxa2 software (domain, phylum/kingdom, class, order, family, genus, species and strain/subspecies). The phylum level is sorted out first, by checking which input taxonomic level that corresponds to a list of recognized phyla/kingdoms. This is followed by searching for a taxonomic level below the phylum level with an annotation ending with ‘-ales’ to define the order level (unless the entry seems to be of metazoan origin). Then, the class level is defined as the level above the order level, and the family level is defined as the first level below the order level and with an annotation ending with ‘-ceae’ (or ‘-idea’ for metazoans). The species level is identified by finding a taxonomic annotation reminiscent of a Latin binomial. The genus level is lastly defined as the level containing the genus part of the Latin binomial. This procedure can correct the vast majority of inconsistent taxonomic annotation data, although manual curation of the output data is still highly recommended to catch exceptional cases.
4 Software evaluation
We evaluated the metaxa2_dbb software by providing 12 different use cases involving 11 different genetic markers used in different scenarios (Supplementary Table S1). Notably, the datasets used to evaluate the software were not collected for the specific purpose of this evaluation, but were rather typical representatives of reference datasets used in previous or ongoing studies, thereby representing actual use cases for the Metaxa2 Database Builder very well. For the ITS2, matK, rbcL, trnL and trnH genetic markers, references were obtained from Richardson et al. (2017). Briefly, all NCBI nucleotide sequences for vascular plants available on March 4, 2016 were downloaded, filtered by length, and all sequences with >2 sequential uncalled nucleotides were removed. The datasets were then filtered to only contain sequences from plants occurring in Ohio. Taxonomic information were obtained from NCBI Taxonomy (Federhen, 2012). Sequences with undefined taxonomic information at any rank, or unidentified at the species level, were removed. For rpb1, rpb2 and EFalpha, reference sequences were obtained from the fungal six-gene phylogeny of James et al. (2006). Sequence data and taxonomic information was obtained from NCBI. For the 16S rRNA gene, sequences and taxonomic data for type-strains and cultured strains were downloaded from SILVA release 128 (Yilmaz et al., 2014), and SATIVA (Kozlov et al., 2016) was used to remove mislabeled strains. For cpn60, sequences were downloaded from the cpnDB (Hill et al., 2004) on October 21, 2016. The complete nucleotide sequences of group I chaperonins, i.e. cpn60 (also known as hsp60 or groEL), which is found in bacteria, some archaea, mitochondria and plastids, were used for building the database. Two datasets were downloaded, both the FASTA file of all group I sequences and a reduced file with only reference genome representatives. Taxonomic classifications were transferred from SILVA annotation (release 111) and then manually curated. Finally, for ATP9-NAD9, we used a database made with curated sequences including 140 different Phytophthora species/hybrids (GenBank accession numbers JF771616.1 to JF772053.1 and JQ439009.1 to JQ439486.1, and Bilodeau and Robideau (2014); n.b. a total of 123 species are currently described; http://www.phytophthoradb.org).
When sequence and taxonomic data had been obtained for each of these genetic markers, we ran the metaxa2_dbb software on each dataset in the conserved, divergent and hybrid modes. We also enabled the self-evaluation option, which performs a cross-validation of the database performance similar to that of Richardson et al. (2017). For the self-evaluation we used the default settings, which correspond to rebuilding the database 10 times, each time using 90% of the randomly chosen input sequences to build the reference database (the training set) and then subsequently classifying the remaining 10% of input sequences (the testing set) using Metaxa2. The correct and predicted taxonomic classifications were then compared at every taxonomic level, generating measures for sensitivity (proportion of test sequences identified as matching the barcoding region), accuracy (proportion of correctly classified sequences at the taxonomic level in question), and the error per classification ratio (proportion of incorrectly classified sequences per total classifications made). In total, the time taken to build the databases (excluding the self-evaluation) ranged from <1 min for the smallest datasets (<200 sequences) to over 18 h for the largest dataset for which the entire database building process was run (2336 sequences; for the 16S rRNA gene identity cutoffs were not calculated, but instead the default Metaxa2 16S rRNA cutoffs were used). On average, it took around 2 h to build a database, and most of this time was spent calculating appropriate sequence identity cutoffs between the lineages. Supplying pre-computed identity cutoffs dramatically reduced the running times for every dataset tested.
In addition to the software self-evaluation, we also tested the classification performance of the different databases on sequence fragments derived from the sequences used to build the respective database. This evaluation followed the method used for the original Metaxa2 paper (Bengtsson-Palme et al., 2015), although we only generated fragments of a single length—150 nucleotides. The test sets were generated by randomly selecting a stretch of 150 nucleotides from every sequence in the input data for each barcoding region. We then used Metaxa2 version 2.2 to classify these simulated read datasets and calculated the performance for each genetic marker in terms of accuracy (proportion of correctly classified sequence fragments), misclassifications (incorrect assignments), sensitivity (proportion of detected sequence fragments), and over-prediction (assignment to an incorrect taxon due to absence of the correct taxon in the database). Sequence fragments were regarded as correctly classified if their reported taxonomy corresponded to the known taxonomy of the input sequence that the fragment was derived from, at every taxonomic level as reported by Metaxa2. If any incorrect taxonomic affiliations were reported at any taxonomic level, the fragment was regarded as misclassified.
To compare the performance of the software to a more simplistic BLAST search against GenBank, we downloaded all sequences matching the queries ‘matK[TI] AND 100:2000[SLEN]’ and ‘trnL[TI] AND 100:2000[SLEN]’ to create BLAST databases representing the matK (132 954 sequences) and trnL (140 363 sequences) genes. We then used the 150 nt sequence fragments from above and searched those against the respective databases (blastall options ‘-p blastn -m 8 -F F -v 1 -b 1’). We then compared the taxonomic information in GenBank for the query sequence fragments and the database matches.
We finally compared the performance of the hand-curated Metaxa2 SSU rRNA database that is bundled with the software to SSU rRNA databases built by metaxa2_dbb from the sequences in SILVA release 111 and 128 (Quast et al., 2013). The native Metaxa2 database is based on SILVA release 111, which means that the comparison between the native database and release 111 is relevant to understand the differences between the manual and automatic database constructions. The difference to release 128, on the other hand, is rather a test of whether the accuracy changes with the addition of more reference sequences. The SILVA databases were created by downloading the FASTA file representing the reference SSU sequences with 99% non-redundancy (SSURef_Nr99) with taxonomy from SILVA. We then added the SSU sequences for the 12S rRNA used in the native Metaxa2 database from MitoZoa (Bengtsson-Palme et al., 2015; D'Onorio de Meo et al., 2012). From these, we used Metaxa2 version 2.1.2 (default settings) to divide the SSU sequences by taxonomic domain. The resulting files were used as input for metaxa2_dbb, which was run by retaining the HMM profiles from the native database, i.e. only rebuilding the classification database. In all cases, taxonomy correction was used, and cutoffs were manually set to ‘0, 60, 70, 75, 85, 90, 97’ (Bengtsson-Palme et al., 2015). The full options were: ‘metaxa2_dbb -o SSU_SILVAXXX -g SSU -p metaxa2_db/SSU/HMMs/-t SILVA_XXX_SSURef_Nr99_tax_silva.fasta -a archaea.fasta -b bacteria.fasta -c chloroplast.fasta -e eukaryota.fasta -m mitochondria.fasta -n mitozoa_SSU.fasta –correct_taxonomy T –cutoffs ‘0, 60, 70, 75, 85, 90, 97’ –cpu 16’. For each SILVA release, two databases were built, one with the command above, and one in which filtering of taxonomic information was applied, adding the ‘–filter_uncultured T –filter_level 6’ options.
After these new SILVA-based classification databases had been constructed, we classified the simulated SSU read fragments with high-quality taxonomic information used in the original Metaxa2 evaluation, and ran this in the same way as in the original paper (Bengtsson-Palme et al., 2015). The results of the classifications were investigated manually, to make sure that errors made by Metaxa2 were due to actual classification errors and not renaming of taxa, inconsistencies in taxonomy between database versions, synonymous names used for the same taxon, or misspellings. As in the original Metaxa2 paper, a sequence fragment was regarded correctly classified if the reported taxonomy corresponded to the known taxonomy of the input sequence at every taxonomic level, as reported by Metaxa2. If the Metaxa2 classification was found to completely correspond to the known taxonomic affiliation at all investigated taxonomic levels, the sequence fragment was regarded as perfectly classified. If Metaxa2 reported any incorrect taxonomic affiliation at any taxonomic level the fragment was regarded as misclassified.
5 Results and discussion
We evaluated the Metaxa2 Database Builder on 11 different barcoding regions, targeting a variety of uses (Supplementary Table S1). We first assessed the software performance using the self-evaluation function, measured in terms of sensitivity, accuracy and error per assignment rate (Supplementary Fig. S2). In general, we found that at least one of the methods produced >80% correct assignments at the family level for half of the markers (Fig. 1A). However, three of the genetic markers—rpb1, rpb2 and cpn60—consistently showed lower performance across all groups, even at the order level. When we multiplied the proportion of correct assignments with the total proportion of sequences assigned, generating a measure of accuracy, it was clear that the divergent mode consistently was the best performing setting (Fig. 1B). It was therefore chosen as the default operating mode for the Metaxa2 Database Builder. This effect was mostly due to the fact that the divergent mode always included a larger proportion of the input sequences in the final database than the other methods (Supplementary Fig. S3). However, the fact that the divergent mode includes essentially all of the input sequences in the classification database also means that using this mode necessitates more careful manual curation of the dataset used for database creation. In other words, if the data at hand is of uncertain quality, it may still be more adequate to use the conserved mode.
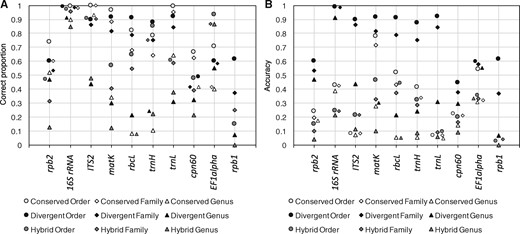
Self-evaluated performance of the Metaxa2 Database Builder. Evaluation was performed in all operating modes (conserved, divergent and hybrid) on 10 different DNA barcoding regions. (A) Proportion of assigned sequences classified to the correct order (circles), family (diamonds) and genera (triangles). (B) Accuracy, i.e. proportion of correctly assigned sequences multiplied with the proportion of sequences included in the final classification databases (see Supplementary Fig. S2). The ATP9-NAD9 genetic marker is not shown, because it only had relevant taxonomic differences at the species level
As an additional performance assessment, we followed the procedure from the original Metaxa2 evaluation (Bengtsson-Palme et al., 2015) and generated fragments of 150 nucleotides from each barcoding region to estimate the performance on shotgun metagenomic data. Here, we found that for most regions, the divergent mode generated the highest proportion of correct classifications (Fig. 2A). For EF1alpha, the hybrid mode performed better, for matK the operating modes were essentially tied, and for ATP9-NAD9 the conserved and hybrid modes were the best performers. However, the divergent mode also produced higher numbers of misclassifications than the conserved mode did for ITS2, matK and rbcL, although the hybrid mode showed the largest numbers of incorrect assignments overall (Fig. 2B). In general, the divergent mode also showed the lowest levels of unclassified input sequences and over-predictions (Fig. 2C and D). We furthermore compared the evaluation of the fragments to the internal software evaluation for each dataset (Supplementary Fig. S4). We found that there was essentially a linear relationship between the classification accuracy in the internal evaluation (i.e. the proportion of sequences included in the database multiplied by the proportion of correctly classified sequences in the internal evaluation) and the proportion of correctly assigned sequence fragments (Supplementary Fig. S4E). This indicates that the accuracy provides a robust measure of overall database performance (see Fig. 1B). Users can also assess the certainty of individual assignments using the reliability scores given in the taxonomy output from Metaxa2 (see manual; Supplementary Item S1).
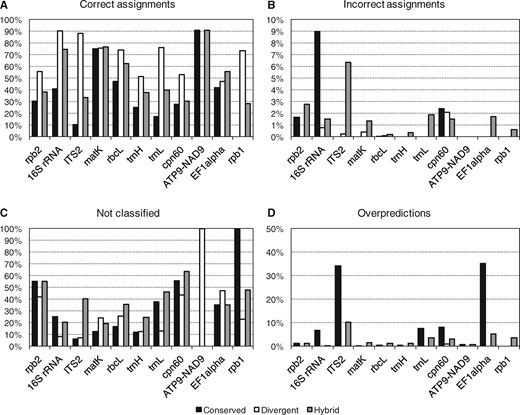
Performance of the Metaxa2 Database Builder on sequence fragments. Family-level Metaxa2 performance on randomly generated 150-nucleotide fragments originating from the sequence datasets used to build the respective databases in the three different modes (Conserved, Divergent and Hybrid). (A) Proportions of fragments assigned to the correct taxonomic family. (B) Proportions of fragments assigned to an incorrect family even though sequences from the correct family were present in the database. (C) Proportions of fragments not assigned, or not recognized as belonging to the investigated barcoding region, at the family level. (D) Family-level overpredictions, i.e. the proportions of sequence fragments belonging to a family not present in the final database, which were still assigned to a (different) family by Metaxa2. The total proportion of erroneous assignments (regardless of type) can be obtained by summing the numbers of incorrect assignments (B) and overpredictions (D). Note that the ATP9-NAD9 dataset is only used for species identification and thus this marker would be expected to show perfect performance on the family level. Note also that the Y-axis scales are different for B and for D compared to A and B
We also compared the performance of the database builder on the 150 nucleotide fragments from the matK and trnL genes to the performance obtained using a simplistic BLAST search against GenBank. We found that the BLAST-based classification gave the correct results for 41.4% of the sequence fragments for matK and for 45.1% of tnrL fragments. By contrast, using the Metaxa2 process described here, 76.5% of matK fragments and 76.2% of trnL fragments were correctly classified.
A key component for the high accuracy of Metaxa2 is the hand-curated classification database (Bengtsson-Palme et al., 2015). For the database builder, we have tried to emulate this process by automating as much of our curation procedure as possible. There are three ways in which the software attempts to improve the taxonomic information. First, it can remove uninformative sequences from unknown specimens or mixed environmental samples. Second, it can make an effort to standardize the input taxonomy into seven levels. Finally, it can also filter out entries without taxonomic affiliation at, for example, the genus or species level. To investigate if these automated steps were sufficient to recreate a database with similar or better performance as the default SSU database included with Metaxa2 (Bengtsson-Palme et al., 2015), we compared the classification performance of the native Metaxa2 database to those resulting from automated construction based on SILVA. Overall, the results were surprisingly similar (Supplementary Fig. S5), contrary to what was previously shown when the native database was replaced with the GreenGenes database (Bengtsson-Palme et al., 2015). Interestingly, there were also rather small differences between the non-filtered and the automatically filtered databases, although applying filtering increased the number of classified sequence fragments with full taxonomic annotation and lowered the proportion of incorrect assignments, particularly at short fragment lengths. This indicates that the automated approach to database building works well, at least when the underlying sequence and taxonomy data are of high quality.
Our evaluation shows that there are obvious differences in performance between different genetic markers. Particularly, it seems to be difficult to build appropriate models for the rpb genes and cpn60, at least based on the sequence data we have used. This means that it is crucial to carefully select the most suitable operating mode. The divergent mode is intended for barcoding regions for which fairly large sequence variability between the target taxa, such as the eukaryotic ITS region (Nilsson et al., 2012), the trnH gene used in plant barcoding (Richardson et al., 2017) and the COI gene used, e.g. for insects (Hebert et al., 2003b). The conserved mode, on the other hand, is suitable for barcoding regions that are highly conserved among the target taxa, such as the SSU rRNA genes (Hartmann et al., 2010) and the bacterial rpoB gene (Dahllöf et al., 2000). In addition, this mode is advisable for certain barcoding genes used in narrower taxonomic groups, such as Oomycota. Finally, while the hybrid mode utilizes approaches from both the other methods, it also combines their drawbacks and should therefore only be used when none of those produces satisfactory results. Although in our evaluation the divergent mode seems to produce the best results in most instances, there were large differences in performance between the genes. Depending on what the user values the highest (comprehensiveness, stringency, precision etc.), different settings would be desirable (Figs 1 and 2; Supplementary Fig. S2). Therefore, the user is advised to test several combinations of modes and filtering options and evaluate them against each other to find the optimal settings for each barcoding region and reference dataset. Our goal is to include only the highest quality reference databases in the Metaxa2 database repository, and we ask that users perform these evaluation steps in the interest of getting as reliable results as possible from their data.
Evaluations of which taxonomic classification tools show the most consistent performance in terms of sensitivity and specificity are still largely incomplete (Bengtsson-Palme, 2018), particularly for non-standard barcoding regions. We believe, however, that this lack of comprehensive evaluation does not excuse the use of methods that produce incorrect or irrelevant results. The combination of classification based on both hidden Markov models and sequence alignments sets Metaxa2 apart from other software commonly used for taxonomic assignment of non-rRNA barcodes, such as the RDP Naïve Bayesian Classifier (Wang et al., 2007), Rtax (Soergel et al., 2012) and UTAX (Edgar, 2010), which have all been shown to perform subpar or inconsistently in different settings. For example, Rtax often had high proportions of misclassifications, UTAX provided genus assignments for only about a quarter of the input sequences, and the RDP classifier often only assigned a small fraction of the input sequences when used on short fragments of marker genes (Bengtsson-Palme et al., 2015; Porter and Hajibabaei, 2018; Richardson et al., 2017). In addition, when used with non-rRNA barcodes, they all showed a substantial trade-off between accuracy and sensitivity. In the context of the 16S rRNA gene, Metaxa2 has been shown not to suffer from this relationship to the same extent as other classifiers (Bengtsson-Palme et al., 2015). Since the Metaxa2 database builder vastly extends the capabilities of Metaxa2 to virtually any high-quality DNA barcode in use, the software may bring more precise taxonomic classification to genes other than the SSU and LSU rRNA, including the COI gene commonly used for metazoan DNA barcoding (Hebert et al., 2003a). Furthermore, the implied high quality of the automatically built databases facilitates regular updates of the Metaxa2 SSU and LSU databases, making it easier to keep them up to date with the increasingly rapid generation and release of reference sequences. With decreasing cost of DNA sequencing and increasing use of shotgun metagenomics for studies of biological communities, we believe that these updates to the Metaxa2 software will enable a leap forward for molecular ecologists and others in need of precise taxonomic assignment among groups of taxa that are not feasibly targeted by traditional barcoding markers.
Acknowledgement
The authors would like to thank Prof. Christer Erséus for input on the International Code of Zoological Nomenclature.
Funding
This work was supported by the Swedish Research Council for Environment, Agricultural Sciences and Spatial Planning (FORMAS) [grant numbers 2016-768 to J.B.P., 2012-86 to K.M.E., 215-2011-498 to R.H.N.]; and a Project Apis m. - Costco Honey Bee Biology Fellowship to R.T.R.
Conflict of Interest: none declared.
References

