


Abstract
Studies on gene clusters proved to be an excellent source of information to understand genomes evolution and identifying specific metabolic pathways or gene families. Improvements in sequencing methods have resulted in a large increase of sequenced genomes for which cluster annotation could be performed and standardized. Currently available programs are developed to search for specific cluster types and none of them is suitable for a broad range of user-based choices. We have developed ClusterScan which allows identifying clusters of any kind of feature simply based on their genomic coordinates and user-defined categorical annotations.
The tool is written in Python, distributed under the GNU General Public License (GPL) and available on Github at http://bit.ly/ClusterScan or as Docker image at sangeslab/clusterscan: latest. It is supported through a mailing-list on http://bit.ly/ClusterScanSupport.
Supplementary data are available at Bioinformatics online.
1 Introduction
A ‘genomic cluster’ commonly indicates a group of genes sharing genomic location and belonging to a common category such as involvement in the same pathway (Barona-Gómez et al., 2004; Yu et al., 2000), function (Hourcade et al., 1992), co-expression (Sémon and Duret, 2006), binding or cellular localization (Jamieson et al., 2004) to name a few. This definition may not only suit a group of genes but also any group of genomic features that can be categorically and positionally described. With the decreasing costs of sequencing technologies new genomes can be produced even in small laboratories and the identification of clusters of features could represent a valuable analysis to be adopted as a standard annotation step. There are different tools capable to identify clusters on a given genome (Cimermancic et al., 2014; Cruz-Morales et al., 2016; Khaldi et al., 2010; Li et al., 2009; Medema et al., 2011; Röttig et al., 2011; Starcevic et al., 2008; Umemura et al., 2013; Vesth et al., 2016; Wolf et al., 2016; Yi et al., 2007). They are generally specialized to identify a given type of cluster and use algorithms which take into account the specific organization of the cluster they search for. In addition, many of them have been developed for bacterial genomes (Chavali and Rhee, 2017). In order to overcome these limitations we developed ClusterScan, a generalistic tool to identify clusters, allowing flexibility in the choice of features and categories. The tool identifies clusters of genomic features close on the genome and associated to the same category. Both the positional and categorical information are user defined using a tabular format allowing the user to search for any kind of cluster such as PFAM domains, GO classifications, SNPs, conserved regions, binding sites, transposable elements and so on.
2 Implementation
ClusterScan is developed in Python and makes usage of bedtools (Quinlan and Hall, 2010) for positional analysis and R for plotting. It requires in input a tab delimited text file with genomic coordinates of the features to analyze and a file annotating the given features according to one or more categories. To identify clusters, the tool searches, for each category, groups of features sharing the same annotation and location. It produces several output files storing clusters coordinates and composition as well as a list of bystanders for each cluster, if any, and singletons if required. The minimal number of features in a cluster and maximal distance between them are user configurable and the search strategy can be chosen between two different algorithms (Fig. 1a).
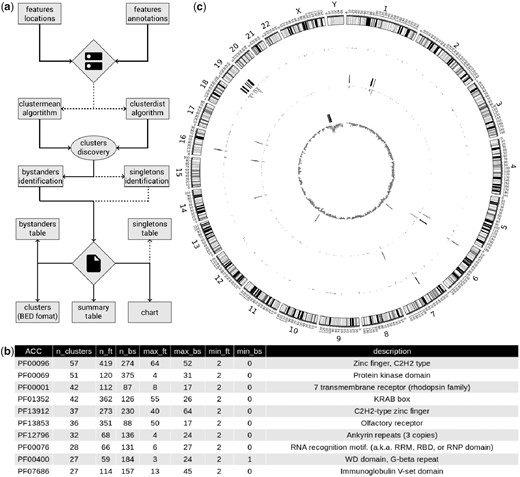
(a) ClusterScan pipeline scheme. (b) ClusterScan summary table. Top-10 PFAM domains in clusters. The table shows, for each domain, the total number of features (n_ft) and bystanders (n_bs) in clusters, maximum and minimum number of features (max_ft and min_ft) and bystanders (max_bs and min_bs). The ZnF domain (PFAM: PF00096) is the one defining the higher number of gene clusters in the human genome. (c) Circos representation of human top-10 clusters for ZnF genes, tRNAs and FlnI-L1 retrotrasposons. From outer to inner: the first track represents the locations of the 10 larger ZnF clusters; the second track represents the locations of the 10 larger tRNA clusters; the third track represents the locations of the 10 larger FlnI-L1 clusters; each track is associated with an inside oriented histogram which displays the number of features of each type in bins of 1 Mb
3 Materials and methods
ClusterScan can use two different algorithms to identify clusters: clusterdist and clustermean. Clusterdist searches for clustered features belonging to the same category which are separated by a maximum distance. This distance is selected by the user with the –distance parameter. For example, studies based on gene families in human (Niimura and Nei, 2003) and mouse (Tadepally et al., 2008) have estimated that members of the same gene family within 500 kb can be considered to form a cluster. The second method, clustermean, splits the genome in sliding windows of user-selected size using the –window parameter, performs counting of categories and a Z-score statistics with a final extension step. Following clusters identification, ClusterScan identifies bystanders, those features contained within a cluster not associated to the category for which the cluster has been called. If requested, ClusterScan can also identify singletons, features belonging to a category, for which at least one cluster is annotated, that are outside of any cluster for that category.
4 Results
We have tested ClusterScan searching for clusters of human protein coding genes from Ensembl (Aken et al., 2017) categorized by their PFAM (Finn et al., 2014) domain annotations. Gene locations (chromosome, start and end) and categorical annotations (PFAM domains), were easily obtained through BioMart (Kinsella et al., 2011). ClusterScan took 160 s to run clusterdist with –distance set to 500 kb, analyzing the locations of 19 919 unique protein-coding genes annotated with 6056 PFAM domains, resulting in the annotation of 2287 clusters from 1010 PFAM composed by at least 2 genes. As expected, ClusterScan results show that the domain forming the highest number of clusters is the C2H2 zinc finger (C2H2 ZnF) domain (PFAM: PF00096, Fig. 1b) and the largest group of these clusters is located on chromosome 19 in agreement with Grimwood et al. (Grimwood et al., 2004) (Fig. 1c). Analyzing the same dataset using clustermean with a window of 500 kb, took 746 s resulting in 2364 significant clusters from 1030 PFAM domains. In order to test our tool with different sets of data, we downloaded the human tRNA gene table in bed format from GtRNAdb (Chan and Lowe, 2016) and the full length non-intact L1s (FlnI-L1s) retrotransposons table from L1Base2 (Penzkofer et al., 2017). To search for tRNA clusters we used clustermean with a window size of 500 kb finding 17 clusters. The top-10 clusters in terms of number of features result to be composed by at least 10 tRNAs (Supplementary Table S1). The search for FlnI-L1s clusters was performed using clustermean again with the same parameters. We have found 435 clusters, 38 of them containing at least 10 FlnI-L1s and 8 clusters showing 20 or more elements (Supplementary Table S2). The top-10 clusters in terms of number of features found with ClusterScan for the three analysis discussed above, are depicted in a circos (Krzywinski et al., 2009) (Fig 1c). Finally, we performed a survey among commonly used tools to identify genomic clusters and found that ClusterScan is the only tool able to build clusters of any mappable feature, for any type of category and also capable to identify bystanders and singletons (Supplementary Table S3).
5 Conclusions
ClusterScan is a generalistic tool capable of identifying genomic clusters of any type of feature in a given genome. It is highly configurable, distributed on Github and as a Docker image, extensively documented and complemented by a mailing list to support the user community. These features make ClusterScan a tool easily adoptable in bioinformatics pipelines for genome annotations, establishing the possibility to adopt clusters identification as a standard procedure.
Funding
Massimiliano Volpe was supported by a SZN PhD fellowship.
Conflict of Interest: none declared.
References

