


Abstract
Gene annotation and pathway databases such as Gene Ontology and Kyoto Encyclopaedia of Genes and Genomes are important tools in Gene-Set Test (GST) that describe gene biological functions and associated pathways. GST aims to establish an association relationship between a gene-set of interest and an annotation. Importantly, GST tests for over-representation of genes in an annotation term. One implicit assumption of GST is that the gene expression platform captures the complete or a very large proportion of the genome. However, this assumption is neither satisfied for the increasingly popular boutique array nor the custom designed gene expression profiling platform. Specifically, conventional GST is no longer appropriate due to the gene-set selection bias induced during the construction of these platforms.
We propose bcGST, a bias-corrected GST by introducing bias-correction terms in the contingency table needed for calculating the Fisher’s Exact Test. The adjustment method works by estimating the proportion of genes captured on the array with respect to the genome in order to assist filtration of annotation terms that would otherwise be falsely included or excluded. We illustrate the practicality of bcGST and its stability through multiple differential gene expression analyses in melanoma and the Cancer Genome Atlas cancer studies.
The bcGST method is made available as a Shiny web application at http://shiny.maths.usyd.edu.au/bcGST/.
Supplementary data are available at Bioinformatics online.
1 Introduction
Gene expression profiling platforms have enabled researchers to explore complex human diseases on an ever larger scale. As our knowledge of disease mechanisms increases, there is a greater need for more targeted and reproducible analysis requiring ever more sensitive expression platforms for clinical biomarkers. A boutique array platform is well-suited to tackle these challenges because the built-in probes are specially designed for the disease of interest. Depending on manufacturer designs, these probes can measure signals with greater sensitivity than other platforms such as microarray and RNA-Seq. This increase in sensitivity is typically achieved by reducing the number of probes to those directly relevant to the disease of interest, which increases the signal-to-noise ratio during competitive hybridization.
However, this reduction in the number of probes also brings new challenges to traditional pre-processing tools and statistical analyses (Jung and Sohn, 2014). Specifically, many bioinformatics and statistical techniques have been developed for the purpose of biological discovery and these are not appropriate for targeted platforms like boutique arrays. One such example is the gene-set over-representation test, commonly referred to as Gene-Set Test (GST), originally developed for microarray experiments (Irizarry et al., 2009; Subramanian et al., 2005). In GST, instead of interpreting genes directly, these genes are mapped to biologically meaningful annotations in curated biological databases. Then, by applying appropriate statistical tests, statistical significance is assigned to the annotation terms instead of specific genes. Typically, genes that are differentially expressed (DE) are of particular interest in GST because these genes are potential biomarkers which could inform us of the underlying disease mechanisms if their association with biological functions and pathways can be established.
When performing GST on boutique arrays, one often ignored issue is that the probes built onto the gene expression profiling platform do not necessarily match with the gene-set database that is of interest. For example, most GST databases, such as Gene Ontology (GO) (Consortium, 2000), were built with the whole human genome in mind. As a result, the intended gene universe when performing GST is the whole genome, or at least, a genome-wide gene expression profiling platform. The particular challenge for boutique arrays is that boutique array genes are specialized by design, and thus in much smaller quantity (ranging from 100 to a maximum of 1000 probes) compared to the whole genome. Statistical testing of annotation terms is therefore restricted to genes on the boutique arrays. We refer to this issue as gene-set selection bias. While there was a tremendous amount of research into making evermore advanced methods and accessible web-based tools (Backes et al., 2007; Eden et al., 2009; Subramanian et al., 2005; Wu et al., 2010; Zheng and Wang, 2008), there is always an implicit assumption that end-users use a large gene expression profiling platform in experiments. In light of this, there is a need to develop a GST methodology which can produce interpretable gene-set enrichment analysis results in the presence of gene-set selection bias.
This paper presents a bias-corrected GST, abbreviated as bcGST, a novel method that enables the application of GST in the absence of large parts of the genome, as we typically encounter in boutique arrays. Using a published microarray and the Cancer Genome Atlas (TCGA) RNA-Seq data, we create synthetic simulations of boutique array to examine the advantages and practicality of bcGST. The bcGST method corrects for the gene-set selection bias effect by reducing false negatives during scoring gene-set significance. We further demonstrate bcGST’s ability to yield stable GST results in the presence of gene-set selection bias. Application of bcGST to a real boutique array study and a TCGA RNA-Seq data revealed key cancer pathways despite low concordance between the two platforms. We also developed a Shiny (Chang et al., 2017) web application for the bcGST method. This application enables the detection and exploration of gene-sets through interactive visualization and adjustments.
2 Materials and methods
2.1 Datasets
2.1.1 Microarray melanoma data
A published gene expression study (Schramm et al., 2013) from stage III melanoma patients was used to illustrate our methods. The platform used was Illumina Human WG-6 BeadChip microarray, version 3. In this study, a good prognosis group (n = 25) was defined as those samples with more than four years survival with no sign of relapse and a poor prognosis group (n = 22) as those samples that died within one year of metastasis. Raw data were processed using the NEQC method (Shi et al., 2010). Negative control probes were used for background correction and quantile normalization used both negative and positive probes. The normalized data has 23 460 probes, corresponding to 17 934 unique gene symbols.
2.1.2 TCGA cancer gene expression data
TCGA RNA-Seq expression and clinical information (Weinstein et al., 2013) were downloaded using the R (R Development Core Team, 2017) package ExperimentHub (Maintainer, 2016) from Gene Expression Omnibus with submission ID GSE62944, on October 11, 2016. The voom method available in the limma (Ritchie et al., 2015) package together with the trimmed mean of M values was used to normalize RNA-Seq count data so the processed data could be analyzed using available microarray analysis methodologies (Law et al., 2014).
There were 23 368 genes across all 19 cancers. We used this pan-cancer data in two ways. First, for the purpose of creating simulated boutique array experiments, patients with either tumour status or vital status missing were discarded. Differential gene expression analysis was performed between good prognosis patients who were both tumour-free and alive, against poor prognosis patients who carried tumours and died. Under this classification, cancers with <10 samples in either prognosis groups were eliminated. Second, for the purpose of demonstrating our method on a real boutique array dataset, we selected from the TCGA data the Skin Cutaneous Melanoma (SKCM) patients with American Joint Committee on Cancer (AJCC) tumour stage classification.
2.1.3 NanoString customized panel
This is a customized gene expression profiling panel containing 800 genes designed to cover a broad spectrum of melanoma biology, immune-related genes, cellular functions and signalling pathway transcriptional targets. See Supplementary Table S3 for a complete list of genes. Similar to other boutique array panels, the manufacturer argues that due to gene co-expression, a well-designed boutique array can measure gene expression with a smaller set of probes and is expected to capture a significant amount of expression variability (NanoString Technologies, 2015).
Due to the non-negligible differences between how microarrays, RNA-Seq and NanoString collect signals from their respective panels (Chen et al., 2016; Guo et al., 2013; Nookaew et al., 2012; Robinson et al., 2015), we used this panel in two different ways. First, for the purpose of creating simulated boutique array experiments, we are only interested in the induced biological knowledge that the NanoString genes bring to the analysis. Hence in all simulations, we only used the NanoString gene symbols to subset genes from the larger platforms, namely the microarray and RNA-Seq data described above. Second, we used the gene expression profiles of 95 samples from a study of the effect of targeted therapy and immunotherapy for BRAF-mutant patients in melanoma (Silva et al., 2017). Normalization was performed using the NanoStringQCPro package (Nickles D et al., 2017) with content normalization.
2.2 Simulated boutique array experiments
Given the microarray and TCGA RNA-Seq data, we took the subset of NanoString PanCancer panel genes to construct smaller datasets which resemble data collected from boutique array experiments. We will refer to these sub-datasets as ‘simulated boutique arrays’ or just ‘simulations’ because they contain gene expression measurements for specialized gene-sets without actually performing the experiments. Such simulations allowed for a higher degree of control for our proposed correction method and eliminate possible experimental inconsistencies. No further normalization or data processing was performed on the simulations. During the evaluation, the original inference results from the larger platforms (i.e. microarray and TCGA RNA-Seq) were treated as the gold standard against which inference results from the simulations are compared.
The first experiment was simulated with respect to the Stage III microarray, in which there were 663 genes common to both platforms. The second experiment was simulated with respect to the TCGA RNA-Seq data, with 775 genes common to both platforms, across all cancer types. All samples were retained during construction of the simulations.
2.2.1 Differential expression and GO analysis
We used empirical Bayes moderated t-test statistics (Smyth, 2004) implemented in the limma package from R (R Development Core Team, 2017) to perform differential gene expression analysis between patient groups in each dataset.
In the simulation studies, microarray experiment genes with a P-value <0.01 were considered as DE. For the TCGA data, genes with a P-value <0.005 were considered as DE. These thresholds were chosen to yield a reasonable number of DE genes so that we have a reasonable mapping of annotation terms. In the microarray experiment, we obtained 322 DE genes out of 11 698 genes. Only 38 of these 322 DE genes were present on the NanoString panel. We discarded TCGA cancer datasets with fewer than five DE genes on the simulated boutique array, the full list of which are on Supplementary Table S1a.
In the real data application, differential gene expression analysis was performed between patients who were classified as AJCC Stage IVC and those samples in either Stage IVA, IVB or IIIC (pooled). We used a less conservative P-value of 0.05 on both the NanoString and the TCGA SKCM RNA-Seq data as a cut-off for a gene to be considered DE. Supplementary Table S2 shows a list of samples.
In the simulation study, DE genes were then mapped to the GO database via Entrez ID. Enrichment tests and further parameter extractions were all performed through topGO package (Alexa and Rahnenfuhrer 2016). We considered only the ontology branch ‘Biological Processes’ of the GO database, keeping only terms with at least 10 annotated genes. In the simulation, we only retained GO terms common to both the microarray and the NanoString platform. In the real data application, we used the BioCarta pathway downloaded from the Molecular Signatures Database from Broad Institute, version 6.0 (Liberzon et al., 2011; Subramanian et al., 2005).
2.3 Gene-set enrichment analysis
2.3.1 Fisher’s exact test parameters
We used Fisher’s Exact Test (FET) to test for over-representation of DE genes with the GO annotation terms. Under the null hypothesis that relative proportions of one gene-set are independent of a second gene-set, parameters on a two-by-two contingency table follow a hypergeometric distribution, so a P-value can be calculated based on this distribution.
To clarify the relationships between boutique array genes, DE genes and genes assigned to pathways, we have tabulated the number of genes in each category in Tables 1 and 2.
Contingency table of boutique array genes, split according to if these are differentially expressed and assigned to a given pathway
| Boutique array gene universe | DE | Not DE |
|---|---|---|
| Pathway | a | b |
| Not pathway | e | f |
| Boutique array gene universe | DE | Not DE |
|---|---|---|
| Pathway | a | b |
| Not pathway | e | f |
Contingency table of non-boutique array genes, split according to if these are differentially expressed and assigned to a given pathway
| Non-boutique array gene universe | DE | Not DE |
|---|---|---|
| Pathway | c | d |
| Not pathway | g | h |
| Non-boutique array gene universe | DE | Not DE |
|---|---|---|
| Pathway | c | d |
| Not pathway | g | h |
In a FET, we refer to all genes under consideration as the ‘gene universe’. Depending on the gene expression profiling platform being used, the gene universe will change accordingly. For example, if we wish to make inference only within a boutique array, then we simply take the gene universe to be the boutique array. Equation (1) computes the one-sided FET P-value, where numbers (a, b, e and f) are defined in Table 1, for each pathway under consideration. If the whole genome is the gene universe, then the P-value is calculated using Equation (2), where the numbers (a + c, b + d, e + g and f + h) are shown in Table 3. As most curated biological annotation databases like GO and Kyoto Encyclopaedia of Genes and Genomes were developed with respect to the whole genome, it is therefore important to know which gene universe is under consideration. Misspecifying the gene universe as the boutique array genes when the whole genome is intended can induce gene-set selection bias into GST, see Figure 1.
Contingency table of all genes in a genome-wide gene universe, split according to if these are differentially expressed and assigned to a given pathway
| Genome-wide gene universe | DE | Not DE |
|---|---|---|
| Pathway | a + c | b + d |
| Not pathway | e + g | f + h |
| Genome-wide gene universe | DE | Not DE |
|---|---|---|
| Pathway | a + c | b + d |
| Not pathway | e + g | f + h |
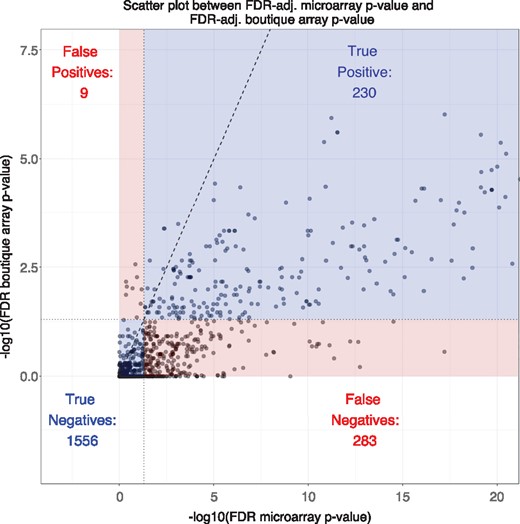
A scatter plot of 2078 Gene Ontology (GO) terms common to both the microarray data and the simulated boutique array data. The x- and y-axes are the FDR-adjusted FET P-values from the microarray and simulated boutique array on a scale, respectively. A total of 1519 out of 2078 (73%) points are below the line of no change (y = x, black dashed line). By dividing the figure at FDR-adjusted P-values <0.05 for both gene universes, we can further confirm the majority of false decisions made by FET P-values came from false negatives
2.4 FET P-value grid and bcGST
For a gene-set of interest, the first ratio α represents the proportion of DE genes on the boutique array compared to all DE genes in the genome present in the pathway. Similarly, the second ratio β represents the proportion of DE genes on the boutique array compared to all DE genes in the genome absent from the pathway. These two ratios represent different proportion of DE genes built onto the boutique array in relations to the gene-set. See Results for a more detailed application of these two ratios.
If the values of (alpha) and (beta) are known, then we can compute estimates (rounded to the nearest integer if necessary) of the unobserved c and g parameters through and , respectively. The number of DE genes can then be estimated with and the value a + b+c + d can be obtained from curated pathway database, thus completing the contingency table in Table 3. In the process of doing so, we calculated a FET P-value by taking into account the missing genes on the boutique array, and thus this process would allow us to correct for the gene-set selection bias in a boutique array GST.
However, when performing a real boutique array experiment the precise value of α and β is never known. We thus propose a visualization-inspired technique to evaluate the FET P-value over a grid of α and β values. The rationale behind this grid construction is that a higher value of α and β means more DE genes was built onto the boutique array, these proportions represent the severity of gene-set selection bias for each pathway term. If the P-value associated with a pathway is always significant regardless of α and β, then we can conclude its initial statistical significance was not likely to be driven by these proportions and thus the gene-set selection bias. Thus, we may conclude the statistical significance is robust against this bias.
To perform this computation, we will first define a range of plausible values for α and β, which can be as large as , where either parameter can take any value between 0 and 1. For each (α, β) pair on this grid, we can calculate unknown FET contingency table parameters as described above, thus obtaining a grid of FET p-values.
To simplify interpretations, we propose to further summarize the FET P-value grid into a single statistic. For each pathway or annotated term, a natural way to condense this grid information is to count the number of times which the P-value fall below a pre-determined significance threshold. This defines a grid count statistic, and we can thus consider a pathway to be robust against the induced gene-set selection bias if this count statistic is high when compared to the size of the αβ grid. The bcGST method we are proposing consists of both the grid of P-values and the grid count statistic.
3 Results
3.1 Gene-set selection bias presents a unique challenge to GST in boutique array experiments
Gene-set selection bias is a particularly challenging problem for boutique arrays. A large proportion of genes and their associated pathways/annotation terms are left out due to the design of the boutique array and so the parameters in Table 2 will be completely ignored in the analysis. Statistical significance of annotation terms is therefore biased towards the genes on the boutique arrays due to selection bias. This bias is present even in the case of well-designed boutique arrays. See the Materials and methods section for the detailed statistical formulation of the selection bias problem.
Figure 1 shows a scatter plot comparing FET P-values from the Stage III melanoma microarray experiment and simulated NanoString boutique array for 2078 common GO terms. Here we regard the microarray P-values as the ‘truth’ against which we compare the simulated boutique array P-values. The simulated boutique array FET provided correct decisions for most GO terms. There is strong monotonicity between the P-values derived from the two gene universes as we should expect from a specialized cancer gene panel. While a change in statistical significance was anticipated, 1519 (73%) GO terms exhibited a larger P-value. Furthermore, the majority of false decisions originated from false negatives; i.e. GO terms which were significant in the underlying microarray, but failed to be judged as significant in the simulation. Our bcGST method addresses this issue of gene-set selection bias.
3.2 P-value correction is needed to account for selection bias in boutique arrays
In practice, depending on the gene expression profiling platform being used, its gene universe should change accordingly. For example, in an Affymetrix array, the built gene-set covers the whole genome most of the time. However, if we wish to analyze with a boutique array, then the gene universe for the boutique array is much smaller in comparison. In reference to Table 1, the gene universe has a total of a + b+e + f, the sum of all the parameters in the contingency table. In the case of the NanoString platform, the collection of genes is at most 800 genes. Performing a GST directly in the latter case will result in biased P-value calculations. To this end, we developed the bcGST correction method to account for such selection bias.
The bcGST method relies on the two key ratios defined in Equation (3) which represent different proportion of DE genes built onto the boutique array in relations to the gene-set. If these ratios are known either from a pilot study or from the end-users, then we can easily correct for the gene-set selection bias. For example looking at GO: 0023014, signal transduction by protein phosphorylation, had a P-value of 0.24 in the simulation above. Let α and β take values, 0.35 and 0.10, respectively; i.e. the boutique array captures 35 and 10% of DE genes present and absent from the microarray. Then we can find and , which are estimates of the unobserved parameters c and g in a typical boutique array experiment. These estimates allow us to complete a FET contingency table. Thus, a plausible bias-corrected P-value from our GST analysis is 0.003 instead. Note that this correction depends strongly on the selected (assumed but unknown) values of α and β.
3.3 The bcGST method corrects for false negatives for unknown α and β
We propose to use bcGST, a three-step-grid-based approach to examine the statistical significance of annotation terms when the α and β ratios are unknown. First, we consider a range of α and β values, thus constructing a grid. Second, for each pair of ratios, we complete the contingency table and perform FET for each (α, β) pair. This yields a grid of P-values. Third, by counting the number of P-values that fall below a certain level of statistical significance, we construct a count statistic which can better assess the statistical significance of annotation terms. We use the bcGST approach to correct for statistical significance as a result of gene-set selection bias and we will refer to the grid count statistic as the ‘bcGST statistic’.
Figure 2 shows a heatmap of P-values for GO: 0044711 (single-organism biosynthetic process) and GO: 0023014 (signal transduction by protein phosphorylation). Under a conventional significance level of 0.05, both of these terms would be judged as non-significant. If we use an equally spaced (α, β) grid of size 400 to compute the grid count statistic, i.e. counting the number of grid points that have an associated FET P-value <0.05, we obtain bcGST statistic value of 157 for GO: 0044711 and 353 for GO: 0023014, respectively. Since a comprehensive range of α and β values were considered, the almost 2-fold difference in the bcGST statistics between these two GO terms provides a good indication that the latter is more likely to be considered significant in a genome-wide microarray. This is indeed the case, the microarray P-value for GO: 0044711 is 0.230 and the P-value for GO: 0023014 is 0.005. This is one example where our bcGST statistic successfully prevents false negative conclusion (for GO: 0023014).
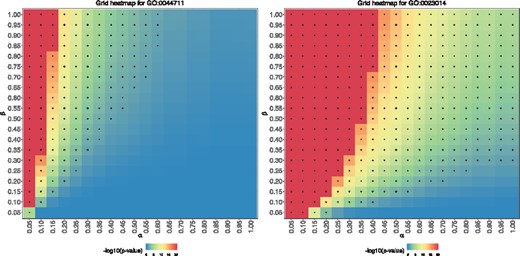
A pair of GO terms with similar simulated boutique array FET P-values, but noticeably different microarray FET P-values and bcGST statistics. The heatmaps are on a scale, capped at 20 for ease of reading. Grid points with a P-value <0.05 are marked with a ‘+’ symbol. (Left) GO: 0044711, single-organism biosynthetic process, microarray P-value =0.23, simulated boutique array P-value =0.43, bcGST statistics =157/400. (Right) GO: 0023014, signal transduction by protein phosphorylation, microarray P-value =0.005, simulated boutique array P-value =0.24, bcGST statistics =353/400
Figure 3 is similar to Figure 1 but all GO terms are now coloured by grouping the bcGST statistic into four low-count/high-count categories. We note that 82% of false negatives received moderately high (>300 grid points) or very high counts (>350 grid points). The high bcGST statistics provide evidence for these GO terms from being incorrectly judged as non-significant. Thus, this count statistic supplements the boutique array FET results in overcoming the problem of false negatives caused by gene-set selection bias.
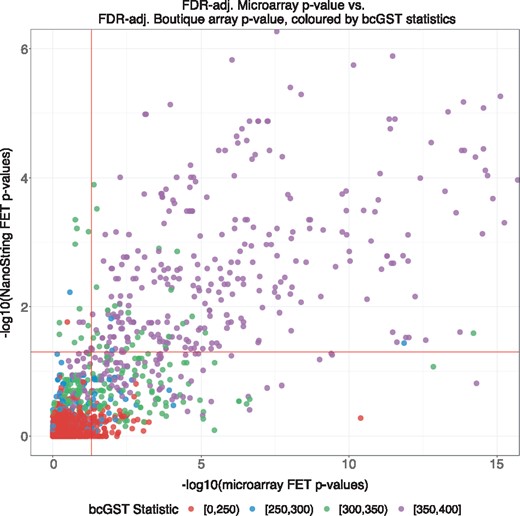
Colouring the previous scatter plot with four categories of low to high grid count statistics. We have significantly increased detections of GO terms in the false negative (lower right) region; 244 out of 283 (86%) GO terms had bcGST statistics higher than 300 out of a 400 αβ grid cells. The high count categories of bcGST statistics supplement the singular boutique array P-values with an extra layer of interpretability on the annotation terms’ stability across a range of possible α and β values
3.4 GST results are sensitive to two highly variable key ratios
If we are given a pair of α and β, then we can complete a FET contingency table using the genome or some genome-wide gene expression platform as the gene universe. However, each estimate of the (α, β) pair only assumes one plausible level of gene-set selection bias. By running a boutique array simulation on the TCGA data, we show that inference results are very sensitive to these two ratios and that both ratios are difficult to estimate. Hence, a single estimate of these ratios does not yield stable results. This (α, β) induced instability is avoided through the proposed gird-based approach in bcGST.
3.4.1 Heterogeneity of α
First, by considering running the boutique array simulation on a set of the TCGA gene expression data, we can show that α is highly heterogeneous within and between different cancer datasets. Figure 4 shows the distribution of both α and β ratios for 2219 common GO terms between 11 cancers. The parameter α is highly variable within individual datasets, indicated by the upper boxplot tails extending towards one and a large number of zeros. Despite having an overall median around 0.14 across all cancer datasets, the boxplots show that the distribution of α values also differ between cancers. Such variability makes estimating α for every GO term difficult, and therefore statistical conclusions will be more prone to errors.
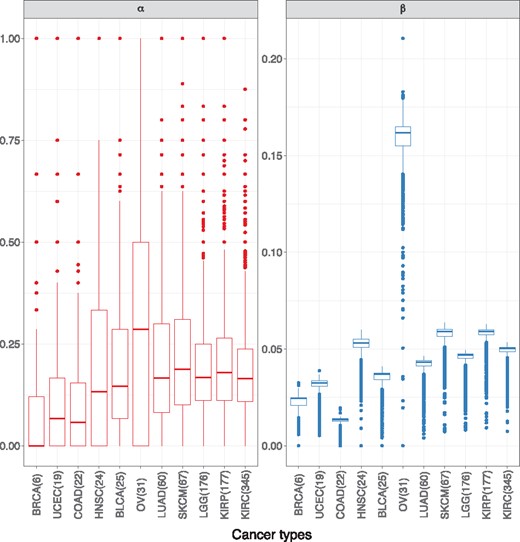
Boxplots of α and β for 11 different cancers, using a simulated boutique array on the TCGA data. The cancers are ordered by number of DE genes on the simulated boutique array. We observed high stability for β across different cancers (except ovarian cancer) and α is much more heterogeneous within each cancer. This suggests the estimation of α will be difficult both within and between different cancers. Thus we should expect a grid-based approach to be more flexible in accommodating its instability and also robust against disease heterogeneity
3.4.2 Sensitivity of β
The ratio β also has a strong overall influence on the FET P-value. We can examine this by further studying the simulated boutique array results on the SKCM data in TCGA.
Figure 5 is a ‘spaghetti’ plot of P-values for all GO terms. By fixing four selected β values, we can see the collective change of all GO terms across different values of α. The general trend of P-values is very sensitive to small changes in β, particular for smaller α values; which we know from Figure 4 is a particular feature of α. This is to be expected since even though the range of β is smaller than that of α, the construction of β involves the parameter g, which is the number of non-boutique array DE genes absent from pathways—a number which we expect to be large in applications. Small changes to this parameter will tend to produce very different estimates for other parameters.
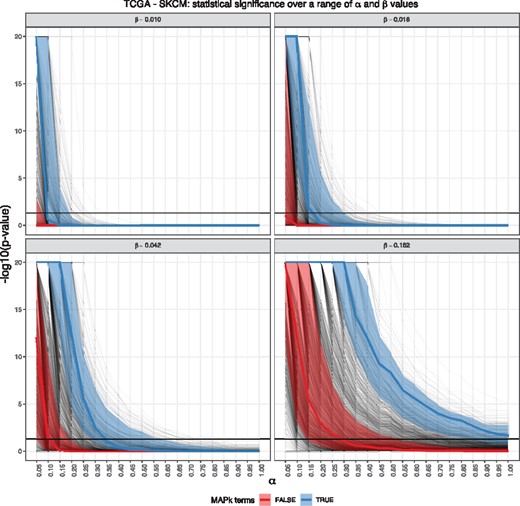
Each panel in the figure holds a β value fixed. α is on the x-axis, and of the P-value is on the y-axis. Each faint black line in the diagram represents a GO term, with the thick black horizontal line respond to the threshold. The β grid points were chosen to be equally spaced over 0.01 (β value for COAD in TCGA simulation) and 0.16 (β value for OV in TCGA simulation). We note the MAP kinase-associated GO terms held their statistical significance across all values α for all values of β, a feature which we consider to be robust against gene-set selection bias
3.4.3 Biological significance
Figure 5 contains special features that enhance biological significance as follows. First, we selected four β values obtained from the TCGA cancer datasets, ranging from the cancer of lowest median β value (COAD) to the highest median β value (OV). This provides us with a realistic expectation of the range of β in cancer studies which we could use in future visualization heatmaps and computation of bcGST statistics. Second, over this selected range of β, we split the GO terms into those which are associated with MAP kinase (blue) and those which that are not (red). We computed the median of each grouped GO terms for each α value and also shaded the 25th percentile and the 75th percentile band for each group. Since the MAP kinase pathway is known to be associated with melanoma, we expect the GO terms associated with MAP kinase to be statistically significant across all α, for all selected β values, when compared to the rest of GO terms. We observed this trend in this plot, thus affirming these MAP kinase-associated terms retained higher their statistical significance than the rest of GO terms, and hence we can conclude these are robust against changes in both α and β. This figure allows us to see how P-values of a particular term (or a group of terms) changes with respect to other terms, under a range of possible gene-set selection bias.
3.5 bcGST statistic outperforms non-bias-corrected P-values as a classifier
While the bcGST grid count statistic has the ability to supplement non-bias-corrected P-values from a boutique array to recover false negatives induced by gene-set selection bias on a boutique array; it can also be used as a classifier in itself to determine the significance of annotation terms. Similar to how receiver operating characteristic (ROC) curves are constructed, classification can be achieved by setting an appropriate threshold on the counts, with those pathways exceeding this threshold being judged as significant.
Figure 6 shows the ROC curve for the bcGST statistic and the FDR-adjusted FET P-values in our simulated boutique array. bcGST statistic is able to achieve similar true negative rate with a much lower false negative rate compared to simulation. This ability to reduce false negatives makes the count statistic strongly competitive against the conventional FET P-value approach on top of its robustness to bias.
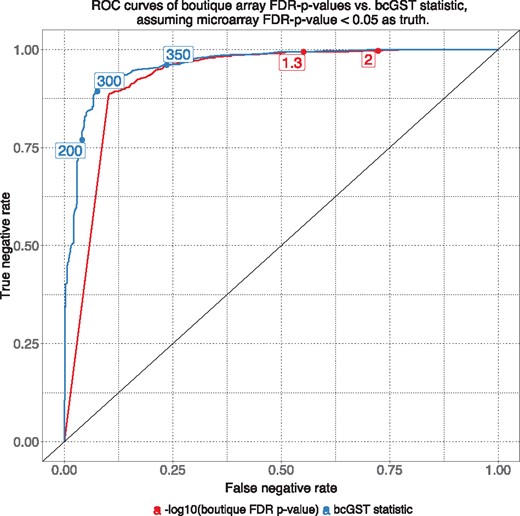
Setting the FDR-adjusted, FET P-value with gene universe being the Stage III melanoma microarray <0.05 as truly significant, we can compare the performance of classifiers at different threshold points. As smaller P-values indicate higher level of significance, we used scale for comparison against the count statistic. The grid count statistic (blue) clearly outperformed the FDR-adjusted FET P-value (red curve) at various labelled threshold points. The two managed a similar level of true negatives with the former achieving a noticeable reduced false negative rate
3.6 Application to real boutique array data revealed meaningful biological results
Focusing on a comparison of BRAF mutants in a real melanoma NanoString data and the TCGA-SKCM data, we were able to show the value of our method. First, we can see that in practice, the concordance of P-values on two different platforms is not guaranteed to be strong as evident in Supplementary Figure S2. This reaffirms the need for a correction method in the space of pathway enrichment analysis. Our grid count statistic is able to add extra insights into how stable the pathway results are. Using the same αβ grid of 400 on the Molecular Signature Database (Subramanian et al., 2005), we showed that, attaining high bcGST count statistic value for a number of pathways is possible despite low significance on either platform. Some of these pathways include well-known pathways such as the MAPk, ERK and EGFR pathways, see Supplementary Table S3.
3.7 A Shiny-based application enables interactive visualization of adjusted-GST results for boutique array
The bcGST statistics is dependent on choices of:
(α, β) grid resolution
P-value significance threshold and
number of significant grid points to qualify for robustness against gene selection bias.
While we believe providing a strict reference manual for these parameters is unrealistic and prohibitive, we note the following:
Both the grid resolution and the P-value significance threshold do not significantly alter the behaviour of the bcGST statistics, merely rescale the number of counts. See Supplementary Figures S6 and S7.
The selection of a bcGST statistics threshold is more dynamic and data-dependent. Through experimentation with the TCGA data using a grid size of 400, we found most data reaches the maximum accuracy and the F1 statistics with a bcGST threshold about 300–350.
These recommendations are data-dependent, thus, we provide a Shiny application to assist with the exploration of data. Users can upload their own boutique array dataset, change and choose parameters accordingly to visualize the effects on the final pathway analyses. The application is available at http://shiny.maths.usyd.edu.au/bcGST.
4 Discussion
The widespread use of boutique arrays has improved sensitivity of gene expression measurements in addition to its relatively lower cost compared to platforms such as genome-wide RNA-Seq profiling. These arrays has advantages in both prediction and prognostic assessment for patients. However, researchers should also be aware of the risk of applying methodologies developed for similarly-purposed profiling platforms onto boutique arrays without justification and modification. Here, we evaluated the use of FET, a classical tool in gene-set enrichment analysis in a boutique array platform and proposed a grid count statistic that adjusts the over-representation P-value for boutique array GST interpretation.
The bcGST statistic allows us to examine the stability of P-values for each annotation term over different levels of induced gene-set selection bias. For each annotation term, each count represents a statistically significant conclusion, assuming a particular level of gene-set selection bias in a boutique array experiment. A higher bcGST statistic therefore implies the statistical significance will be stable across different levels of bias, and thus the significance is less likely to be driven by the gene-set selection induced in the construction of the boutique array.
The gene-set selection bias issue is not unique to boutique array platforms. The main issue in this context is that statistical tools like the FET are only interpretable with respect to the correct underlying gene universe. For example, with the mass spectrometry platform in proteomics studies, where the technology was shown to only capture up to 84% of the total annotated protein-coding genes in humans (Kim et al., 2014). The effects of gene-set selection bias on this platform remain to be explored.
The bcGST grid count statistic depends on the number of grid points and the spacing between the grid points. Due to the heterogeneity of α over the interval , choosing equal spacings is one possible natural choice. Typically, the values associated with constructing β is much larger in magnitude, thus we recommend to construct the grid over a more restricted interval with equal or non-linear spacing. Being aware of this issue should allow us to take note of more drastic changes in inference results. Such changes were observed in Figure 5 with comparing the β = 0.01 panel, where the slopes of a majority of GO terms were large relative to three other panels of β.
It is well demonstrated in the literature that different normalization methods can yield wildly different and incomparable results (Dillies et al., 2013; Law et al., 2014). In practice, normalization on a boutique array has additional analytic challenges due to the small number of genes. In the interest of generating more comparable results, we did not perform any additional normalization on the simulated data after we subset the boutique array genes from the microarray and the RNA-seq platforms. This enables us to put a greater focus on the effect of boutique arrays as opposed to the effect of normalization. In practice, the effect of normalization will be combined with gene-set selection bias as normalization methods typically utilizes additional information from non-expressed genes or control probes. This combination of effects will add extra challenge to adjustment methods.
5 Conclusion
Gene-set selection bias is a significant issue with boutique array technology. Such bias is expected to affect the downstream analysis and appropriate adjustment methods are required to derive valid results. When performing GST on the boutique array data, we propose a grid-based evaluation technique, bcGST, along with a count statistic that is robust against the gene-set selection bias, to provide interpretable visualizations which outperform a conventional P-value approach. Meaningful biological results were obtained when applied to real world data. A Shiny application is available to facilitate interactive visualization of the results.
Acknowledgements
We thank the Sydney Bioinformatics and Biometrics group for useful feedbacks and suggestions. The results shown here are in part based upon data generated by the TCGA Research Network (http://cancergenome.nih.gov/).
Funding
KYXW is supported by the Australian Postgraduate Award. AMM and JSW are both supported by Cancer Institute New South Wales Early Career Fellowships. JSW is also supported by a National Health and Medical Research Council Early Career Fellowship. RAS and GVL are both supported by National Health and Medical Research Council Practitioner Fellowships. SM and JYHY are both supported by an Australian Research Council Discovery Project Grant DP170100654. JYHY is also supported by National Health and Medical Research Council Career Developmental Fellowship. Part of this research is also funded by National Health and Medical Research Council Program Grant No. 1093017, Genentech, Melanoma Institute Australia, the Royal Prince Alfred Hospital and Westmead Hospital.
Conflict of Interest: M.W. is an employee of Genentech, and a stockholder of Roche and ARIAD Pharmaceuticals. Y.Y. is an employee of and share owner of Roche and Genentech. RK has served on Advisory Boards for GSK, Novartis, Merck, and BMS and has received educational travel support from BMS and Amgen.
References
NanoString Technologies,I. (
R Development Core Team (

