


Abstract
Given the complexity of genome regions, prioritize the functional effects of non-coding variants remains a challenge. Although several frameworks have been proposed for the evaluation of the functionality of non-coding variants, most of them used ‘black boxes’ methods that simplify the task as the pathogenicity/benign classification problem, which ignores the distinct regulatory mechanisms of variants and leads to less desirable performance. In this study, we developed DVAR, an unsupervised framework that leverage various biochemical and evolutionary evidence to distinguish the gene regulatory categories of variants and assess their comprehensive functional impact simultaneously.
DVAR performed de novo pattern discovery in high-dimensional data and identified five regulatory clusters of non-coding variants. Leveraging the new insights into the multiple functional patterns, it measures both the between-class and the within-class functional implication of the variants to achieve accurate prioritization. Compared to other two-class learning methods, it showed improved performance in identification of clinically significant variants, fine-mapped GWAS variants, eQTLs and expression-modulating variants. Moreover, it has superior performance on disease causal variants verified by genome-editing (like CRISPR-Cas9), which could provide a pre-selection strategy for genome-editing technologies across the whole genome. Finally, evaluated in BioVU and UK Biobank, two large-scale DNA biobanks linked to complete electronic health records, DVAR demonstrated its effectiveness in prioritizing non-coding variants associated with medical phenotypes.
The C++ and Python source codes, the pre-computed DVAR-cluster labels and DVAR-scores across the whole genome are available at https://www.vumc.org/cgg/dvar.
Supplementary data are available at Bioinformatics online.
1 Introduction
Whole-genome sequencing (WGS) is becoming the standard strategy to uncover the full spectrum of the variants across the genome. Analysis of WGS data poses great challenges given the sheer amount of variants, in particular, the rare ones, as well as our poor understanding of the functionality of non-coding genome (Drubay et al., 2018; Khurana et al., 2016; Li et al., 2017). Many of the functional variants (predominantly located in the non-coding genome) are associated with the disease or complex traits (Shihab et al., 2015; Zhang and Lupski, 2015). However, discoveries from genome-wide association studies (GWAS) revealed that a large number of disease-causing variants remain to be discovered, the vast majority of which is believed to play regulatory roles in modulating the activity of target disease genes (Ritchie et al., 2014; Zhou and Troyanskaya, 2015).
Various large-scale studies, such as ENCODE (Skipper et al., 2012), Roadmap Epigenomics (Bernstein et al., 2010) and FANTOM5 (FANTOM Consortium and the RIKEN PMI and CLST et al., 2014), have been utilized to facilitate the understanding of the regulatory roles of the non-coding genome across multiple human tissues and cell types. The activities of regulatory elements (REs) left footprints in various functional genomics data, making it possible to infer the function of the non-coding genome from the massive-scale resources. Diverse experimental assays used in these projects can help dissect the function of REs, including histone modifications, ChIP-seq for transcription factors (TFs) (Consortium, 2011), chromatin accessibility (DNase-seq) (Thurman et al., 2012) in ENCODE and Roadmap Epigenomics and Cap analysis of gene expression (CAGE) in FANTOM5. In parallel, footprints in genome evolutions assayed by various computation approaches, e.g. GERP++ (Davydov et al., 2010), phastCons (Siepel et al., 2005), phyloP (Cooper et al., 2005), SiPhy (Garber et al., 2009), LINSIGHT (Huang et al., 2017), provide complementary evidence in inferring the functional importance of regulatory variants. Given the complexity of the regulatory mechanisms, however, it is seldom the case that any individual data are adequate for the inference of the underlying function. Instead, integrating multiple and complementary data is necessary to achieve a better understanding of the regulatory mechanisms.
Recently, with the integration of much more annotation data over multiple tissues and cell types, numerous approaches have been developed to evaluate the potential functional effects of non-coding variants. Most of these approaches are based on machine learning or statistical methods [e.g. CADD (Kircher et al., 2014), GWAVA (Ritchie et al., 2014), DANN (Quang et al., 2015), Eigen (Ionita-Laza et al., 2016)]. The models underlying these methods (support vector machine, random forest, deep neural network and non-parametric statistics model) are all designed to handle the complex and high-dimensional data to prioritize variants and have notable advantages. A potential limitation of these methods is that they were built upon a two-class assumption that non-coding variants fall into two categories [CADD, GWAVA and DANN are supervised methods which learned from the pathogenic or benign labeled variants catalog; Eigen is an unsupervised method which does not need the labels of the data but also follows the two-class assumption (Ionita-Laza et al., 2016)]. However, the regulatory mechanisms of non-coding variants are so complex that it is difficult to sharply divided variants into benign or pathogenic categories (Ionita-Laza et al., 2016), which may cause these methods to ignore the small functional effects of variants in the complex traits.
It is shown that non-coding variants play distinct regulatory roles in various REs, including well-established REs such as promoters, enhancers, silencers, insulators, as well as other REs that are unknown (Narlikar and Ovcharenko, 2009). The chromatin states analysis studies (Hoffman et al., 2013; Roadmap Epigenomics Consortium et al., 2015) suggested that there are multiple chromatin states across the genome, likely corresponding to distinct REs. This evidence suggested that we can more fully evaluate the functional effects of non-coding variants with the hypothesis that they can be divided into multiple regulatory categories according to the genomic evidence. However, due to our lack of understanding of the regulatory mechanism of non-coding variants, exploring the functional patterns among non-coding variants remains a challenge since we even do not know how many different patterns exits in these variants. Furthermore, even we have already identified distinct functional patterns, we lack a method to evaluate the functional effects of the variants across different patterns with continuous annotation scores.
In order to address these challenges, in this study, we developed a novel non-coding variant annotation framework, DVAR (de novo pattern discovery and prioritization of functional VARIANTS), to overcome the two-class limitation of existing state-of-the-art models. In essence, the DVAR framework consists of two major components: DVAR-cluster and DVAR-score. DVAR-cluster automatically identifies the number of functional clusters discovers inherent patterns from high-dimension genomics data, and then predicts the regulatory potential of non-coding variants. Specifically, we use Dirichlet Process Mixture (DPM) model (Ferguson, 1973) to explore the patterns of complex and correlated feature space, without the need for any prior knowledge of functional elements. In this step DVAR essentially builds multi-class labels across all of the non-coding variants. We also developed DVAR-score to evaluate the functional importance of each variant based on the clustering labels. To reveal finer scales of patterns, we included a large set of genomics data spanning a variety of categories to incorporate complementary information. We constructed a variety of test sets (Clinvar, fine-mapped GWAS hits, GTEX eQTLs and MPRA verified variants) to demonstrate that DVAR outperforms state-of-the-art scoring methods in various scenarios. Furthermore, we collected a set of causal variants which have been verified by genome-editing technologies to prove that DVAR is able to detect disease causal variants. Finally, we applied DVAR to BioVU (Denny et al., 2013) and UK Biobank (Petersen et al., 2013), two large-scale DNA biobanks linked to complete electronic health records (EHRs) to explore the effectiveness of DVAR in prioritizing non-coding variants with EHR derived phenotypes.
2 Materials and methods
2.1 Feature extraction
Within the DVAR framework, each variant is annotated with an 887-dimensional feature vector. The annotation features were extracted from biochemical marks and conservation scores. We used six ChIP-seq Histone modifications marks (H3K4me1, H3K4me3, H3K9ac, H3K27ac, H3K27me3, H3K36me3) and DNase-seq data from 127 epigenomes of Roadmap (Bernstein et al., 2010) as well as 18 ChIP-seq Histone modifications from ENCODE (Consortium, 2011). We also collected four types of conservation scores include PhastCons (Siepel et al., 2005) (primates, mammals, vertebrates), PhyloP (Cooper et al., 2005) (primates, mammals, vertebrates), GERP++ (Davydov et al., 2010) (NR score and RS score) and SiPhy (Garber et al., 2009). CpG island state makers were downloaded from the UCSC genome browser (Kent et al., 2002). In addition, CAGE peaks, permissive enhancers, robust enhancers predicted by CAGE in FANTOM5 project (Lizio et al., 2015) and super-enhancers predicted across a broad range of human cell types (Hnisz et al., 2013) were also included. TF binding sites peaks across ENCODE and Roadmap data were downloaded from Ensembl Regulation database (Zerbino et al., 2015), the distance of the variant to the nearest annotated transcription start site (TSS) is also a feature in our framework. Finally, we collected all the regions involved in chromatin interactions detected by 3C, 4C, 5C, Hi-C and Capture-C from 4DGenome dataset (Teng et al., 2015). In total, we used 887 annotation features in this study, including histone modifications (685 values), TF binding (133 values), DNase (53 values), CAGE peaks (3 values), super-enhancers (1 value), TSS distance (1 value), CpG island markers (1 values), chromatin interactions (1 value) and conservation scores (9 values).
2.2 Feature pre-processing
Where xmin and xmax are the min and max value of the feature vector over the training dataset. We used the transformed x of each variant as the input to the DPM model.
2.3 DVAR-cluster
2.4 DVAR-score
2.5 Benchmark datasets
We collected four test datasets that consist of distinct functional variants supported by different sources of evidence: (i) a set of 2713 disease variants from ClinVar (Landrum et al., 2016) catalog (version 20170130, pathogenic non-coding variants extracted); (ii) a set of fine-mapped causal non-coding variants from GWAS Loci [1867 candidate causal variants with PICS probability >10% from 39 immune and non-immune phenotypes from a previous study (Farh et al., 2015)]; (iii) a set of 1184 variants involving high-confidence single nucleotide polymorphism (SNP)-gene associations from GTEx V6p dataset (GTEx Consortium et al., 2013) and (iv) a set of 250 functional variants investigated by massively parallel reporter assays (MPRS) (Tewhey et al., 2016). We used the area under the curve (AUC) statistic of receiver operating characteristic (ROC) curves and precision-recall (PR) curves to indicate the performance. For controls, by default, we constructed negative datasets by randomly selecting variants from the 1000 Genomes (filtered with MAF >0.05). In order to prove that the advantage of DVAR-Score is stable, we also construct the region-matched dataset and the imbalanced dataset from the 1000 Genomes Data with more stringent criteria: (i) the negative samples are region-matched with positive samples (Ionita-Laza et al., 2016) that any of the non-functional variants are located within 100 kb of a functional variant; (ii) the dataset is to be imbalanced that the number of negative samples is 10 times that of positive samples (Ritchie et al., 2014). We primarily focused on using the PR curves with the AUC value (AUCPR) to evaluate the performances in the following comparisons since we have imbalanced datasets. We compared our framework with four state-of-art methods which were based on the two-class assumption: CADD (Kircher et al., 2014), GWAVA (Ritchie et al., 2014), DANN (Quang et al., 2015) and Eigen (Ionita-Laza et al., 2016).
3 Results
3.1 Interpretation of the clustering of the non-coding variants
The unsupervised training process of DVAR (Section 2) was carried out on ∼ 2 million variants randomly sampled from the 1000 Genomes Phase 3 data. After the training, we found that the input variants automatically grouped into five clusters (see Supplementary Note S1). We arbitrarily labeled the five clusters as C1–C5, and assigned each variant to one of the clusters by selecting the cluster with the highest posterior probability. The sizes of the clusters (i.e. proportions of variants occupied) are ∼47.61, 19.87, 17.85, 9.05 and 5.59%, respectively, for C1–C5 (Supplementary Fig. S1a). Note that the results are derived from our training variants, and to see the robustness of the discovered patterns we resampled another 2 million variants as the testing data. Due to the different settings of random seeds, the variants in the training set and the testing set are completely different. Inspiring, we still observed that the testing data can be automatically divided into five categories by DVAR. Furthermore, we used the model built in the training set to predict the variant in the testing data and assigned each variant to C1–C5 according to the predicted maximum posterior probability of the cluster membership. The proportions of the clusters assigned for variants in the testing data are remarkably close to the corresponding sizes in the training set, with the sizes of clusters C1–C5 being 47.92, 19.55, 18.18, 8.97 and 5.35% (Fig. 1a), demonstrate that these five patterns are ubiquitous in the sea of non-coding variants. We reported the other analysis results based on the testing dataset in the main text to avoid overfitting and the results on the training data can be seen in Supplementary Note S3 (The analysis results on these two datasets are consistent).
![Different genomics patterns of DVAR-clusters C1∼C5 in 2 000 000 non-coding variants randomly sampled from the 1000 Genomes Project. (a) The percentage of each cluster of the non-coding variants. (b) The distributions of DVAR-scores of non-coding variants in different clusters. (c) Enrichment of DVAR-clusters with gene-based regions: Splice, 3′ UTR, 5′ UTR, Enhancer, Promoter Intron and Intergenic region, extracted from UCSC database. The darkness of the blue color indicates the relative enrichment with darker blue representing higher significance [−10log10 (Fisher exact P-value)] and vice versa. (d) Enrichment with chromatin states of GM12878 cell line identified by ChromHMM. (e) The boxplot of the numbers of active epigenomes in DVAR-clusters C1-C5 across 127 Roadmap epigenomes. (f) The boxplot of the numbers of active tissue-groups in DVAR-clusters C1∼C5 across 15 Roadmap tissue-groups (Color version of this figure is available at Bioinformatics online.)](https://oup.silverchair-cdn.com/oup/backfile/Content_public/Journal/bioinformatics/35/9/10.1093_bioinformatics_bty826/2/m_bioinformatics_35_9_1453_f1.jpeg?Expires=1716408427&Signature=iwiZxQ6~T3o76HHmFWKqB1XbZHOkhPRA6dCdcdOzQF-ubEDrhSbFeVWWDed1vTuL-f1N3rtNoSneXKiJAFh4yxGJOJrTaFZTaGJ293dHt~XteiVUi2xb2z6YRTv3UbxACTvWVCjHAETi-PJ~p7Ajj3IMR~DIdVQDVtVQ8j3OyaNG7YS6NPbu0JqN7f-OIUuQaFwTti~OXb1PKCeo7uz7nmQXBAi9JbXAR~se2KnQseO-R4w2TMMfwDSmaL3AyUhAEoEkYm~IF0bdbTVuRobarBXAMcQiDYu3HIGXurJ1HN6bwKP0TekseKPUqqfXT6fpwGLyfe0gug7vOYDTJp2bCg__&Key-Pair-Id=APKAIE5G5CRDK6RD3PGA)
Different genomics patterns of DVAR-clusters C1∼C5 in 2 000 000 non-coding variants randomly sampled from the 1000 Genomes Project. (a) The percentage of each cluster of the non-coding variants. (b) The distributions of DVAR-scores of non-coding variants in different clusters. (c) Enrichment of DVAR-clusters with gene-based regions: Splice, 3′ UTR, 5′ UTR, Enhancer, Promoter Intron and Intergenic region, extracted from UCSC database. The darkness of the blue color indicates the relative enrichment with darker blue representing higher significance [−10log10 (Fisher exact P-value)] and vice versa. (d) Enrichment with chromatin states of GM12878 cell line identified by ChromHMM. (e) The boxplot of the numbers of active epigenomes in DVAR-clusters C1-C5 across 127 Roadmap epigenomes. (f) The boxplot of the numbers of active tissue-groups in DVAR-clusters C1∼C5 across 15 Roadmap tissue-groups (Color version of this figure is available at Bioinformatics online.)
Leveraging the discovered clusters, we obtained DVAR-scores for all variants and observed distinct distributions of the scores in different clusters (Fig. 1b and Supplementary Table S2). With the DVAR-score method, the functionality of each cluster is comparable and it is gradually enhanced from C1 to C5, with the corresponding median functional scores of 0.242, 0.590, 0.670, 0.876 and 0.933 for C1–C5. The striking differences among clusters imply that variants in different clusters are very likely to have distinct functions.
We next investigated the correspondence of C1–C5 with the well-established gene-based annotations, i.e. ‘Intergenic’, ‘Intron’, ‘Enhancer’, ‘Promoter’,‘UTR3’, ‘UTR5’ and ‘Splice’ (Fig. 1c and Supplementary Table S3). We found that variants in the Intergenic regions are strongly enriched in C1 and C3 while the Intron variants are significantly associated with C2 and C4. Most of the functional elements like 3' and 5‘ UTRs, enhancers and promoters are consistently ordered into clusters C4 and C5, indicating that these two clusters are more likely to be functional. We also found that variants in the splicing-associated regions are mainly enriched in cluster C5 (Fisher’s exact test, P-value = 1.42e−15) and variants in Intron regions are mainly enriched in cluster C4 (Fisher's exact test, P-value <2.22e−308). All of the evidence suggests that clusters C1–C5 show different patterns, corresponding to distinct REs with varying functionality potentials.
We then evaluated how segmentation annotations derived from integrated functional genomics data correspond to cluster C1–C5. Specifically, we applied a 15-state ChromHMM (Roadmap Epigenomics Consortium et al., 2015) across GM12878 cell line and used the segmentation results for the enrichment analysis (Fig. 1d and Supplementary Table S4). The largest cluster C1 showed enrichment only for the quiescent state (E15) (Fig. 1d). The cluster C2 is enriched for E4, E5, E6, E8 and E9, most of which are active REs (strong/weak transcription, genic enhancers, ZNF genes, etc.). The repressed state E9, which consists of constitutive heterochromatin, is mainly enriched in cluster C2. The cluster C3 is enriched for E7, E9, E13, E14, most of which are repressed states (heterochromatin, repressed/weak repressed polycomb proteins). We found that three important functional active states: E1 (Active TSS), E2 (Flanking active TSS) and E3 (TF at 5' or 3' UTR) are only enriched in clusters C4 and C5, indicating that these two clusters are likely to be functional. Furthermore, C4 is enriched in all of the active states (E1–E8), while C5 is not enriched in E4–E6 (Tx, TxWk, enhG) that located in genic regions. All of the repressed states except quies are enriched in C5.
We next examined the relationship between tissue/cell-type specificity of epigenomics data and the clusters C1–C5. We first focused on cell-type specificity and extracted 738 cell-type specific annotations for the 127 Roadmap epigenomes. We denoted a variant as ‘active’ for the target epigenome if more than 50% biochemical assays of the variant in that epigenome are marked active. We found that C1–C5 show different numbers of active epigenomes (Fig. 1e, Supplementary Table S5): Clusters C4 and C5 harbor variants that are active in multiple epigenomes (median =7 and 10, respectively), while the majority of variants in C1–C3 do not have epigenomes activity (median =0). We were further wondering whether the multiple active epigenomics in C4 and C5 are in related tissues. To test that, we grouped the cell types into 17 tissues according to the grouping by the Roadmap Epigenomics (‘IMR90’, ‘ES cell’, ‘iPSC’, ‘ES-deriv’, ‘Blood &T cell’, ‘HSC &B cell’, ‘Mesench’, ‘Myosat’, ‘Epithelial’, ‘Neurosph’, ‘Brain’, ‘Adipose’, ‘Muscle’, ‘Heart’, ‘Smooth muscle’ and ‘Digestive’). We denoted a variant as active in the target tissue if it has no <50% active epigenomes in that tissue. We found that the majority of non-coding variants classified into cluster C4 and C5 are active in one particular tissue (median =1), while the majority of variants in other clusters are not active in any tissue (median =0), demonstrating DVAR’s capability to group variants with related tissue-specificity.
Based on the analysis on the sufficiently large set of variants, DVAR identified five distinct but stable patterns. In general, clusters C1 denote the background data that should be non-functional while C2 denote the likely non-functional variants in the Intron regions; C4 enriched for chromatin active states and C5 enriched for conservative chromatin repressed states. Of particular interest is C3 since it is uncertain and enriched for the intergenic regions which are always mysterious and almost unexplored.
3.2 DVAR automated scoring of functional non-coding variants
Another important feature of DVAR is its ability to calculate functional effect scores of non-coding variants based on the learned functional patterns. We aimed to evaluate how well DVAR can predict non-coding variants that are associated with human diseases or gene expression across a range of testing scenarios (see Section 2).
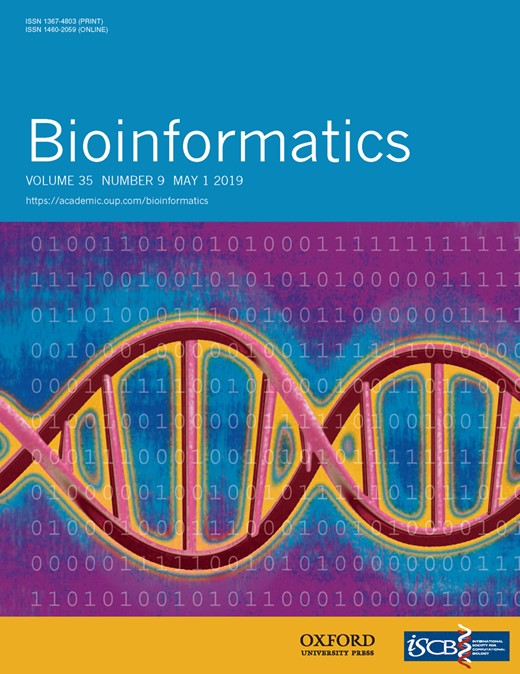
On the ClinVar dataset, DVAR achieved the best performance (AUCPR = 0.981), compared to DANN, Eigen, CADD and GWAVA (Fig. 2a). The AUCs of most other methods like DANN and GWAVA were stable over 0.9 on ClinVar dataset, suggesting that the vast majority of ClinVar non-coding variants are strong signals which have highly distinctive biochemical activities or evolutionary conservation scores. DVAR also achieved the most accurate performance (AUCPR = 0.683) at Fine-mapped-GWAS dataset, followed by GWAVA (AUCPR = 0.659), Eigen (AUCPR = 0.613), CADD (AUCPR = 0.574) and DANN (AUCPR = 0.522), demonstrating DVAR’s performance on functionally annotating disease-causing variants for complex traits (Fig. 2b). The prediction scores of DVAR were the most informative for GTEx eQTLs (AUCPR = 0.725), with 8.8 ∼ 19.5% absolute performance improvement over GWAVA (AUCPR = 0.637), Eigen (AUCPR = 0.620), CADD (AUCPR = 0.567) and DANN (AUCPR = 0.530), showing the improved accuracy of DVAR in prioritizing variants that regulate gene expression (Fig. 2c). We next evaluated the power of DVAR to correctly detect expression-modulating variants assessed by MPRA experiments. We found that DVAR accurately predicted regulatory variants in MPRA dataset (AUCPR = 0.804) and performed substantially better than the other methods (Eigen with AUCPR = 0.715, GWAVA with AUCPR = 0.690, CADD with AUCPR = 0.635 and DANN with AUCPR = 0.626) on this dataset (from 8.9 to 17.8% absolute improvement, Fig. 2d).
Performances of DVAR and other computational methods including CADD, GWAVA, Eigen and DANN for (a) prioritizing clinically significant variants (Clinvar database), (b) fine-mapped trait related variants (fine-mapped GWAS CatLog), (c) eQTL variants (GTEx-eQTL) and (d) MPRA validated functional variants
To have a more comprehensive view of the performance of all methods, we first calculated the AUCs of ROC (AUCROC) on the four testing datasets examined. The performance improvement of DVAR over other methods was still maintained on all of the scenarios (Supplementary Fig. S2). We next conducted the performance comparison of the region-matched dataset and imbalanced dataset. We found that although the AUC values are shown to be decreased (Supplementary Figs S3 and S4), DVAR-Score still maintains a leading position among all the competitors.
We next compared DVAR with more recent methods: LINSIGHT, DeepSea and Eigen-PC on the default dataset. (Supplementary Fig. S5). DVAR achieves the highest AUCPR in three out of four datasets and is close to the best in the ClinVar dataset.
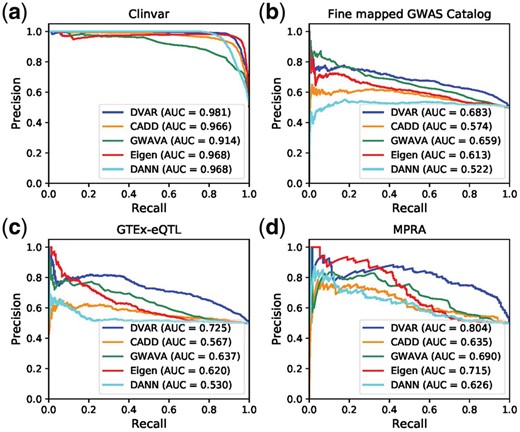
Since we have verified the accuracy of DVAR-score, we next explore the genome regions and segmentation states again with DVAR-score. It is clear that the regulatory regions/segmentation states can be clearly distinguished by our scoring method (Fig. 3a and b). The regulatory regions with top DVAR-scores are Splice, Enhancer and Promoter, which showed somewhat more functionally important than intron and intergenic regions. The chromatin states with top DVAR-scores are TssBiv, BivFlnk and EnhBiv (E10-E12), which are all repressed states with even higher scores than active states like TssA, TssAFlnk and TxFlnk (E1–E3), suggesting that variants in repressed states of ChromHMM have potential to significantly modify gene expressions.
The distribution of DVAR-scores across different regulatory elements (REs). (a) DVAR-scores grouped by gene-based regions. (b) DVAR-scores grouped by 15-chromatin states of ChromHMM on GM12878 cell
3.3 Cases study of functional variants revealed by genome-editing methodologies
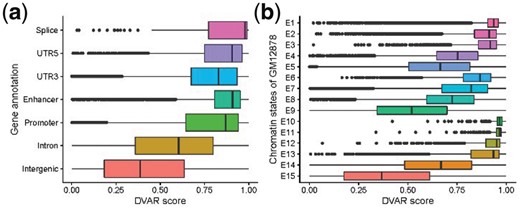
We further assessed DVAR’s performance on the identification of causal variants of complex traits that were functionally validated by genome-editing techniques like Clustered Regularly Interspaced Short Palindromic Repeats (CRISPR). We searched the literature and identified nine functional variants validated by genome-editing systems: rs1421085 (Claussnitzer et al., 2015), rs737092 (Ulirsch et al., 2016), rs1175550 (Ulirsch et al., 2016), rs1546723 (Ulirsch et al., 2016), rs339331 (Spisak et al., 2015), rs56069439 (Lawrenson et al., 2016), rs1800734 (Liu et al., 2017), rs2595104 (Ye et al., 2016), rs200996365 (Pattison et al., 2016). We evaluated how well DVAR and other methods are able to identify the functional effects of these non-coding variants. DVAR successfully prioritize all of them with scores over 0.95 (Table 1). We observed that six out of the nine variants achieved the peak value around their nearby regions (Supplementary Fig. S6). The predicted scores of DVAR, CADD, DANN, Eigen and GWAVA are also shown in Supplementary Table S6. For all of the validated variants, we used PCA to facilitate the visualization of the high-dimensional genomics data (Fig. 4).
Visualization of DVAR feature aberrations for genome-editing validated causal non-coding variants and the mean of background variants. PCA is used to project the high-dimensional annotation data to the 2D space
Summary of variants validated by genome-editing technologies
| ID | Target genes | Traits | Class* | Score* |
|---|---|---|---|---|
| rs737092 | RBM38, RAE1 | Red blood cell | C4 | 0.9536 |
| rs1175550 | SMIM1, LRRC47, CEP104 | Red blood cell | C4 | 0.9509 |
| rs1546723 | CD164, FOXO3, FIG4 | Red blood cell | C4 | 0.9517 |
| rs1421085 | IRX3, IRX5 | Obesity | C4 | 0.9976 |
| rs339331 | RFX6 | Prostate cancer | C1 | 0.9820 |
| rs56069439 | ANKLE1 | Breast cancer | C5 | 0.9702 |
| rs1800734 | DCLK3 | Colorectal cancer | C5 | 0.9512 |
| rs2595104 | PITX2c | Atrial fibrillation | C5 | 0.9711 |
| rs200996365 | CCNE1 | Bladder cancer | C5 | 0.9856 |
The class labels and scores are calculated with DVAR-cluster and DVAR-score.
For the well-known obesity and T2D associated FTO variant, CRISPR-Cas9 editing identified rs1421085 as a causal variant, which leads to gain of function and doubles the expression of genes IRX3 and IRX5 through disrupting the conserved ARID5B repressor motif (Claussnitzer et al., 2015). Indeed, the functional effect of rs1421085 is elusive since it plays regulatory roles mainly in adipose progenitor cells, which occupy only a small proportion of the adipose tissue. As a result, it does not have active marks on any of the five core histone modifications (H3K4me3, H3K4me1, H3K36me3, H3K27me3, H3K9me3) in the assayed adipose tissue in ENCODE or Roadmap data. Even with these challenges, DVAR assigned rs1421085 with a functionality score of 0.9976. In 2D space, this variant is far away from the center of the background (Fig. 4), highlighting DVAR’s capability of capturing integrative evidence to identify genuine functional variants.
For red blood cell traits, a recent study utilized MPRA and pinpointed 32 functional variants (Ulirsch et al., 2016), and among them three variants (rs737092, rs1175550 and rs1546723) were demonstrated as the causal variants, which dominantly affect the transcription of SMIM1, RBM38 and CD164, by CRISPR-Cas9 genome-editing. For rs737092, it was confirmed as a causal variant that regulates target genes RBM38 and RAE1, and the reported DVAR-score for this variant is 0.9536. Similarly, rs1175550 is a causal variant regulating the expression of three nearest genes (SMIM1, LRRC47 and CEP104), and the reported DVAR-score is 0.9509. For causal variant rs1546723, which regulates the expression of CD164, FOXO3 and FIG4, the reported DVAR-score is 0.9517. Although these three variants are relatively close to the center of the background (Fig. 4), DVAR is able to successfully prioritize them while other methods performed poorly in assessing their functionality (Supplementary Table S6).
For Atrial Fibrillation, it has been evaluated that the variant rs2595104 reduced the PITX2c expression by reducing the enhancer activity (Ye et al., 2016). In our approach, the functional score of rs2595104 is 0.9711. This variant is located in regions with epigenomic alterations across both ‘Muscle’ and ‘Heart’ tissue-groups, and in 2D space, it is considerably far away from the center of the background (Fig. 4).
For prostate cancer, the CAUSEL pipeline with the transcription activator-like effector nuclease mediated genome-editing identified rs339331 as potentially the functional regulatory variant for RFX6 expression (Spisak et al., 2015). Although DVAR does not use the H3K4me2 histone mark, which was mainly used in CAUSEL, other genomic features along with the evolutionary evidence boosted DVAR to classify it as a highly promising variant with a score of 0.9820. For breast cancer and ovarian cancer, rs56069439 was identified as the causal variant that acts through inducing the downregulation of ANKLE1 (Lawrenson et al., 2016). In colorectal cancer, rs1800734 was determined to promote cancer progression by enhancing the expression of DCLK3. All these three cancer variants were assigned with predicted functionality scores all being > 0.95. A particularly interesting variant is rs200996365, which is a 1-bp deletion variant that increases the risk of bladder cancer by regulating the expression of CCNE1(Pattison et al., 2016). It was assigned with DVAR-score of 0.9856, demonstrating DVAR’s capability of predicting complex variants beyond SNPs, such as Indels.
3.4 DVAR-scores across EHR-based medical phenotypes
Although DVAR has been shown to be effective in distinguishing disease causal variants, the total number of the variants verified by genome-editing is too scarce. Recently, large-scale biobanks, e.g BioVU (Denny et al., 2013) and UK Biobank (Petersen et al., 2013), which focus on the phenome-wide association study (PheWAS) of EHRs, provide an unbiased interrogation of disease variants across EHR-based phenotypes (Denny et al., 2013). We investigated whether DVAR is able to prioritize non-coding variants across a diverse spectrum of EHR-based medical phenome. The BioVU dataset was obtained from Vanderbilt University Medical Centers while the PheWAS results of UK Biobank are obtained from https://docs.google.com/spreadsheets/d/1b3oGI2lUt57BcuHttWaZotQcI0-mBRPyZihz87Ms_No/edit#gid=1209628142. For each variant, we considered the relationships of DVAR-scores with the number of PheWAS associations. For both datasets, we used the same thresholds for the significance of the associations (P-values = 1e-3, 1e-4, 1e-5 and 1e-6) to count the phenotype associations. For each significant association level, the variants were divided into two groups: the ‘high-score group’ includes all of the variants with DVAR-scores larger than the median level of all the analyzed variants while the ‘low-score group’ include the other half variants. We found that in all cases, the variants in the high-score group have significantly more phenotype associations than that in the low-score group (one-sided Wilcoxon signed rank test) (Supplementary Table S7). Results for the comparison of CADD, Eigen, GWAVA and DANN in the two EHR datasets are also reported in Supplementary Tables S8–S11. DVAR performed better than the other methods, especially for the UK Biobank dataset. Notably, P-value results of UK Biobank are lower than that of BioVU, due to its much larger sample size of UK Biobank compared to BioVU.
4 Discussion
Recently, with the growth of large-scale projects with EHRs (e.g. BioVU and UK biobank) and the development of targeted genome-editing technology (like CRISPR-Cas9), genetics has been driven by the hope that the disease casual variants can be identified correctly (Vera Alvarez et al., 2017). In this study, we demonstrated how our framework can help prioritize the functionality of non-coding variants, through de novo discovery of inherent patterns and the subsequent multi-class modeling of high-dimensional genomics data. To the best of our knowledge, DVAR is the first approach that simultaneously performs de novo discovery of regulatory patterns of non-coding variants and predicts their functional scores. The scoring method is developed with the use the multi-class label, and therefore can be used for any clustering algorithms, which may provide new insights for the separation of non-coding variants with other principles in future work (in principle, we can utilize the considerable knowledge we have learned about various REs such as enhancers and promoters). Although DVAR is based on the multi-class assumption, it should be viewed as complementary to the two-class learning methods (like GWAVA and CADD). Compared with these methods, DVAR is superior at prioritizing weak functional variants, e.g. eQTLs or MPRA variants, which are likely to play dominant roles in complex diseases, further supported by its ability to prioritize non-coding variants associated with EHR-based medical phenome, in which significantly associated phenotypes are vastly complex diseases. For the strong signals like clinically significant variants, two-class learning methods are adequately powerful.
The DP model identified five de novo functional patterns, which provide a new perspective on the landscape of non-coding variants. Of particular interest is C3 since it is enriched for intergenic regions but significantly different than C1, and DVAR is able to separate those from non-functional ones. The regulatory mechanisms of Intron and intergenic functional variants are likely different since they are always enriched for different clusters.
The total number of functional patterns identified by DVAR is completely different from the multi-class learning methods: ChromHMM used 15-state model (Ernst and Kellis, 2012; Roadmap Epigenomics Consortium et al., 2015); Segway set the number of group labels to 25 (Hoffman et al., 2013); FUN-LDA (Backenroth et al., 2018) used nine classes to describe the functional classes across different tissues. The numbers of classes in these methods are pre-specified for different purposes: tissue-specific segmentation or annotation. Actually, it is hardly known the accurate number of functional patterns, which is likely to vary depending on the in-depth studies on regulatory mechanisms of non-coding variants. DVAR is totally automatic to decide this number based on the genomic data. The smaller number of clusters revealed in DVAR is a result of multifaceted factors, and due in part to the prior imposed in the DP, and in part to the explicit modeling of the correlation among all genomic features by the use of a full covariance matrix. With increasing amounts of genomics data being constantly cumulated, DVAR can take further advantages of more evidence to refine the clustering patterns and get a more accurate number of the functional clusters. Multiple imputation for the missing data, feature normalization (to avoid the mismatch of real distribution of data with the model assumption) and probability weighted scores are also expected to further boost the prediction accuracy. In principle, for this particular purpose, the framework can be extended to focus on specific diseases [e.g. DIVAN(Chen et al., 2016) and ReMM(Smedley et al., 2016)] or specific tissues (Backenroth et al., 2018). Such pattern discovery in tumor-derived genomics data may hold promise as well in prioritizing cancer driver non-coding mutations.
Funding
BioVU which was supported by institutional funding and by the Clinical and Translational Science Award grant [ULTR000445] from the National Center for Advancing Translational Sciences/National Institutes of Health. Genome-wide genotyping was funded by National Institutes of Health grants [RC2GM092618] from The National Institute of General Medical Sciences/OD and [U01HG004603] from NHGRI/The National Institute of General Medical Sciences. The methodology work was supported by US National Institutes of Health/The National Human Genome Research Institute grants [U01HG009086, R01HG006857].
Conflict of Interest: none declared.
References

