


Abstract
Compound identification is one of the most eminent challenges in the untargeted analysis of complex mixtures of small molecules by mass spectrometry. Similarity of tandem mass spectra can provide valuable information on putative structural similarities between known and unknown analytes and hence aids feature identification in the bioanalytical sciences. We have developed CluMSID (Clustering of MS2 spectra for metabolite identification), an R package that enables researchers to make use of tandem mass spectra and neutral loss pattern similarities as a part of their metabolite annotation workflow. CluMSID offers functions for all analysis steps from import of raw data to data mining by unsupervised multivariate methods along with respective (interactive) visualizations. A detailed tutorial with example data is provided as supplementary information.
CluMSID is available as R package from https://github.com/tdepke/CluMSID/and from https://bioconductor.org/packages/CluMSID/.
Supplementary data are available at Bioinformatics online.
1 Introduction
The untargeted analysis of complex mixtures of small molecules using liquid chromatography coupled to (tandem) mass spectrometry (LC-MS(/MS)) has developed into an important technology to study biological systems, from the various applications of metabolomics to natural product research, drug discovery, environmental and forensic sciences. Still, the technique faces various challenges, the most important being metabolite identification (Johnson et al., 2016). To address this issue, multiple tools have been developed that aid identification by different approaches, mostly relying on computational mass spectrometry (Tsugawa, 2018).
In proteomics and metabolomics, similarity of tandem mass spectra is routinely used to gauge the match score of experimental and library spectra (Tabb et al., 2003). It is now also established that similarities in tandem mass spectrometry (MS2) fragmentation can hint towards structural relations between analytes (Garg et al., 2015). In this paper, we present a customizable open access tool for similarity-based clustering of LC-MS/MS data from data-dependent acquisitions. It enables reproducible analyses and is fully integratable into R pipelines that use e.g. the popular packages from the ‘xcms’ family. The tool is also applicable to flow injection or GC-EI-MS data. However, we will refer to the most frequent experimental type, i.e. LC-MS/MS, in the following. The tool can handle mass spectra following positive and negative ionization from low- and high-resolution mass analyzers. With these assets, CluMSID has the potential to become a valuable extension of the metabolomics data analyst’s toolbox.
2 Implementation and main functions
CluMSID is a highly flexible open source tool written in R that combines MS2 spectral similarity comparisons with several unsupervised data mining methods. The data can be accessed at all stages and custom data analysis steps can easily be integrated. CluMSID is available as R package that can be installed from Bioconductor or downloaded from GitHub and used on all platforms.
2.1 Data import, pre-processing and similarity calculation
For its main functions (Fig. 1), CluMSID requires LC-MS/MS data in a standard non-proprietary format that can be parsed by ‘mzR’ (http://github.com/sneumann/mzR), e.g. mzXML. MS2 spectra are extracted from the raw file, and redundant MS2 spectra are merged into consensus spectra. This process can either operate stand-alone by grouping spectra from the same precursor ion within a retention time interval defined by the user, or spectra can be assigned to peaks picked by a different method or software by means of an external peak table, e.g. generated by ‘xcms’ (Smith et al., 2006).
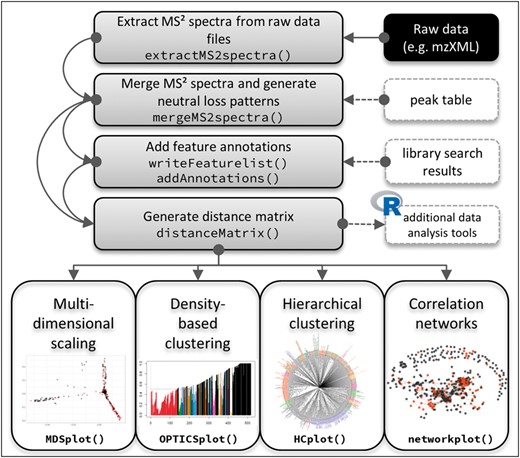
Schematic of a CluMSID workflow. The main functions of CluMSID and their logical order are illustrated. Grey boxes signify data (pre-)processing steps that serve as the basis for multidimensional scaling, clustering, correlation networks or other additional analysis tools. White boxes on the right symbolize optional in- or output, the black box indicates required input
During the merging process, neutral loss patterns are generated for all features by subtraction of each fragment m/z from the precursor m/z. Neutral losses represent uncharged fragments that also convey structural information comparable to charged fragments. The neutral loss patterns can be processed like MS2 spectra. Annotations can be added to features that have been identified by the user, e.g. by using online or in-house spectral libraries.
A distance matrix is produced from the list of (annotated) consensus spectra by calculating spectral similarities for every pairwise combination. The similarity measure used by CluMSID is the spectral contrast angle, also known as cosine similarity or cosine score (Wan et al., 2002). This distance matrix is the basis for the clustering functions and can be used with non-CluMSID functions to customize the analysis workflow.
2.2 Mining and visualization of similarity data
Four data mining methods along with respective (interactive) visualizations are included in CluMSID: multidimensional scaling (MDS), density-based clustering with the OPTICS (Ordering points to identify the clustering structure) algorithm (https://cran.r-project.org/web/packages/dbscan/), hierarchical clustering and the generation of correlation networks using the ‘network’ package (Butts, 2008). In the first study that employed a CluMSID prototype, hierarchical clustering proved the most suitable method to putatively annotate P.aeruginosa secondary metabolites (Depke et al., 2017).
CluMSID’s correlation network functions are particularly useful for researchers who have worked with ‘Molecular Networking’ before but would like to use a more interactive and flexible tool. The MDS plot and the correlation network visualization can also be generated in an interactive and zoomable version based on the ‘plotly’ package (https://cran.r-project.org/web/packages/plotly/).
2.3 Additional functionalities
CluMSID harbours a set of accessory functions, e.g. to find spectra that contain a specific fragment or neutral loss or to match single spectra against a set of (library) spectra.
Furthermore, MS1 pseudospectra, i.e. groups of MS1 peaks derived from the same analyte like adducts, fragments etc., as produced by the ‘CAMERA’ package (Kuhl et al., 2012), can be extracted from raw data and analyzed like MS2 spectra.
2.4 Comparison to existing tools
Similarity-based clustering of LC-MS/MS data from data-independent acquisition can also be performed using the ‘MetFamily’ tool (Treutler et al., 2016) or the more specialized MS/MS data mining tool ‘MetCirc’ (Naake and Gaquerel, 2017), while the best known method to study MS2 spectra from data-dependent acquisition (auto-MS/MS) is ‘Molecular Networking’, a widely used web tool that however offers relatively little possibilities for customization (Wang et al., 2016). Whereas ‘Molecular Networking’ and ‘MetFamily’ are web applications that can be accessed via a webserver with the need to upload data, we provide a package that does not rely on the public upload of data and offers greater transparency and customisability by enabling access to the data at every step of the analysis. The incorporation of CluMSID in an existing R pipeline that uses for instance xcms for peak picking is a usecase which we expect to be very common and useful for the community working with untargeted metabolomics data. ‘MetCirc’ is an interactive visualization tool to compare MS2 experimental data across organisms or tissues, thus it has a different focus than CluMSID. While the distance matrix is calculated in a similar manner, CluMSID features more options for data preprocessing, analysis and visualization, like hierarchical and density-based clustering. The analysis of pseudospectra and neutral loss patterns are additional, valuable features.
3 Conclusion
CluMSID is a tool that aids the identification of features in untargeted LC-MS/MS analysis by the use of MS2 spectral similarity and unsupervised learning methods. It offers functions for a complete and customizable workflow from raw data to visualizations in the form of a freely accessible R package. We are convinced that CluMSID will benefit both the wider metabolomics community and scientists from other bioanalytical fields applying untargeted LC-MS/MS analysis by enabling researchers to integrate MS2 spectra and neutral loss patterns similarity data into their feature annotation workflow.
Funding
This work was supported by the President’s Initiative and Networking Funds of the Helmholtz Association of German Research Centres [VH-GS-202]; the EU-funded European Marine Biological Research Infrastructure Cluster [654008]; and by a PhD scholarship of the Studienstiftung des deutschen Volkes to T.D.
Conflict of Interest: none declared.
References

