


Abstract
Many efforts have been made in developing bioinformatics algorithms to predict functional attributes of genes and proteins from their primary sequences. One challenge in this process is to intuitively analyze and to understand the statistical features that have been selected by heuristic or iterative methods. In this paper, we developed VisFeature, which aims to be a helpful software tool that allows the users to intuitively visualize and analyze statistical features of all types of biological sequence, including DNA, RNA and proteins. VisFeature also integrates sequence data retrieval, multiple sequence alignments and statistical feature generation functions.
VisFeature is a desktop application that is implemented using JavaScript/Electron and R. The source codes of VisFeature are freely accessible from the GitHub repository (https://github.com/wangjun1996/VisFeature). The binary release, which includes an example dataset, can be freely downloaded from the same GitHub repository (https://github.com/wangjun1996/VisFeature/releases).
Supplementary data are available at Bioinformatics online.
1 Introduction
Over the last two decades, the number of known biological sequences has been growing exponentially. It is urgent to understand their functional attributes. Many efficient computational methods for generating statistical features from sequences have been developed. Several web servers and stand-alone programs have been released for practical applications, such as PseAAC (Shen and Chou, 2008), PseAAC-General (Du et al., 2014), PseKNC-General (Chen et al., 2015), Pse-in-One (Liu et al., 2015) and UltraPse (Du et al., 2017). These software tools provide efficient and convenient solutions to generate statistical features for biological sequences. However, a helpful software tool for visualizing the statistical features is still lacking. Although existing programs can display nucleotide sequences using dinucleotide property curves in a genome browser style (Friedel et al., 2009), the abilities to visualize protein sequences and to intuitively compare statistical features are still missing.
To this end, we developed VisFeature, which is an open-source stand-alone program that can visualize and analyze various types of statistical features of all types of biological sequences, including DNA, RNA and proteins. To the best of our knowledge, this is the first toolkit that is designed especially for this purpose. VisFeature integrates sequence feature visualization and analysis, statistical feature visualization and comparison, online database querying, multiple sequence alignment and color sequence visualization together. All these functions are useful in the explorative stage of developing predictive algorithms for functional attributes.
2 Implementations
VisFeature is mainly implemented by using JavaScript, with the Electron framework. The remaining part of VisFeature is implemented by R scripts.
The input of VisFeature is a FASTA format file. This file can be chosen directly from the local computer. With an internet connection, VisFeature is capable of querying the UniProt database or NCBI databases using sequence identifiers or query expressions. The sequences in the query results can be saved as a FASTA file. This is the second way to obtain a FASTA file in VisFeature.
VisFeature offers two modules for feature visualization (Fig. 1).
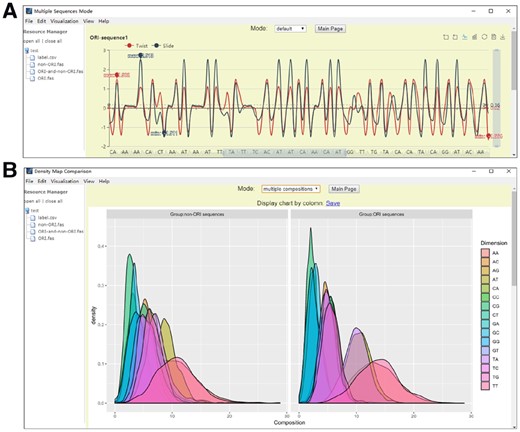
Visualization modules. (A) Physicochemical property values of sequences: the vertical axis is the value of physicochemical properties, while the horizontal axis is the position on the sequence. Since the sequence is zoomed out at a certain scale, the labels on the horizontal axis are not for continuous dinucleotides on the sequence. (B) The distribution comparison for di-nucleotide compositions between different groups. Different colors show different types of di-nucleotides
(1) The module for visualizing physicochemical properties as curves: It is implemented by Echarts (Li et al., 2018). This module provides many interactive visualization functions. For example, it can generate curves or bars for simple visualization, or perform multiple sequence alignment by calling the clustalw program (Larkin et al., 2007). Users are allowed to zoom-in and zoom-out by rolling the mouse wheel. The vertical and horizontal sidebars can be dragged to change the level of details. Many physicochemical property values are integrated within this module, including 566 physiochemical properties for amino acids, 148 for dinucleotides on DNA, 22 for dinucleotides on RNA and 12 for trinucleotides on DNA, which are all collected from literatures (Chen et al., 2015; Kawashima et al., 2008). The differences of physicochemical properties among sequences and their trends along the sequence can be visualized in this module.
(2) The module for visualizing and comparing feature vectors as density maps. After generating statistical features for every sequence using the ‘Density Map Comparison’ function, a label file should be uploaded to assign group labels to each sequence. Two different modes are implemented in this module. One is called the ‘single composition’ mode, while the other is called the ‘multiple composition’ mode. In the ‘single composition’ mode, when the statistical features are generated, VisFeature computes the density maps of the features on each dimension. In the ‘multiple composition’ mode, VisFeature generates density maps for each dimension in each group separately. The density maps of different dimensions in the same group are stacked together using transparent figures. This allows the users to compare distributions of features in different groups, which is very useful in exploring informative sequence features to predict functional attributes of biological sequences.
For the users to understand the VisFeature functions quickly, we not only provided a screen recording (Supplementary Video S1) in Supplementary Information, but also included an example dataset in the binary version of VisFeature. This dataset contains 811 sequences, which are obtained from the iORI-PseKNC study (Li et al., 2015). A set of slides is provided as Appendix 1, which is a simple step-by-step guide to experience VisFeature with the example dataset.
3 Conclusion
VisFeature is an open-source stand-alone program for visualizing and analyzing statistical features of all types of biological sequences. It provides an intuitive way to explore the trends of physicochemical properties along the sequences. It can visualize the differences of feature distributions between different sequence groups. These functions make VisFeature a helpful tool in developing predictive algorithms for functional attributes. As far as we know, VisFeature is the first software tool that integrates sequence retrieval, alignments and feature generation, visualization and distribution comparison together for all types of biological sequences.
Funding
This work was supported by National Key R&D Program of China [2018YFC0910405]; National Natural Science Foundation of China [NSFC 61872268 and 31771471]; Natural Science Foundation for Distinguished Young Scholar of Hebei Province [No. C2017209244] and Open Project Funding of CAS Key Lab of Network Data Science and Technology, Institute of Computing Technology, Chinese Academy of Sciences [CASNDST201705].
Conflict of Interest: none declared.
References

