


Abstract
The biclustering of large-scale gene expression data holds promising potential for detecting condition-specific functional gene modules (i.e. biclusters). However, existing methods do not adequately address a comprehensive detection of all significant bicluster structures and have limited power when applied to expression data generated by RNA-Sequencing (RNA-Seq), especially single-cell RNA-Seq (scRNA-Seq) data, where massive zero and low expression values are observed.
We present a new biclustering algorithm, QUalitative BIClustering algorithm Version 2 (QUBIC2), which is empowered by: (i) a novel left-truncated mixture of Gaussian model for an accurate assessment of multimodality in zero-enriched expression data, (ii) a fast and efficient dropouts-saving expansion strategy for functional gene modules optimization using information divergency and (iii) a rigorous statistical test for the significance of all the identified biclusters in any organism, including those without substantial functional annotations. QUBIC2 demonstrated considerably improved performance in detecting biclusters compared to other five widely used algorithms on various benchmark datasets from E.coli, Human and simulated data. QUBIC2 also showcased robust and superior performance on gene expression data generated by microarray, bulk RNA-Seq and scRNA-Seq.
The source code of QUBIC2 is freely available at https://github.com/OSU-BMBL/QUBIC2.
Supplementary data are available at Bioinformatics online.
1 Introduction
Since the advent of high throughput sequencing technologies, large scale gene expression profiles have been accumulating at an increasingly faster pace (Goodwin et al., 2016). Recent single-cell RNA-Seq (scRNA-Seq) techniques enable the measuring of the whole-genome level transcriptome of 103–108 individual cells at the same time (Gierahn et al., 2017; Hwang et al., 2018). The wealth of gene expression datasets available provides an opportunity to computationally identify condition-specific functional gene modules (FGMs), each of which is defined as a highly structured expression pattern on a specific gene set (Chen et al., 2016; Wang et al., 2012). These FGMs tend to be functionally related or co-regulated by the same transcriptional regulatory signals (TRSs) under a specific condition or in a particular disease cell type. Specifically, the identification of FGMs from scRNA-Seq data can further facilitate the discovery of gene signatures of specific cell types, and most importantly, the identified FGMs can be used to study the complex interactions among individual cells in response to certain stimuli, that is, cell type prediction. Our recent identification of FGMs specific to a subset of patients revealed biological characteristics of different disease subtypes and alternative drug resistance mechanisms in colorectal cancer (Cao et al., 2018). In addition, we have demonstrated the correspondence between the cell sample-specific FMGs and gene co-regulation modules in scRNA-Seq data (Wan et al., 2019). Overall, successful derivation of the FGMs may grant a higher-level interpretation of large-scale gene expression data, improve the functional annotation of condition-specific gene activities, facilitate the inference of gene regulatory relationships, hence, providing a better mechanism level understanding of complex diseases.
The computational identification of FGMs can be modeled as detecting data patterns occurring over a subset of genes and samples/cells that represents a highly distinguishable structure (a submatrix with significant local low-rank, more details can be found in Supplementary Note S1). This computational formulation falls under a biclustering approach (Ulitsky et al., 2010), which is a two-dimensional data mining technique that simultaneously identifies co-expressed genes under a subset of conditions. Substantial efforts have been made to advance the biclustering algorithm and tool development since 2000 (Monier et al., 2019; Xie et al., 2018; Zhou et al., 2012), and a few review studies provided considerable guidance in choosing suitable algorithms in different contexts. Eren et al. (Eren et al., 2013) compared 12 algorithms and concluded that our in-house method, QUBIC (Li et al., 2009; Zhang et al., 2016), is one of the top-performing methods, as it achieved the highest performance in synthetic datasets and captured a high proportion of enriched biclusters on real datasets in comparison to Plaid (Lazzeroni and Owen, 2002), FABIA (Hochreiter et al., 2010), ISA (Bergmann et al., 2003) and Bimax (Prelić et al., 2006). In 2018, Saelens et al. ranked QUBIC, ISA and FABIA as the top biclustering methods in terms of predicting gene modules from human and synthetic data (Saelens et al., 2018).
Although numerous biclustering methods have been developed, our preliminary results indicated that they encountered an average 30.4% performance drop in FGMs prediction on RNA-Seq data compared to microarray data (the drop can be up to 73.8% as shown in Supplementary Fig. S1). There are multiple underlying reasons, including, but not limited to, the following two: (i) The gene expression data derived from RNA-Seq has massive zero expression values, e.g. up to 60% of all the genes in a cell have zero read counts for scRNA-Seq data (Bacher and Kendziorski, 2016; Lun et al., 2016). The expression distribution is thus highly skewed, and the normalized read counts roughly follow lognormal distributions. However, unquantifiable errors occur as the raw zero counts of specific genes will result in negative infinity values after logarithmic transformation (Bengtsson et al., 2005; Hebenstreit et al., 2011) (see more details in Supplementary Note S2). (ii) Existing biclustering methods adopt various optimization functions (e.g. CC employs mean squared residue; ISA requires that the gene expression in each row and column have an average value above some pre-defined thresholds), yet most of them cannot deal with a large gene pool and/or up to tens of thousands of conditions. Thus, these methods fail to effectively select the significantly function-related candidate genes in such scenarios. Additionally, existing algorithms lack rigorous statistical significance evaluations for the identified biclusters, besides pathway enrichment-based evaluations. The common practice is to output a group of biclusters and then assess their biological significance. However, some statistically significant biclusters may carry novel biological meaning that are unavailable in the limited functional annotation. Considering these, novel biclustering methods taking full consideration of the particular statistical distribution of RNA-Seq data, integrating a new optimization function for FGM identification, and providing a robust statistical significance evaluation framework are urgently needed.
In this paper, we developed a novel QUalitative BIClustering algorithm version 2 (QUBIC2) for large-scale gene expression data analysis. Inheriting the qualitative representation and graph-theory based model from QUBIC, QUBIC2 has the following unique features: (i) it uses a mixture truncated model to handle the unquantifiable errors in RNA-Seq data and a reliable qualitative representation to reflect expression states corresponding to various potential TRSs; (ii) it integrates an information-divergence based objective function and a drop-outs saving expansion strategy in support of functional gene modules optimization; and (iii) it presents a novel method to enable the general statistical significance evaluation of all the identified biclusters in any organism.
2 Materials and methods
2.1 Data acquisition
A total of eight expression datasets were used in this study: two synthetic RNA-Seq datasets, two microarray datasets (one from E.coli and one from Human), two bulk RNA-Seq datasets (one from E.coli and the other from Human) and two scRNA-Seq human datasets (one SMART-Seq2 and one 10X Genomics data). The synthetic datasets were simulated using our in-house simulation method (Supplementary Method S1 and Supplementary Table S1). A total of 10 and 30 co-regulated modules were embedded in these two datasets, respectively. The E.coli microarray data were downloaded from M3D (Faith et al., 2008), and the human microarray data were retrieved from (Saelens et al., 2018). The E.coli RNA-Seq data were integrated and aggregated by our group. In short, 155 fastq files were downloaded from SRA (Leinonen et al., 2011) using sratoolkit (v2.8.1) and then processed following a pipeline with quality check (FastQC), reads trimming (Btrim), reads mapping (HISAT2) and transcript counting (HTseq). Finally, the raw read counts were normalized to get the RPKM values. The human RNA-Seq data were obtained from (Saelens et al., 2018). The scRNA-Seq data were downloaded from (Kiselev et al., 2017) as an RPKM expression matrix. The 10X Genomics peripheral blood mononuclear cells (PBMC) dataset was downloaded from https://support.10xgenomics.com/single-cell-gene-expression/datasets/1.1.0/pbmc3k.
Multiple sets of known modules/biological pathways were provided or collected to support the enrichment analysis of the above eight datasets. For synthetic data, the groups of pre-defined up-regulated genes were used as co-regulated modules. For E.coli data, we used five kinds of biological pathways, i.e. complex regulons (ComTF) and regulons extracted from the RegulonDB database (version 9.4, accessed on August 5, 2017), KEGG pathways collected from the KEGG database (accessed on August 8, 2017), SEED subsystems from the SEED genomic database (accessed on August 8, 2017) (Overbeek et al., 2005) and EcoCyc pathways from the EcoCyc database (version 21.1, as of August 8, 2017) (Keseler et al., 2017). ComTF were defined as a group of genes that are regulated by the same transcription factor (TF) or the same set of TFs. For the human microarray and RNA-Seq data, we used the modules provided by (Saelens et al., 2018). For Yan’s scRNA-Seq data and 10X Genomics PBMCs data, we downloaded 647 ChIP-Seq datasets on embryonic stem cells from the Cistrome database (Mei et al., 2017). Detailed information on the datasets is listed in Supplementary Table S2.
2.2 Overall design of QUBIC2
The essence of the algorithm design in QUBIC2 is outlined as follows, with an overview of the workflow showcased in Figure 1. The original expression data was first qualitatively represented based on the assumption that a gene should receive possible TRSs under all the conditions; hence, its expression profile would follow a mixture of Gaussian distributions. Specifically, a mixture of Gaussian distributions was used to fit the microarray data, while for bulk RNA-Seq and scRNA-Seq data, a large number of observed zeros and low expressions was treated as left-censored data in the mixture Gaussian model of each gene (Cohen, 1959; Stegle et al., 2015). In our recent study, the mixture of Left-truncated Gaussian distributions (LTMG) model was applied to fit large-scale gene expression data (Wan et al., 2019). An Expectation-Maximization algorithm was employed to estimate the parameters of the distributions, and the gene expression value under a specific condition was labeled to the most likely distribution. Accordingly, a row consisting of discrete values (1, 2, …, ) for each gene was generated. Then this qualitative row was split into new rows, such that in the th row those labeled initially as are labeled as 1, denoting that the gene received a particular TRS under the current condition, while the rest were labeled as 0, meaning that the gene did not receive any TRS under the condition. Finally, a binary representing matrix MR was generated (Fig. 1a).
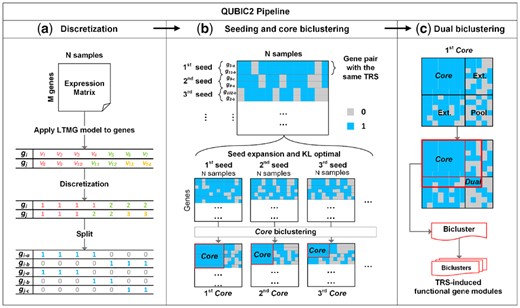
Illustration of QUBIC2 algorithm design. (a) Discretization of gene expression data. The LTMG model was applied to fit the expression profile of a gene. A representing row for each gene was generated with integers denoting the most likely component distribution that an expression value belongs to, and then this representing row was split into multiple rows. Finally, a binary representing matrix was generated after applying the above procedure to all the genes; (b) Core biclustering. By sorting all the gene pairs (seeds) in decreasing order of their weight, an initial seed list was obtained. For a feasible seed, QUBIC2 selected highly correlated genes with the seed in support of the build of an initial Core. (c) Dual biclustering. QUBIC2 expanded the Core vertically and horizontally to recruit more genes and conditions under a preset consistency level, respectively. The intersected zone created by extended genes and conditions formed a searching pool. QUBIC2 identified a Core in the pool (denoted as Dual) using the same procedure in b and output the bicluster with genes and conditions that came from the Core and Dual
All the gene pairs (seeds) were sorted in decreasing order of their weight, which is defined as the number of conditions under which the two genes have 1 s in MR(Fig. 1b). The algorithm will iterate this list of seeds. Specifically, given a feasible seed, it will recruit genes and conditions to build an initial Core. We assumed that a bicluster should consist of genes receiving the same TRSs in a subset of conditions, while the genes outside the bicluster may receive different TRSs. According to our LTMG model, genes receiving the same TRSs under certain conditions will be labeled as 1 s under those conditions, giving rise to a clue to group these genes. The Kullback–Leibler divergence score (KL score) is designed to select candidate genes and conditions such that the 1 s concentrate within biclusters while 0 s mainly appear in the outside, i.e. it makes sure the difference between a bicluster and its background is more significant than the difference between an arbitrary same-size submatrix and its background. The KL score can quantify this difference and facilitate bicluster optimization and candidate selection (Fig. 1b. Details in KL score for biclusters optimization).
The above process will generate a Core bicluster consisting of 1 s. We believe that some 0 s outside the cores might be dropouts, therefore the core needs to be expanded. Since it is difficult to determine cutoffs for the expansion, we first expand the Core both horizontally and vertically, and then we heuristically search for another Core in the expanded region, so-called a Dual bicluster (Fig. 1c). The genes and conditions from both the Core and Dual constitute a submatrix (I, J) of MR, which is one bicluster ready for output. We assumed that 0 s induced in this way are more likely to be dropouts and can support gene expression recovery and further FGM identification.
Furthermore, a statistical framework based on the size of the biclusters was implemented to calculate a P-value for each of the identified biclusters. The problem of assessing the significance of identified biclusters was formulated as calculating the probability of finding at least one submatrix enriched by 1 from a binary matrix with a given size, with a beta distribution employed during the process. This P-value framework enables users to evaluate the statistical significance of all the identified biclusters, especially for those from less-annotated organisms.
2.3 Left-truncated Mixed Gaussian (LTMG) model for gene expression data discretization
And is labeled by TRS if . In such a way, a row consisting of discrete values (1, 2, …,) for each gene will be generated.
2.4 KL score for biclusters optimization
2.5 Evaluation of the functional modules
The capability of algorithms to recapitulate known functional modules is assessed using precision and recall. First, for each identified bicluster, we use the P-value of its most enriched functional class (biological pathway) as the P-value of the bicluster (Li et al., 2009). The bicluster is deemed enriched with that function if its P-value is smaller than a specific cutoff (e.g. 0.05).
Note that the number of biclusters used to calculate precision and recall may affect the results. To make sure the evaluation is as fair as possible, for each dataset, we select the first 30 biclusters.
2.6 Size-based P-value framework
2.7 Pseudo algorithm design of QUBIC2
Step 1 (Data discretization and qualitative representation): Given an expression matrix with log-transformed FPKM, RPKM or CPM values for genes, use the LTMG model to fit the data. Label the values to the most likely distribution to get a representing row for each gene. Split these rows into multiple rows to get the representative matrix MR(Supplementary Fig. S2a).
Step 2 (Graph construction and seed selection): Construct a weighted graph for MR, where nodes correspond to genes and edges connect every pair of genes. The edge weight indicates the similarity between the two corresponding genes, which is defined as the number of conditions in which the two genes have 1 s in MR. Sort the list of edges in in decreasing order of their weights (i.e.An edge is selected as a seed if and only if at least one of is not in any previously identified biclusters, or are in two nonintersecting biclusters in terms of genes. Select a feasible seed from the seed list. Go to Step 6 if the seed list is empty (Supplementary Fig. S2b).
Step 3 (Build core bicluster): Build an initial bicluster by finding all the conditions under which the two genes of the seed have 1 s in MR. Set these columns of the two genes as the current bicluster B = (I, J). Expand B by adding a new gene that has the most 1 s in J, giving rise to a new bicluster B’ = (I’, J’), where I’ is I after adding the new gene and J’ is J by deleting those columns with 0 s. If two genes have the same number of 1 s in J, choose the one with larger KL similarity with B (Supplementary Fig. S2c). If KLB′ > KLB, set B to B′ and repeat Step 2, otherwise stop and denote B as Core. Go to Step 4.
Step 4 (Core expansion): Expand the Core horizontally and vertically under preset consistency level as follows: for each gene (row) i not in B, if the ratio between the number of 1 s in row i under J and |J| is ≥c, mark it as an extended gene; for each condition (column) j not in B, if the ratio between the number of 1 s in the column j among I and |I| is ≥c, mark it as an extended condition. (Supplementary Fig. S2d). Mark the intersected zone created by extended genes and conditions as a Dual searching pool (light blue box in Supplementary Fig. S2e). Go to Step 5.
Step 5 (Search Dual): Search Dual in the intersected expanded zone, using the same process in Step 3, output the bicluster with genes and conditions that come from Core and Dual (red box in Supplementary Fig. S2e). Delete current seed, go to step 2.
Step 6 (Biclusters filtering): Rank all the identified biclusters in decreasing order of their sizes (#row x #column). Output the first bicluster. Go to the second bicluster, skip it if its overlap with the first bicluster exceeds f, otherwise output it. Go to the next bicluster, skip it if it overlaps with the either of the biclusters in output exceeds f, otherwise output it. Continue until the last bicluster is checked. Go to Step 7.
Step 7 (Enrichment validation): For each output bicluster, we use the P-value of its most enriched functional class (biological pathway) as the P-value of the bicluster (details in Evaluation of the functional modules section). A bicluster is deemed enriched with a function if its P-value is smaller than a specific cutoff (e.g. 0.05).
3 Results
3.1 QUBIC2 achieves a better performance in the identification of FGMs compared to other methods
We compared QUBIC2 with eight biclustering algorithms, which include those evaluated as the top performed algorithms in the public domain (Bimax, ISA, FABIA, Plaid and QUBIC) and those published in the recent three years [BicMix (Gao et al., 2016), Runibic and EBIC (Orzechowski et al., 2018)] (Supplementary Method S4 and Supplementary Tables S3 and S4). The comparison performance in FGMs identification was evaluated by the precision, recall and f-score defined by the harmonic mean of the precision and recall. Eight gene expression datasets were used in the evaluation covering simulated, microarray, bulk RNA-seq and scRNA-Seq data in E.coli and Human. To minimize the biases in performance comparison among multiple tools, for each of the eight datasets, we run the nine tools using more than 50 parameter combinations by adjusting their critical parameters around default/recommended values (Details in the Section 2).
As showcased in Figure 2a, QUBIC2 achieved the highest median f-scores (f) on almost all the eight datasets. On simulation data, QUBIC2, QUBIC and FABIA were the top three algorithms with very close median f-scores. On microarray data and bulk RNA-Seq data from E.coli, QUBIC2 demonstrated particularly outstanding advantages. Specifically, the f-scores of QUBIC2 were significantly higher than the second-best algorithms, i.e. FABIA, Plaid and QUBIC, with one-tailed Wilcoxon test P-values as 1.67e-10, 6.72e-30 and 2.23e-62, respectively. It is also noteworthy that QUBIC2 and ISA were the best choices on the scRNA-Seq datasets. EBIC achieved the best performance on only one scRNA-Seq dataset, while its performance on the other scRNA-Seq dataset was disappointing.
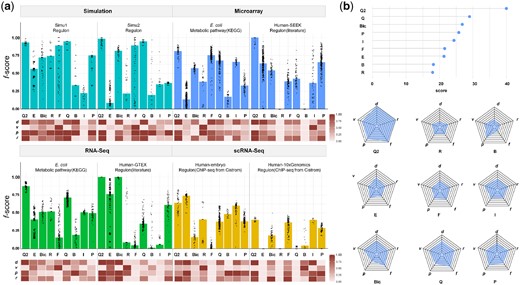
Overall performance of QUBIC2. (a) Bar plot: Distribution of f-scores on each of the eight datasets under multiple runs (with at least 50 parameter combinations). Bars denote the median of the dots. Q2, E, Bic, R, F, Q, B, I and P represent QUBIC2, EBIC, BicMix, Runibic, FABIA, QUBIC, Bimax, ISA and Plaid, respectively; Heatmap: Relative performance of six algorithms regarding d, v, p and r, respectively (normalized over six algorithms). Note that v depends on the increment of parameters and therefore is only indicative; (b) Lollipop plot: Overall scores of each algorithm summed across eight datasets; Spider plot: averaged scores of each algorithm in terms of f, d, v, p, r
In regards to f-scores under the default parameters (d), QUBIC2 consistently had the highest values across all eight datasets, suggesting that users can trust QUBIC2’s default settings in practical studies for getting satisfactory results. QUBIC ranked as the second-best on two datasets, namely one simulated dataset and one RNA-Seq dataset from E.coli; ISA was suboptimal on two scRNA-Seq datasets; and Bimax, FABIA and BicMix occupied second place on one simulated dataset, microarray dataset from E.coli and RNA-Seq dataset from human, respectively. QUBIC2 performed well in both precision (p) and recall (r), indicating that the identified FGMs are relevant and diverse. QUBIC2 also had a relatively small variance of f-score (v), while the performance of some algorithms on specific datasets was susceptible to parameter changes (e.g. FABIA, Bimax and EBIC). ISA, QUBIC and BicMix were generally very stable, and their variances were often the second smallest among datasets. As for Bimax, although its recall was relatively low, it was characterized with high precision on four datasets.
3.2 QUBIC2 reaches robust performance across various datasets and different sequencing technologies
To intuitively show the performance of a given algorithm, we further assigned scores to it based on its rank among all the six algorithms, in terms of f, d, v, p and r, respectively. Specifically, a score of 9 was assigned to the algorithm that has the best performance, and a score of 1 was assigned to the algorithm that has the worst performance. For f, d, p and r, algorithms with higher values had higher scores, while for v, those with lower values had higher scores. We then calculated each algorithm’s summed and average scores on eight datasets to get an idea about their overall performance and their respective strengths and weaknesses. Specifically, QUBIC2, QUBIC and BicMix were the top three algorithms across the eight datasets according to the above scores (Fig. 2b). Overall, QUBIC2 achieved the highest median f-scores and default f-scores, and for most of the cases, it also had higher precision and recall as well as lower variance than the others. The rest of the algorithms had unique advantages: QUBIC and BicMix had higher default and median f-scores, and QUBIC also had higher recall. ISA was remarkable for its low variance, and both Plaid and Bimax had relatively high precision. EBIC and FABIA were rather balanced tools, performing neither badly nor well in the five aspects.
The performance of these nine algorithms across various datasets and different sequencing technologies was also evaluated. QUBIC2 is recommended among simulation, microarray, RNA-Seq and scRNA-Seq data due to its highest median f-score, default f-score, median precision and median recall, as well as its lowest variance. QUBIC had obvious advantages on simulation and RNA-Seq data; BicMix was also a good choice for RNA-Seq data; FABIA performed well on microarray data; both ISA and EBIC proved to be outstanding on scRNA-Seq data; and Plaid ranked the third-best on simulation and microarray data. While Bimax had no comprehensive advantages, it is known for high precision on simulation and RNA-Seq data. As far as species/organisms are concerned, QUBIC2 had the best performance on E.coli and human data, with its ranks in terms of f, d, v, p and r almost always at the top; Plaid was extraordinary in terms of low variance on data from E.coli and high precision on data from human; and ISA was balanced and second only to QUBIC2’s performance on data from human (Supplementary Fig. S3).
3.3 QUBIC2 identifies FGMs with more biological characteristics
The above section demonstrated the outstanding performance of QUBIC2 on FGMs identification, and in this section, we used a specific case to illustrate why QUBIC2 has such excellent power. Since QUBIC was overall the second-best algorithm, we took it as a reference in the illustration. A bicluster with 963 genes and 30 embryonic cells (BC001_Q) was identified from Yan’s data using QUBIC, with 16 cells being in the eight-cell stage and 14 cells being in the Morulae stage; and QUBIC2 found a bicluster consisting of 1, 264 genes and 15 embryonic cells (BC018_Q2), with all the cells being in the eight-cell stage. Six hundred thirty-one genes appeared in both BC018_Q2 and BC002_Q (shared genes) (Fig. 3a). Due to the considerable overlap between the two biclusters, we concluded that BC001_Q and BC018_Q2 share the same Core. Functional enrichment analysis was conducted for the 631 shared genes based on the Reactome database, and the top ten most enriched pathways were identified (Fig. 3b). For each of the ten pathways, the adjusted P-values were significantly lower in the genes of BC018_Q2 than in the shared genes (one-tailed paired Wilcoxon-test P-value = 0.000976), while genes of BC001_Q always had a significantly higher adjusted P-value than did the shared genes (one-tailed paired Wilcoxon-test P-value = 0.000977). The above phenomena suggest that given a pathway, QUBIC2 tends to capture a higher proportion of genes involved in that pathway than does QUBIC. Hence, it is appropriate to claim that given the same Core, QUBIC2 is more likely than QUBIC to recruit genes that are functionally related to the core.
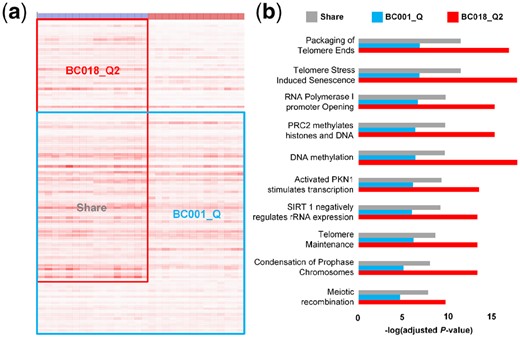
Comparison of two biclusters identified by QUBIC2 and QUBIC, respectively. (a) Visualization of the two biclusters. Red box denotes bicluster from QUBIC2, and a blue box indicates bicluster from QUBIC. The overlapped genes are marked as shared genes. The colors of the bar at the top denote cell types, with blue representing the eight-cell stage and red being the Morulae stage; (b) Comparison of adjusted P-values for the top ten most enriched pathways of shared genes, QUBIC genes and QUBIC2 genes
Among the top ten most enriched pathways, DNA methylation encountered the most apparent change in terms of adjusted P-values. DNA methylation provides a potential epigenetic mechanism for maintaining cellular memory during self-renewal. The DNA methylation pathway consists of 32 genes, and QUBIC2 captured 20 of them. Compared to QUBIC, QUBIC2 additionally secured seven genes DNMT1, DNMT3L, HIST1H2BO, HIST1H2BJ, HIST1H2AJ, HIST1H2BB and HIST1H2AB, all of which play essential roles in the DNA methylation pathway. It is also noteworthy that QUBIC2 has more comprehensive coverage of the histone family genes, which play essential roles in DNA strands compaction and chromatin regulation. An overview of pathways that BC018_Q2 genes are involved in are provided in Supplementary Figure S4.
3.4 QUBIC2 provides a robust statistical evaluation framework for all the identified biclusters
The significance of gene modules from the identified biclusters is usually evaluated by pathway enrichment analysis. However, many organisms (including E.coli and human) have limited functional annotations supported by experimental verifications, which makes a systematic evaluation of all identified biclusters non-trivial. To fill this gap, a statistical method was proposed in this study, which can calculate a P-value for a bicluster purely based on its size (number of genes and conditions).
To validate the rationality of our statistical method, QUBIC2 was run on the RNA-Seq data from E.coli under multiple parameter settings, and a correlation test was conducted between the P-values of biclusters calculated via pathway enrichment analysis (named knowledge-based P-value) and the corresponding size-based P-values (Fig. 4a, details in Supplementary Method S5). Note that to distinguish the two, italic lowercase p was used to denote the p-value of the Spearman correlation test, while italic uppercase P was used to denote the significance of biclusters. Interestingly, we found that there was a strong correlation between the size-based P-values and the knowledge-based P-values. The average Spearman correlation coefficients (ρ) were higher than 0.40 (ComTF_ρ = 0.50, TF_ρ = 0.57, KEGG_ρ = 0.47, SEED_ρ = 0.46 and ECO_ρ = 0.44), and the average p-values for the correlation tests were smaller than 0.01 (Fig. 4b and c), suggesting that the correlations between knowledge-based P-values and size-based P-values were statistically significant at 0.01 level. As showcased in Figure 4, all the ρs in the five groups were positive. Also, ρs related to regulatory pathways (i.e. TF_ ρ and ComTF_ ρ) were generally larger than ρs those related to metabolic pathways (i.e. KEGG_ ρ and SEED_ ρ). This indicated that the size-based P-value seemed to be more suitable for the evaluation of biclusters in terms of their regulatory significance. Besides, the parameter f, which controls the level of overlaps between biclusters, had a negative association with ρ (Supplementary Fig. S5), signifying that the size-based P-values had a stronger association with knowledge-based P-values when the overlaps between biclusters are relatively low.
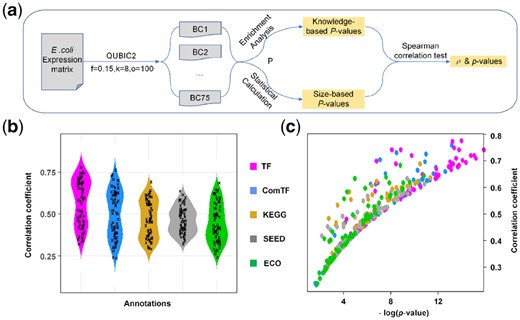
Validation on the rationality of the statistical framework. (a) The workflow of correlation test between knowledge-based P-value and size-based P-value; (b) The distribution of correlation coefficients (ρ) between P-value obtained from enrichment analysis and size-based P-value. We run QUBIC2 under 70 different parameter settings, and ρ was calculated under each run; (c) Scatter plot of correlation coefficients and p-values. The y-axis denotes the correlation coefficient for the spearman association test, and the x-axis denotes the p-value of the association test
4 Conclusion and discussion
QUBIC2 is a novel biclustering algorithm developed for FMGs detection from both simulated and real gene expression data and shows superior and robust performance across diverse biotechnology platforms, including microarray, bulk RNA-Seq and scRNA-Seq. It is empowered by three unique features, which contribute to its significant advantages in functional gene modules detection. The proposed significance evaluation framework based on bicluster size will provide a solid foundation for the systematic evaluation of all identified biclusters, especially for those from non-model species. We believe that QUBIC2 can serve for biologists and bioinformaticians as a useful tool to extract novel biological insights from large-scale gene expression data, and we believe that it can facilitate the study of distinct responses by different cell types in the same population when encountered by the same stimuli or stresses. However, most of the biclustering methods, including QUBIC2, encountered a dramatic performance drop on scRNA-Seq data, especially 10X genomics based scRNA-Seq data, compared to other RNA-Seq data. To fully excavate the potential of scRNA-Seq data, we must overcome several challenges.
First, as sequencing costs decrease, more massive scRNA-Seq datasets will become increasingly common [e.g. researchers can easily obtain scRNA-Seq data covering tens of thousands of cells via 10x Genomics (Freytag et al., 2018)]. Thus, the scalability to large datasets and the efficiency of tools will become the bottlenecks. Currently, the discretization and dual searching functions of QUBIC2 are time-consuming (Supplementary Note S3 and Supplementary Fig. S6). To improve the efficiency of QUBIC2, the OpenMP method will be implemented in the EM steps for discretization.
Another challenge lies in the interpretation of time series data, which provides the potential to elucidate the cell trajectory process and reconstruct causal gene regulatory networks from observational data. However, current scRNA-Seq protocols lose the true temporal coupling between measurements; thus existing tools fail to identify causal interactions to a satisfactory level (Qiu et al., 2018). QUBIC2 was applied to another temporal dataset (Supplementary Result S1 and Supplementary Fig. S7) and discovered biclusters specific to time point. However, QUBIC2 could only separate cells collected at different time points, and the further finer differentiation was not captured. We are developing a new framework to rebuild the timeline of cell differentiation from scRNA-Seq data, followed by a new algorithm to extract causal interactions from time-series expression data. The new algorithm will first group the expression change tendencies into several representative patterns to reduce the dimension of the timeline but keep the correlation with time delay. Then it will detect significant biclusters by taking expression values and change tendency patterns into consideration simultaneously.
Acknowledgements
We thank Minxuan Sun and Weiliang Liu for testing the QUBIC2 program.
Funding
This work was supported by an R01 award #1R01GM131399-01 from the National Institute of General Medical Sciences of the National Institutes of Health. This work used the Extreme Science and Engineering Discovery Environment (XSEDE), which is supported by the National Science Foundation #ACI-1548562. The content is solely the responsibility of the authors and does not necessarily represent the official views of the National Science Foundation and the National Institutes of Health.
Conflict of Interest: none declared.

