


Abstract
Around 2.1 million new HIV-1 infections were reported in 2015, alerting that the HIV-1 epidemic remains a significant global health challenge. Precise incidence assessment strengthens epidemic monitoring efforts and guides strategy optimization for prevention programs. Estimating the onset time of HIV-1 infection can facilitate optimal clinical management and identify key populations largely responsible for epidemic spread and thereby infer HIV-1 transmission chains. Our goal is to develop a genomic assay estimating the incidence and infection time in a single cross-sectional survey setting.
We created a web-based platform, HIV-1 incidence and infection time estimator (HIITE), which processes envelope gene sequences using hierarchical clustering algorithms and informs the stage of infection, along with time since infection for incident cases. HIITE’s performance was evaluated using 585 incident and 305 chronic specimens’ envelope gene sequences collected from global cohorts including HIV-1 vaccine trial participants. HIITE precisely identified chronically infected individuals as being chronic with an error less than 1% and correctly classified 94% of recently infected individuals as being incident. Using a mixed-effect model, an incident specimen’s time since infection was estimated from its single lineage diversity, showing 14% prediction error for time since infection. HIITE is the first algorithm to inform two key metrics from a single time point sequence sample. HIITE has the capacity for assessing not only population-level epidemic spread but also individual-level transmission events from a single survey, advancing HIV prevention and intervention programs.
Web-based HIITE and source code of HIITE are available at http://www.hayounlee.org/software.html.
Supplementary data are available at Bioinformatics online.
1 Introduction
HIV incidence quantifies newly infected individuals, making it a key metric for monitoring the epidemic's trend and guiding proper resource distribution (Brookmeyer, 1991). Furthermore, the efficacy of an HIV prevention/intervention trial can be evaluated by measuring the incidence rate difference to select optimal prevention/intervention programs (Busch et al., 2010; Incidence Assay Critical Path Working Group, 2011; Mastro, 2013). Compared to conventional serologic incidence assays that utilize the readout of HIV-1 specific antibodies (Kassanjee et al., 2014; Kassanjee et al., 2016; Keating et al., 2016), the genomic assay has achieved much higher precision in distinguishing chronic and incident cases (Cousins et al., 2012; Moyo et al., 2016; Park et al., 2011; 2014; Ragonnet-Cronin et al., 2012; Wu et al., 2015). For the first time, this genomic incidence assay has met the optimal performance standards of false recency rate (FRR)—the proportion of chronically infected individuals being misclassified as recently infected—and mean duration of recent infection (MDRI), average timespan in which subjects are classified as recently infected (Park et al., 2017).
Estimating the onset time of HIV-1 infection is an important task in HIV-1 prevention as it can aid in identifying risk behaviors that lead to transmission. Dating an HIV-1 infection can allow us to detect acute and recent infections, which is beneficial for clinical management including incidence surveillance, antiretroviral therapy (ART) initiation and further transmission prevention. Infection time estimates can be used to infer HIV-1 transmission clusters, which enable us to discover geographic and demographic factors of HIV-1 transmission chains (Brenner et al., 2011). Pinpointing transmission events permits us to monitor and evaluate ongoing prevention efforts. Furthermore, the timing of an infection can be used to identify transmitted viral strains and thereby characterize breakthrough viruses’ phenotypes, guiding next-generation vaccine designs.
The analysis of intrahost HIV-1 gene sequence populations has suggested the potential for molecular dating. Many studies have isolated envelope gene sequences from hundreds of early infected individuals and created mathematical models to estimate days post transmission (Keele et al., 2008; Lee et al., 2009). Furthermore, complexity in sequence diversity resulting from multiple founder variants has been interpreted by the shifted Poisson mixture model (SPMM), estimating the time of infection and number of transmitted/founder variants (Love et al., 2016). HIV-1 diversity measured from next-generation sequencing reads was also used to estimate time since infection (Puller et al., 2017).
We developed a single algorithm that will estimate the rate of HIV-1 incidence and approximate the time of transmission for those recently infected patients. This tool, HIV-1 Incidence and Infection Time Estimator (HIITE), is designed to function in a single cross-sectional survey setting, unveiling the epidemic status at both population and individual levels. We evaluated HIITE’s performance with 890 incident and chronic specimens collected from global cohorts from Africa, America, Asia and Europe, including HIV-1 vaccine trial participants. HIITE is made public as a web-based platform.
2 Materials and methods
2.1 Specimen characteristics
Published HIV-1 envelope gene sequences were collected from 297 chronic specimens (Supplementary Table S1), as previously described (Park et al., 2017). All chronic specimens were reported to have a documented HIV infection of at least 2 years. Supplementary Table S1 presents each specimen’s minimum duration of infection—days from the first HIV positive date, seroconversion or the first sample collection. A total of 144 chronic specimens with full envelope gene sequences and 297 specimens with envelope gene segments (HXB2 7134-7499) were collected, as marked in Supplementary Table S1.
Supplementary Table S2 presents a total of 283 incident specimens comprised of 252 specimens at Fiebig stages I–V and 31 specimens from the Women's Interagency HIV Study (WIHS) with a documented infection of less than 1 year. The estimated time since infection is 17 [13, 28] days for Fiebig stage I, 22 [18, 34] days for II, 25 [22, 37] days for III, 31 [27, 43] days for IV and 101[71, 154] days for V, with a 95% confidence interval (Fiebig et al., 2003; Lee et al., 2009). The minimum and maximum days post-infection were based on HIV-1 negative and positive test dates for the 31 WIHS specimens.
We compiled 194 previously published serial specimens from 43 subjects. Their first specimens were collected within 6 months of transmission (Fiebig stages I–V). This cohort included 179 incident and 5 chronic specimens for full envelope gene sequences and 186 incident and 8 chronic specimens for envelope gene segments (HXB2 7134-7499; Supplementary Table S3). Supplementary Table S3 presents each specimen’s estimated days post infection with a 95% confidence interval.
We analyzed a total of 997 full envelope gene sequences from 116 RV144 HIV vaccine trial participants (49 vaccine and 67 placebo recipients) (Edlefsen et al., 2015; Janes et al., 2015; Rolland et al., 2012). The RV144 trial subject’s vaccine status, subtype, sex and the elapsed time between the last HIV negative test and specimen collection (maximum infection duration) are available at https://www.hiv.lanl.gov/content/squence/HIV/SI_alignments/set12.html, where a total of 124 subjects are listed. We selected 116 incident specimens with five or more envelope gene sequences and an HIV-1 infection duration of less than 2 years (Supplementary Table S4).
Collectively, we analyzed a total of 585 incident specimens and 305 chronic specimens of the envelope gene segment, HXB2 7134-7499. Full envelope gene sequences were available from 547 incident and 149 chronic specimens, as marked in Supplementary Tables S1–S4. More than half of the specimens were subtype B (63%), and subtypes A, C, D and recombinants were also represented (4, 16, 1 and 15%, respectively). Sixty seven percent of samples were from male subjects, 27% from female subjects and sex was not reported for the remaining samples. Subjects’ HIV-1 infection risk factors were reported to be men sex with men (39%), heterosexual (23%), intravenous drug users (IDU) (5%) or unknown (34%). Around 8% of samples were obtained from ART experienced subjects. The proportion of specimens with viral load less than 1000 copies/ml was 3% and that with CD4+ T cell count less than 200 cells/mm3 (AIDS) was 3%.
2.2 HIITE design
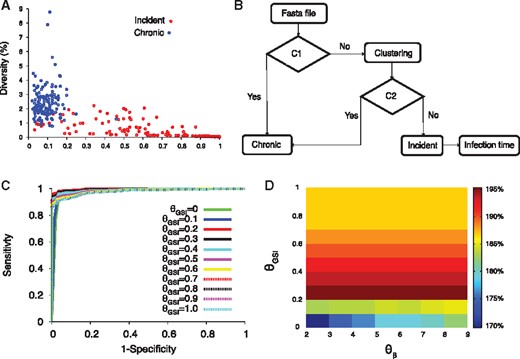
HIITE. (A) GSI and diversity of 252 incident and 144 chronic subjects. The incident subjects were at Fiebig stages I–V and chronic subjects’ documented HIV-1 infection periods were longer than 2 years. (B) Flow chart of HIITE: the condition C1 denotes ‘diversity > ’ and ‘GSI < ’, condition C2 denotes ‘single lineage diversity > ’. (C) The ROC curves for =7 and ranging from 0 to 1. The area under the ROC curve was maximal (0.997) at =7 and =0.2 (solid red curve). (D) The sum of sensitivity and specificity in the plane of and (Color version of this figure is available at Bioinformatics online.)
2.3 Mixed effect model and prediction interval
3 Results
Our goal is to develop a single assay, HIITE, for determining HIV-1 incidence and estimating the time of infection for recently infected individuals. We first considered two metrics: (i) GSI and (ii) diversity. A recent infection was characterized as the presence of sequences with few mutations that was marked by high GSI (Park et al., 2014; 2017). The incidence assay using GSI as a genomic biomarker has demonstrated high precision for HIV incidence assessment, meeting the optimal FRR and MDRI performance standards (Park et al., 2011; 2014; 2017). Additionally, intrahost HIV envelope gene sequences obtained from individuals with a single founder showed linear diversification patterns with quadratic attenuation (Park et al., 2016), demonstrating that the single lineage diversity can be a marker for determining the onset time of an infection.
Figure 1A compared the GSI (GSI4) and diversity of full envelope gene sequences collected from incident and chronic specimens. We compiled 144 chronic specimens whose documented HIV infection was greater than 2 years, and 252 incident specimens acquired within 2 years of infection, at Fiebig stages I–V (see Section 2 and Supplementary Tables S1 and S2). As expected, the chronic specimens were located at the low GSI and high diversity region (Fig. 1A). Therefore, when a specimen’s diversity was greater than and GSI less than , HIITE labeled it as chronic (Fig. 1B).
Chronic specimens with longer evolution period may have a greater diversity than incident specimens. However, when multiple viruses are transmitted, the sequence diversity of incident specimens can be as high as chronic diversity. As shown in Figure 1A, 33 out of 252 (13.1%) incident specimens’ diversity overlapped with the chronic specimens’ diversity, suggesting multiple founder infections. To properly assess multiple founder cases, we measured the ratio of variance to diversity, . At the early infection stage, the Hamming distance distribution of a single founder’s descendants was approximately shown to be a Poisson where (Lee et al., 2009). When was significantly greater than 1, hierarchical agglomerative clustering was used to identify a single lineage where . When the single lineage diversity was greater than , the specimen was classified as chronic, otherwise it was classified as incident (Fig. 1B).
Our next step was to determine a set of threshold values that maximize the sum of sensitivity and specificity, provided that specificity was over 99%. The sensitivity is the proportion of incident specimens that HIITE designates as incident and specificity is the fraction of chronic specimens that HIITE identifies as chronic. Note that the optimal incidence assay performance standards require a less than 1% FRR (100%-specificity) (https://docs.gatesfoundation.org/documents/hiv-incidence-rules-and-guidelines.pdf). The receiver operating characteristic (ROC) analysis showed that the area under the ROC curve was maximal (0.997) at 7 and 0.2 (Fig. 1C and Supplementary Fig. S2). With7 and 0.2, maximized the sum of sensitivity and specificity, given that specificity was over 99%. Figure 1D plots the sum of sensitivity and specificity in the plane of and for . Additionally, we examined the previously published longitudinal specimens from 40 subjects (Supplementary Table S3). Figure 2A plots the single lineage diversity dynamics of this longitudinal sequence data. Here, we used the time interval and increase in single lineage diversity from each subject’s first sample to remove infection time uncertainty. As expected, the diversity increase was highly correlated with days from first sample (Fig. 2A). The correlation coefficient was maximal at 7 (Fig. 2B). Figure 2C plots the single lineage distribution of the 252 incident and 144 chronic specimens with 7, 0.2 and 0.78, resulting in a sensitivity of 96.0% and specificity of 99.3%.
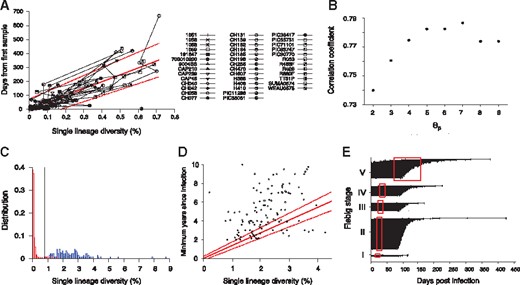
HIITE analysis of full envelope gene sequences. (A) Single lineage diversity dynamics of longitudinal incident specimens from 40 subjects in Supplementary Table S3, who were followed since their first sample, which was taken within 6 months of infection. To remove uncertainty in the timing of infection, the sampling time interval and increase in the single lineage diversity from each subject’s first sample were used. The best fit (solid red line) of the mixed-effects model to the single lineage diversity dynamics is presented along with the 95% prediction interval (dotted red lines). (B) Spearman correlation coefficient between the single lineage diversity difference and time difference for the 40 longitudinally followed subjects in Figure 2A. The correlation coefficient was maximal at 7. (C) With thresholds 7, 0.2, and 0.79, the single lineage diversity distributions of the 252 incident (red) and 144 chronic (blue) specimens resulted in a sensitivity of 96.0% and specificity of 99.3%. (D) The single lineage diversity of 144 chronic specimens is plotted along with each specimen’s minimum documented duration of infection. Around 85% of chronic specimens are located outside the 95% prediction interval in Figure 2A, violating the linear relationship between diversity and infection time. (E) HIITE estimated time since infection of Fiebig stage I–V samples. Among the 252 early infected subjects in Fiebig stages I–V, 12 subjects were misclassified as chronic and excluded. Each individual’s time since infection estimate (black circles), along with 95% prediction interval (black lines), is plotted against the 95% confidence interval for days post infection at each Fiebig stage (red boxes). Subjects at Fiebig stages I/II and II/III were grouped as II and III, respectively. The correlation between Fiebig stage and our estimate was statistically significant (Spearman’s correlation coefficient =0.44, P < 0.001) (Color version of this figure is available at Bioinformatics online.)
To estimate incident specimens’ infection time, we used a mixed effects model to measure the slope of the single lineage diversity dynamics in Figure 2A (see Section 2). The solid red line in Figure 2A denotes the best fit of the linear mixed effects model for longitudinal specimens from 40 subjects. Additionally, to quantify individual sample variability in the diversity-time relationship, we generated a 95% prediction interval from the mixed-effects model, which covers 95% of the data points in the diversity-time plane (Fig. 2A). For example, the single lineage diversity of 0.3% denotes 148 days from infection with the 95% prediction interval of [55–242] days.
Next, we attempted to address whether the mixed effects model fit also holds at chronic stages. The chronic specimens significantly deviated from the 95% prediction interval of the single lineage diversity dynamics where 85% of chronic specimens lied outside of the band (Fig. 2D). The majority of the chronic specimens’ diversity was smaller than the projected diversity from incident stages. This observation suggests that the linear relationship between diversity and infection time is not valid for long-standing infections. Therefore, HIITE designated the stage of infection to be either chronic or incident and estimated the time of infection for those recent subjects.
To cross-validate HIITE’s mixed-effect model estimates regarding time since infection, we used 252 incident specimens in Fiebig stages I–V in Supplementary Table S2. We compared HIITE’s time since infection estimates to Fiebig stage estimates. HIITE correctly classified 240 specimens as incident and all these specimens’ 95% prediction interval, except for one, overlapped with their respective Fiebig stage’s 95% confidence interval. Figure 2E showed the estimated time since infection with the 95% prediction interval grouped in Fiebig stages I–V. Additionally, the correlation between Fiebig stage estimates and our estimates was statistically significant (Spearman’s correlation coefficient =0.44, P < 0.001).
To examine HIITE’s viability in a resource-limited setting, we evaluated its performance using an envelope gene segment (∼400 nucleotide base long). The genomic assay’s applicability for routine use in cross-sectional surveys can be maximized by utilizing next-generation sequencing platforms that are optimized for 300–500 base long sequencing (Park et al., 2014). We compiled 11 577 envelope gene segments (HXB2 7134-7499) of 297 chronic and 283 incident specimens (Supplementary Tables S1 and S2). As observed in the full envelope gene analysis in Figure 1A, the chronic and incident specimens showed a disparity in the plane of GSI1 and diversity (Fig. 3A). With , and , the 297 chronic and 283 incident specimens showed 84.1% sensitivity and 99.3% specificity. The HXB2 7134-7499 segment estimated a shorter time since infection than that of the full envelope gene, for a given single lineage diversity. For instance, when the segment’s diversity was 0.3%, time since infection was estimated to be 86 days, whereas the full envelope gene estimate was 148 days. This can be explained from the fact that the segment encompasses V3 and V4 loops and thus presents a greater level of diversification in a given evolution time, as compared to the full envelope gene. In addition, the HXB2 7134-7499 segment presented a wider 95% prediction band than the full envelope analysis (Figs. 2A and 3B).
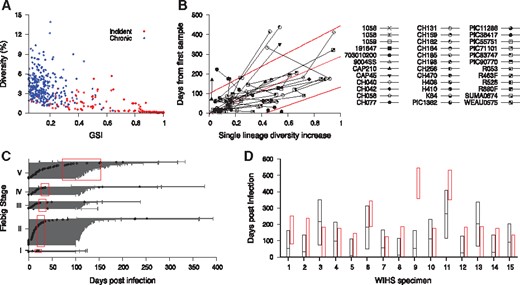
HIITE analysis of HXB2 7134-7499 segment sequences. (A) GSI and diversity of HXB2 7134-7499 segment specimens obtained from 283 incident and 297 chronic subjects in Supplementary Table S1 and S2. (B) Single lineage diversity increase and days from first sample for the 36 longitudinal subjects in Supplementary Table S3. The best fit (solid red line) of the mixed-effects model to the single lineage diversity dynamics is presented along with the 95% prediction interval (dotted red lines). (C) HIITE estimated time since infection of 223 Fiebig stage I–V samples. Each individual’s time since infection estimate (black circles) and its 95% prediction interval (black lines) are plotted against the 95% confidence interval for days post infection at each Fiebig stage (red boxes). The 95% prediction intervals of all but four specimens overlapped with Fiebig stage 95% confidence intervals. The correlation between Fiebig stage and our estimate was statistically significant (Spearman’s correlation coefficient =0.31, P < 0.001). (D) HIITE’s time since infection estimates (black horizontal lines) and 95% prediction intervals (black boxes) for 15 WIHS specimens classified as incident. The infection time intervals obtained from each specimen’s HIV-1 negative and positive test dates are plotted by red boxes. HIITE estimates overlapped with all specimens’ documented infection time intervals, except for specimen 9. WIHS specimen 1 is from subject TY2947, 2 from JG8930, 3 from JY3080, 4 from SS0342, 5 and 6 from RH7057, 7 from VE6375, 8 and 9 from EJ7211, 10 from TI9054, 11 and 12 from GE6106, 13 from OY9080, 14 from DA1342, and 15 from SI1392 (Supplementary Table S2) (Color version of this figure is available at Bioinformatics online.)
The correlation coefficient between Fiebig stage estimates and HIITE estimates was 0.31 (P < 0.001) for the HXB2 7134-7499 segment. The 95% prediction intervals of all but four incident specimens overlapped with Fiebig stage 95% confidence intervals (Fig. 3C). Only one out of 15 WIHS specimens classified as incident showed a deviation from the documented infection time interval (Fig. 3D). In summary, more incident specimens were misclassified when HIITE used the HXB2 7134–7499 segment rather than full envelope gene, resulting in reduced sensitivity (84.1% versus 96.0%). However, HIITE's time since infection estimate remained highly consistent with Fiebig stage and documented infection duration.
HIITE’s performance was further cross validated with specimens collected from an HIV vaccine trial. HIITE was applied to 49 vaccinee and 67 placebo participants of the RV144 trial (Rolland et al., 2012). Having the records of each subject’s last HIV-1 negative test date permitted us to examine whether the HIITE prediction conformed to this record (Fig. 4A). Using full envelope gene sequences, our assay classified 7 out of 116 incident subjects as chronic. This resulted in 94% sensitivity (Supplementary Fig. S3), which is in agreement with the 96% sensitivity measured from the 252 incident specimens in Supplementary Table S2. We exemplified a subject with two founder variants, which HIITE successfully clustered as two different lineages (Supplementary Fig. S4). The 95% prediction interval of 11 subjects’ estimated time of infection was located outside each subject’s maximum duration of infection (Fig. 4A). By adding 7 subjects who were misclassified as chronic to these 11 subjects, the prediction error for time since infection was 16% (Supplementary Fig. S3).
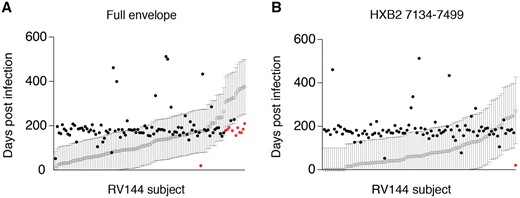
HIITE’s performance on vaccinated subjects and placebo recipients of RV144 vaccine trial. (A) HIITE estimated the time since infection (open circle) and 95% prediction interval (black line) for 109 RV144 trial participants who are denoted as incident by HIITE. Days from each subject’s HIV negative test date is marked by a filled black or red circle. Circles in red indicate cases which fell outside of the predicted interval. Out of the 109 subjects, 11 subjects’ 95% prediction interval was located outside each subject’s documented maximum duration of infection (marked by red dots). (B) The segment HXB2 7134-7499-based estimates on time since infection (open circle) with 95% prediction interval (black line) for the 96 RV144 vaccine trial participants HIITE classified as incident. Each subject’s days from last HIV-1 negative sample is denoted by a filled circle (Color version of this figure is available at Bioinformatics online.)
Next, we further examined the seven cases that HIITE misclassified as chronic. As depicted in Supplementary Figure S5, these subjects showed high level of diversity resulting in chronic classification. Although subject AA037 showed a pattern of multiple founder variants, HIITE did not perform clustering on this specimen since it was classified as chronic by condition 1, C1 in Figure 1B. Our assay was tuned to provide less than 1% FRR (over 99% specificity) in order to avoid extraneous clustering, which would have misclassified chronic samples as incident.
We next compared vaccinated subjects with placebo recipients of the RV144 trial. We found no differences among their maximum infection duration (Wilcoxon rank sum test, P = 0.57), diversity (P = 0.19), GSI (P = 0.21) and variance (P = 0.40). When we compared 48 vaccinated subjects with 61 placebo subjects classified as incident, time since infection provided by HIITE also did not differ (P = 0.58).
Figure 4B showed HIITE’s prediction of time since infection for 96 RV144 trial participants classified as recent, using HXB2 7134-7499 segment. This segment showed 83% sensitivity and 18% prediction error for time since infection (Supplementary Fig. S3). These segment-based time since infection estimates were significantly correlated with the full envelope gene-based estimates (Spearman’s correlation coefficient =0.56, P < 0.001), as shown in Supplementary Figure S3.
Table 1 summarized the overall performance of HIITE using all incident and chronic specimens examined in this study. For the full envelope gene, 547 incident specimens and 149 chronic specimens showed a FRR of 0.67% [0% –2.0%], MDRI of 492 [404–582] days, sensitivity of 94.0% [92.0%–95.8%] and prediction error for time since infection of 13.5% [10.8%–16.5%]. For the envelope gene segment HXB2 7134-7499, 585 incident specimens and 305 chronic specimens showed a FRR of 0.66% [0%–2.0%], MDRI of 358 [312–418] days, sensitivity of 83.1% [80.0%–86.0%] and prediction error for time since infection of 19.8% [16.6%–23.1%]. Additionally, we conducted k-fold cross validation by dividing all the incident and chronic specimens into four subsets, respectively. To clearly separate out test data from training set, one of the four sub-sets was used as the test data and the other three were used as the training set for HIITE. We repeated this process such that each subset was independently used as the test data. Supplementary Table S5 shows the algorithm performance averaged over the four test sets. HIITE is available as an online web tool, and its web interface, backend workflow and data processing are presented in Section 2 and Supplementary Figure S1.
HIITE performance
| Full envelope (547 incident and 149 chronic) | HXB2 7134-7499 (585 incident and 305 chronic) | |
|---|---|---|
| FRR | 0.67% [0%–2.0%] | 0.66% [0%–2.0%] |
| MDRI | 492 [404–582] days | 358 [312–418] days |
| Sensitivity | 94.0% [92.0%–95.8%] | 83.1% [80.0%–86.0%] |
| Prediction error for time since infection | 13.5% [10.8%–16.5%] | 19.8% [16.6%–23.1%] |
The 95% confidence intervals were obtained by sampling specimens with replacement.
4 Discussion
We developed a single assay, HIITE, to detect incident infections and estimate days post infection. HIITE’s innovation is implementing the metrics of HIV-1 envelope gene sequences in order to concurrently inform the stage of infection and time since infection for incident cases. The precision of HIITE is unprecedented, meeting optimal incidence assay performance standards of less than 1% of FRR and 1 year of MDRI. HIITE achieved a sensitivity of 94% (full envelope gene) and 83% (HXB2 7134-7499 segment). This high level of precision was achieved by estimating the single lineage diversity of specimens originating from multiple founder variants.
HIITE takes empirical approaches to estimate time since infection from one individual’s HIV-1 envelope gene sequence population. The main driving force for HIV diversification is random errors made by viral reverse transcriptase (Mansky and Temin, 1995). In addition, heavy immune pressure (Boutwell et al., 2010; Liao et al., 2013; McMichael et al., 2010; Richman et al., 2003), viral recombination and APOBEC3G/F-mediated hypermutation (Simon et al., 2005) collectively contribute to heterogeneous HIV diversification patterns, resulting in variable evolution rates across individuals. A mixed effects model was used to properly assess the variation of the relationship between viral diversity and time of infection across individuals.
HIITE’s design and validation were formulated by congregating diverse HIV-1 sequences from global cohorts from Africa, America, Asia and Europe. These global cohorts represented a diverse array of subtypes, risk behaviors, viral loads and CD4 T cell counts. In the designing step, HIITE’s algorithm and parameters were determined by examining hundreds of documented incident and chronic specimens. HIITE was then validated with specimens previously collected from RV144 vaccine trial participants. These globally accumulated HIV-1 sequence datasets enabled us to develop a single assay that simultaneously estimates HIV-1 incidence and infection time, which is available to the public via a web-based software application.
One of HIITE’s advantages is providing the epidemic’s valuable information at the population level and at the individual level. At the population level, precise incidence assessment strengthens epidemic monitoring efforts and guides strategy optimization for prevention and intervention programs. Once HIITE measures the number of individuals classified as incident and chronic from a cross-sectional survey, the rate of incidence is determined as a function of these measures and the assay’s FRR and MDRI (Kassanjee et al., 2012). At the individual level, revealing the timing of HIV-1 transmission facilitates optimal clinical management, including ART initiation, risk behavior assessment and further transmission prevention. Additionally, infection time estimates can be used to identify key populations largely responsible for epidemic spread (Peitzmeier et al., 2015) and thereby infer HIV-1 transmission clusters. This in-depth epidemic illustration allows us to discover detailed geographic and demographic factors of HIV-1 transmission chains.
HIITE faces considerable challenges for its routine-use in cross-sectional surveys. First, it is not viable to sequence plasma specimens from virally suppressed ART subjects and elite controllers. Thus, an alternative algorithm such as proviral DNA sequencing can be sought to isolate genomic signatures. Second, incidence determination at the population level requires additional epidemic considerations as the assay performance may vary across different subpopulations. For instance, HIITE’s sensitivity regarding viral subtype needs to be examined with more diverse subtype specimens. The majority of our incidence specimens (∼97.5%) were obtained within 1 year of infection. Inclusion of more late-recent specimens collected from 1 to 2 years since infection can potentially result in the decrease of HIITE’s sensitivity. Third, assay-specific factors, including cost and regulatory requirements, ought to be evaluated as a pre-requisite for HIITE to be employed in cross-sectional surveillance. To reduce sequencing cost, next-generation sequencing methods can be implemented. In order to minimize sequencing errors of long-read next-generation sequencing methods, unique barcodes can be assigned to each HIV-1 cDNA template prior to PCRs and obtain a consensus sequence from the reads with the same barcode (Kivioja et al., 2012).
HIITE is the first assay to simultaneously inform two key metrics, HIV-1 incidence and infection time, in a highly precise manner. HIITE suggests a potential paradigm shift from host signal-based surveys to viral signal-based surveys, advancing HIV-1 prevention/intervention efforts.
Acknowledgements
We thank Dr. James Mullins (supported by P30AI027757) for providing the published sequence data from the RV144 trial. We thank Victoria Seraphim and Emily Johnson for reviewing this manuscript.
Funding
This work has been supported by the National Institutes of Health: National Institute of Allergy and Infectious Diseases [grant nos. R01 AI095066 and AI083115].
Conflict of Interest: none declared.
References

