


Abstract
Despite the potential usefulness, the association analysis of gene expression with interval times of two events has been hampered because the occurrence of events can be censored and the conventional survival analysis is not suitable to handle two censored events. However, the recent advances of multivariate survival analysis considering multiple censored events together provide an unprecedented chance for this problem. Based on such advances, we have developed a software tool, GAIT, for the association analysis of gene expression with interval time of two events.
The performance of GAIT was demonstrated by simulation studies and the real data analysis. The result indicates the usefulness of GAIT in a wide range of biomedical applications.
Supplementary data are available at Bioinformatics online.
1 Introduction
In high-throughput genomic analysis, it is an interesting problem to find genomic signatures associated with the interval time between two events of interest. This problem can arise from between progression and death of cancer patients (Mulligan et al., 2007), and also from the recovery events of different organ systems in intensive care units (Cuschieri et al., 2012). Especially, accumulated electronic health records encourage to analyze multiple events of a patient together. However, the analysis with the interval times of multiple events is often complicated by censored samples, where the occurrences of either one of or both events are not observed. Censoring is considered well in the conventional genomic survival analysis for a single event. The association between gene expression and event times is evaluated based on well-established statistical models such as proportional hazard and accelerating failure time models (Oakes, 2001), and many software tools for the single event analysis have been introduced (Smyth, 2005; Tusher et al., 2001). However, they are not suitable to handle multivariate data of two events with censoring, and fail to provide the examination for gene expression associated with interval times.
In this work, we introduce a software tool, GAIT (Gene expression Analysis for Interval Time), to estimate the statistical significances of associations between gene expression signatures and interval times between two events in the presence of censoring. GAIT is based on a recent advance in multivariate survival analysis that robustly and accurately provides a non-parametric Bayesian estimate for the probability distribution of times to multiple events (Seok et al., 2014). The usefulness of GAIT is demonstrated by simulation and case studies.
2 Materials and methods
GAIT analyzes the association of gene expression indices with interval times through three steps (see Supplementary Methods for the details). First, given times to two events of interest with censoring statuses, GAIT calculates the joint probability density distribution of the event times based on the multivariate survival analysis of Seok et al. (2014). Second, GAIT calculates the conditional expected interval time given the observed censored data for each sample. If two events are non-censored, the interval time is determined. However, if one or both of two events are censored, the interval time has a conditional probability distribution according to the observed data. Although it is theoretically possible to obtain the conditional distribution of the interval times from the joint distribution of the first step, the actual software implementation is not easy. Instead, GAIT randomly generates samples from the estimated joint distribution and empirically estimates the expected interval times. Finally, GAIT calculates the statistical significances for the association between gene expression indices and the expected interval times using simple linear regression models. The expected interval times are linearly regressed by expression indices of a gene, and the slope of the regression line is tested against zero-slope under a t-distribution.
3 Simulation and case studies
To demonstrate the usefulness of GAIT, we performed simulation studies and compared GAIT with other methods. The detail procedures are described in Supplementary Methods. Bivariate censored data were randomly generated from additive exponential distributions, log-normal distributions and clayton models, followed by the setting of multivariate survival analysis simulations (Seok et al., 2014). We considered genomic data with 1000 genes, among which 100 genes were highly correlated with true interval times between two events. Two sets of 100 genes were highly correlated with times to each event, respectively. The expression signatures of the rest 700 genes were randomly generated. The 100 genes correlated with interval times were considered as positives to be detected. From the analysis, the significance of the association of a gene was measured by a P-value. Genes with P-values less than a pre-defined threshold were detected as positives, and by changing the threshold, ROC curves and AUCs were obtained. For each simulation setting, simulations were performed with 500 samples and repeated by 100 times. GAIT was compared with multi-state models (Jackson, 2011) and univariate analyses based on Cox proportional hazard models as well as two naïve methods, one is ignoring censoring by considering censored samples as non-censored samples and the other is the analysis with only non-censored samples. As shown in Figure 1A and B and Table 1, GAIT achieved high detection powers for truly associated genes with more than 0.9 AUCs in all of the three simulation settings, which is a significant improvement from the compared methods. The detail results in other settings are shown in Supplementary Figures S1–S4. In addition, we performed simulations with structured gene expression where genes are randomly correlated to each other. GAIT also shows superior performance in this setting as shown Supplementary Figures S5–S7 and Supplementary Table S1.
The average AUCs in three simulation settings
| GAIT | T1 | T2 | Ignore censoring | Without censoring | MSM | |
|---|---|---|---|---|---|---|
| Exp | 0.92 | 0.61 | 0.80 | 0.76 | 0.83 | 0.81 |
| Log-N | 0.95 | 0.62 | 0.88 | 0.89 | 0.84 | 0.89 |
| Clayton | 0.94 | 0.67 | 0.67 | 0.89 | 0.89 | 0.78 |
| GAIT | T1 | T2 | Ignore censoring | Without censoring | MSM | |
|---|---|---|---|---|---|---|
| Exp | 0.92 | 0.61 | 0.80 | 0.76 | 0.83 | 0.81 |
| Log-N | 0.95 | 0.62 | 0.88 | 0.89 | 0.84 | 0.89 |
| Clayton | 0.94 | 0.67 | 0.67 | 0.89 | 0.89 | 0.78 |
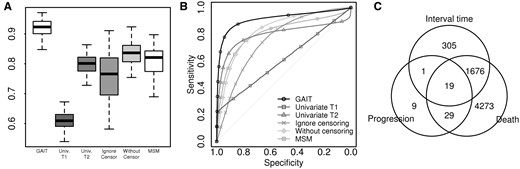
(A) AUC distributions and (B) the average ROC curves of GAIT and compared methods from 100 simulations in the additive exponential setting. (C) Genes significantly associated with interval times between progression to death found by GAIT as well as genes associated with single events of progression and death found by univariate analyses
We also applied GAIT for the gene expression data of multiple myeloma patients who experienced progression and death (GSE9782) (Mulligan et al., 2007). GAIT found 2001 genes significantly associated with the interval time from progression to death (P-value < 0.05), and 305 genes among 2001 genes were unique findings that were not detected by conventional univariate analyses (Fig. 1C). The functional analysis with the uniquely found genes (Subramanian et al., 2005) suggested the role of cell-cycle related genes, which might be useful to discover the process from progression to death (Supplementary Table S2).
4 Conclusion
GAIT has been developed for selecting the significant genes associated with the interval time of two events, and its usefulness was evaluated by simulation and case studies. We expect that GAIT will be helpful for gene expression analysis of many biomedical applications.
Funding
This work has been supported by the grant from National Research Foundation of Korea funded by Korea government (NRF-2017R1C1B2002850).
Conflict of Interest: none declared.
References

