


Abstract
We present a web server running the MIIC algorithm, a network learning method combining constraint-based and information-theoretic frameworks to reconstruct causal, non-causal or mixed networks from non-perturbative data, without the need for an a priori choice on the class of reconstructed network. Starting from a fully connected network, the algorithm first removes dispensable edges by iteratively subtracting the most significant information contributions from indirect paths between each pair of variables. The remaining edges are then filtered based on their confidence assessment or oriented based on the signature of causality in observational data. MIIC online server can be used for a broad range of biological data, including possible unobserved (latent) variables, from single-cell gene expression data to protein sequence evolution and outperforms or matches state-of-the-art methods for either causal or non-causal network reconstruction.
MIIC online can be freely accessed at https://miic.curie.fr.
Supplementary data are available at Bioinformatics online.
1 Introduction
The reconstruction of graphical models has become ubiquitous to analyze the rapidly expanding, information-rich data of biological interest. However, to date, all available network reconstruction servers are restricted to specific types of data and make an a priori choice on the causal or non-causal nature of the underlying model, such as BNW (Ziebarth et al., 2013) performing Bayesian Network reconstructions, LEGUMEGRN (Wang et al., 2013) learning directed regulatory networks or EVFOLD (Marks et al., 2011) and DCA (Morcos et al., 2011) predicting undirected protein contact interactions from amino acid homologous sequences.
MIIC online server aims to fill this gap by learning the most appropriate causal, non-causal or mixed graphical model from the available data. MIIC can be used for a broad range of biological data, from single-cell transcriptomics or genomic alterations in tumor progression to long term evolution of proteins and genomes (Fig. 1 and Supplementary Figs S1–S4 and Verny et al., 2017). MIIC online server is outlined below with more detailed information available in Supplementary Material and online Tutorial and User Guide documentation available at https://miic.curie.fr.
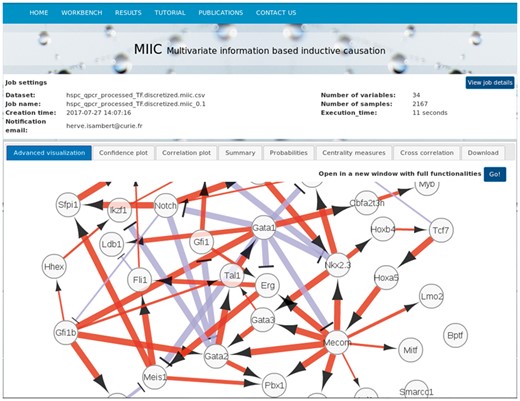
View of MIIC online output page with a network visualization. It corresponds to a zoom of a regulatory network reconstructed from single-cell expression data from haematopoietic stem cell differentiation, Hamey et al. (2017), see full network in Supplementary Figure S2
2 Materials and methods
2.1 MIIC algorithm
Multivariate Information-based Inductive Causation (MIIC) algorithm relies on a novel information-theoretic method that combines constraint-based learning approach and maximum likelihood framework (Affeldt and Isambert, 2015; Affeldt et al., 2016; Verny et al., 2017). Starting from a fully connected graph, MIIC iteratively removes dispensable edges, by uncovering significant information contributions from indirect paths, and orients the remaining edges, based on the signature of causality in observational data. MIIC also provides an edge specific confidence assessment of retained edges. The approach outperforms traditional search-and-score and constraint-based methods on a broad range of benchmark networks (Affeldt and Isambert, 2015; Affeldt et al., 2016; Verny et al., 2017). It achieves significantly better results with much fewer samples and is typically ten to hundred times faster than existing methods taking into account the causal effects of unobserved latent variables (Verny et al., 2017).
2.2 MIIC online input and main options
MIIC online pipeline (Supplementary Fig. S1) is a web interface for the MIIC algorithm. The Workbench is used to upload the user’s dataset formatted as a table with variable names specified as column names (or row names). This is the only required input to reconstruct a network using basic (default) settings.
2.2.1 Algorithm advanced parameters
This section allows the user to specify the following parameters: (i) , the effective number of independent samples in the submitted dataset (also estimated by MIIC itself, see below), (ii) Complexity criterion, either Minimum Description Length/Bayesian Information Criterion (MDL/BIC) or Normalized Maximum Likelihood (NML; Affeldt et al., 2016), (iii) Orientation step (optional), orienting ‘v-structures,’ (iv) Propagation step (optional), if the orientation step is performed and (v) latent variables, to take into account or ignore the causal effects of unobserved (latent) variables (Verny et al., 2017).
2.2.2 Supplementary files
Supplementary Material can be uploaded (optional), in particular, to exclude specific edges based on prior knowledge, to provide a user-defined network layout (x, y co-ordinates of nodes) or to provide an order of categorical (non-numerical) variables for assigning edge signs based on correlations or causal effects between variables.
2.2.3 Confidence cut
A threshold can be provided (default ) to filter retained edges based on their confidence estimated over a number of randomizations of the available data (default 100 randomizations).
3 Results
3.1 MIIC online output: visualization and analysis
Once the learning process is finished, the web server redirects the user to the results page, which contains several sections, displaying the network and reporting some analysis. The Advanced visualization tab uses a web-embedded Cytoscape display to visualize and interactively rearrange the resulting network. It is also possible to open a new browser tab (‘Go!’ button) to visualize and filter network edges based on their residual (partial) correlation or edge-specific confidence and save the graph visualization in various formats. The Summary tab contains all the processed information on each retained or deleted edges. The Probabilities tab contains information relative to the orientation and propagation steps of the network reconstruction and is relevant for a quantitative analysis of the causal relations in the data (Supplementary Material). The Centrality measures tab provides a topological analysis of the network using graph theoretical measures. The Cross correlation tab displays a plot of the sample cross-correlation decay along with an exponential test. In the presence of correlation biases between successive samples, a warning message is displayed on the results page and an estimate of the effective number of independent samples, , is used to reconstruct a more reliable network model (Verny et al., 2017). The Download tab allows to download all the results associated with a network reconstruction.
3.2 Examples of causal versus non-causal networks
3.2.1 Gene regulatory network in haematopoiesis
This first example concerns the reconstruction of a regulatory network from 2167 single-cell gene expression profiles of blood stem cells from (Hamey et al., 2017), see Supplementary Material. Figure 1 displays MIIC online results page with a zoomed view of the regulatory network including 34 transcription factors, see full network in Supplementary Figure S2. MIIC predicted network exhibits a number of known central regulators such as MECOMEVI1, GATA1 and GATA2, with regulatory interactions documented in the literature, such as MECOMPBX1, MECOMGATA2 and GATA2TAL1SCL, see Supplementary Material for details. Note, in particular, that nearly all predicted edges are directed, as expected for a transcriptional regulatory network, with red edges indicating gene activation and blue edges indicating gene repression regulations.
3.2.2 Protein undirected contact map
In contrast, the second example concerns an inherently non-causal network corresponding to the physical contact map of amino acid residues within a protein structure reconstructed from 12 533 aligned homologous sequences of an abundant protein domain family: the response regulator receiver domain (Pfam code PF00072). MIIC contact prediction results are presented in Supplementary Figures S3 and S4 and provide similar accurate predictions of the protein contact map, without a priori choice or bias on the causal or non-causal class of reconstructed networks, as compared with the state-of-the-art method for protein contact prediction, PlmDCA Ekeberg et al. (2013), although MIIC performance on protein structures with fewer homologous sequences is found to be less accurate, Supplementary Figure S5.
Funding
This work has been supported by the Labex celtisphybio and Region IdF.
Conflict of Interest: none declared.
References
Author notes
Present address: LIPADE, Department of Mathematics and Computer Science, University of Paris Descartes, 45 rue des Saints Pères, Paris, France

