


Abstract
Template-based modeling, including homology modeling and protein threading, is a popular method for protein 3D structure prediction. However, alignment generation and template selection for protein sequences without close templates remain very challenging.
We present a new method called DeepThreader to improve protein threading, including both alignment generation and template selection, by making use of deep learning (DL) and residue co-variation information. Our method first employs DL to predict inter-residue distance distribution from residue co-variation and sequential information (e.g. sequence profile and predicted secondary structure), and then builds sequence-template alignment by integrating predicted distance information and sequential features through an ADMM algorithm. Experimental results suggest that predicted inter-residue distance is helpful to both protein alignment and template selection especially for protein sequences without very close templates, and that our method outperforms currently popular homology modeling method HHpred and threading method CNFpred by a large margin and greatly outperforms the latest contact-assisted protein threading method EigenTHREADER.
Supplementary data are available at Bioinformatics online.
1 Introduction
Computational protein structure prediction remains one of the most challenging problems in structural bioinformatics and has been extensively studied in the past decades (Baker and Sali, 2001; Bowie, et al., 1991; Dill and MacCallum, 2012; Jones, et al., 1992). Template-based modeling (TBM), including homology modeling and protein threading, is a popular method for protein 3D structure prediction, enjoying increasing success as both protein sequence and structure databases expand (Cheng, 2008; Ma, et al., 2013; Peng and Xu, 2010; Yang, et al., 2011). TBM is based upon the observation that many proteins share similar structures even if their sequences diverge (Kinch and Grishin, 2002; Zhang and Skolnick, 2005). The quality of TBM critically depends on accurate sequence-template alignment and correct template recognition, both of which are challenging when only distantly-related templates are available for a protein sequence under prediction (Cozzetto and Tramontano, 2004; Hou, et al., 2018; Jo, et al., 2015; Jones, 1997; Peng and Xu, 2011a; Peng and Xu, 2011b; Zhu, et al., 2017).
The accuracy of homology modeling and protein threading relies on a scoring function composed of sequence and structure features (Xu, et al., 2003; Zhou and Zhou, 2004). Existing methods such as HHpred (Soding, 2005), SPARKS-X (Yang, et al., 2011), BoostThreader (Peng and Xu, 2009) and CNFpred (Ma et al., 2012; Ma et al., 2013) employ a scoring function mainly composed of sequential information such as sequence profile, secondary structure and solvent accessibility. Pairwise information such as contact potential and predicted contacts/distance have been attempted by a few methods including PROSPECT (Xu and Xu, 2000), RAPTOR (Xu et al., 2003), MRFalign (Ma et al., 2014), EigenTHREADER (Buchan and Jones, 2017) and map_align (Ovchinnikov, et al., 2017). Specifically, PROSPECT and RAPTOR make use of contact potential; MRFalign makes use of inter-residue distance predicted by a shallow neural network from mutual information and sequence profile (Zhao and Xu, 2012); EigenTHREADER makes use of contacts predicted by MetaPSICOV (Jones, et al., 2015) from direct co-evolution and sequential information; map_align makes use of contacts derived from pure direct co-evolution analysis. Nevertheless, since they are very noisy, the pairwise information used by PROSPECT, RAPTOR and MRFalign only yield incremental improvement. The predicted contacts used by EigenTHREADER and map_align are less noisy, but the accuracy improvement by EigenTHREADER and map_align over existing methods is not very significant due to: (i) their predicted contacts are not accurate enough especially when query proteins do not have many sequence homologs, and (ii) they do not make good use of sequential information, which are important even for threading on distantly-related templates. Neither EigenTHREADER nor map_align has been systematically tested on proteins without many sequence homologs.
Very recently, deep learning (DL) has greatly improved inter-residue contact prediction by integrating residue co-evolution information, contact occurrence patterns and sequential features (Wang et al., 2017). This DL-based method works well for contact prediction and contact-assisted folding even if query proteins do not have many sequence homologs. Inspired by this, we would like to study if we can improve protein threading by a similar strategy. More specifically, we will first adapt the DL method to predict inter-residue distance for query proteins and then employ the predicted inter-residue distance to protein threading by integrating it with ‘classical’ sequential features. To fulfill this, we developed a new protein threading method called DeepThreader that adopts both sequential features and predicted inter-residue distance in building sequence-template alignment and selecting templates. Experimental results show that this new method generates better protein alignment and recognizes better templates than currently popular threading and homology modeling methods such as HHpred and CNFpred. DeepThreader greatly outperforms the latest contact-assisted protein threading method EigenTHREADER, regardless of the similarity between query protein and templates and the number of sequence homologs available for the query protein.
2 Materials and methods
2.1 Protein features and distance labels
We use both sequential features and pairwise features for query protein and templates. More specifically, for a template, the sequential features include sequence profile, native secondary structure and solvent accessibility, whereas the pairwise feature is its native inter-residue distance. For a query protein, we use sequence profile, predicted secondary structures and solvent accessibility, and predicted inter-residue distance. Here inter-residue distance is defined as the Euclidean distance between two Cβ atoms and discretized into 12 intervals: <5 Å, 5-6 Å, …, 14-15 Å, and >15 Å.
2.2 Predicting inter-residue distance for query proteins
We use the same DL method described in (Wang et al., 2017) to predict inter-residue distance distribution for a query sequence. The only difference is that the goal in (Wang et al., 2017) is to predict the probability of two residues forming a contact while here we predict the distance distribution of any two residues. In particular, for contact prediction only 2 labels are involved while for distance prediction 12 labels (intervals) are involved. The DL model for distance prediction is trained using exactly the same training procedure, training set and validation data as that for contact prediction. We also use the same input features for this DL model, including sequential features (e.g. sequence profile and predicted secondary structure) and direct co-evolution information generated by CCMpred (Seemayer et al., 2014). Summing up the predicted probability values of the first four distance intervals [falling into (0, 8 Å)] and using the resultant summation as contact probability, our DL method for distance prediction has the same contact prediction accuracy as reported in (Wang et al., 2017). This verifies that predicted distance has at least the same accuracy as predicted contacts. Nevertheless, predicted distance provides a finer-grained information than predicted contacts. See the Supplementary Material for more detailed evaluation of distance prediction. This DL algorithm is implemented with Theano and Python and runs on GPUs while the other components of DeepThreader is implemented with C/C++ and runs on CPUs.
2.3 Scoring a sequence-template alignment
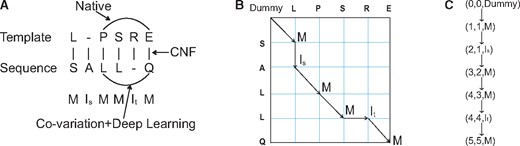
Illustration of sequence-template alignment. (A) Alignment can be represented as a sequence of three states (M, Is, It). Both sequential (through CNF) and pairwise information (through co-variation and DL) are used in generating alignment. (B) An alignment corresponds to a path in the alignment matrix. (C) An alignment path is a set of triples consisting of two residue indices and one alignment state
2.3.1 Singleton alignment potential
Singleton alignment potential quantifies how well to align a sequence residue to a template residue, which is derived from the sequential features of the query sequence and template. Given an alignment path, its singleton potential is the accumulative potential of all the vertices along the path. We use exactly the same singleton potential employed by CNFpred, the threading program underlying the RaptorX server (Kallberg et al., 2012). Please see (Ma et al., 2012, 2013) for more details about CNFpred and its scoring function.
2.3.2 Pairwise alignment potential
2.4 Optimizing scoring function by ADMM
Next we split Equation (4) into two sub-problems, and solve them iteratively using the Viterbi algorithm (Forney, 1973). Briefly, the whole algorithm has the following main steps:
Use the Viterbi algorithm to build an initial sequence-template alignment without using pairwise potential and apply such an alignment to initialize and.
Fixing , Equation (4) can be represented as a linear function of [noticing that . Use the Viterbi algorithm to maximize Equation (4) to update . This will generate a new alignment formed by .
Fix and similarly use the Viterbi algorithm to maximize Equation (4) to update . This will generate a new alignment formed by .
If are very close to each other, stop and use as the final alignment. Otherwise, update as the length of the latest alignment and repeat steps (ii) and (iii).
2.4.1 K-band Viterbi algorithm
The Viterbi algorithm used in steps 2 and 3 has a running time proportional to the product of protein lengths. In order to speed up, we restrict the search space in these steps by a band of size . Specifically, in step 2, we restrict the search space of within a neighborhood of . Supposing , i.e. in alignment z, template residue is aligned to query residue , we enforce that in , residue can only be an insertion or aligned to one of the query residues: , , …, , …, , . Let be the non-insertion template residue that is the closest to along the template primary sequence. When template residue is an insertion in , we enforce that in , can only be an insertion or aligned to the same set of query residues that can be aligned by . Similarly, we restrict the search space of within a neighborhood of in step iii. When is relatively small, we can greatly speed up steps (ii) and (iii) and thus the whole algorithm. See Sub-Section 3.6 for the impact of band size on the model quality and running time.
2.5 Training and test data
2.5.1 Training data
The threading algorithm itself does not need training; however, we need to train a DL model to predict inter-residue distance from sequential features and co-evolution information. We train such a DL model using exactly the same way described in (Wang et al., 2017). In particular, the training and validation data are subsets of PDB25 generated by PISCES (Wang and Dunbrack, 2003) in 2015. Any two proteins in PDB25 share less than 25% sequence identity. In total, we use ∼6300 proteins for training and 400 for validation.
2.5.2 Test data
We used two sets of query proteins to test our threading algorithm. The first set (denoted as Test500) consists of 500 proteins randomly sampled from PDB25, in which any protein has sequence identity <25% and BLAST E-value >0.1 with both training and validation proteins. Since we generated multiple sequence alignments for proteins in Test500 using an NR sequence database dated in 2015, about 40% of the proteins in Test500 have fewer than 500 effective sequence homologs. In contrast, most of the 150 test protein families used by EigenTHREADER have more than 1000 effective sequence homologs.
The second test set consists of 86 officially-defined CASP12 target domains released in 2016. The CASP12 data are divided into three groups by difficulty level: FM, FM/TBM and TBM. FM targets are hard to predict while TBM targets are easier. We used the uniprot20 sequence database (dated in 2015 and 2016) to generate multiple sequence alignments for the CASP12 proteins. About 63% of the CASP12 domains have fewer than 500 effective sequence homologs. Further, the median number of effective sequence homologs for the FM domains is only 58. See our paper (Wang et al., 2018) for the detailed analysis of the contacts predicted by our DL method for the CASP12 domains. Among the 86 domains, 64 have BLAST E-value > 0.1 with our training and validation proteins for distance prediction. These 64 domains form a new test set.
To test DeepThreader, we use PDB40 created before CASP12 as the template database, which has 30 874 proteins with solved structures. Any two proteins in PDB40 share less than 40% sequence identity.
Test data for alignment accuracy. For each query protein in Test500, we use a structure alignment program DeepAlign (Wang et al., 2013) to identify top 30 similar templates in PDB40 (excluding the query protein itself), from which we randomly select two templates and match each of them with the query protein to form a sequence-template pair. Overall, we obtain 1000 sequence-template pairs to test the alignment accuracy.
Test data for threading performance. The proteins in both Test500 and CASP12 are used as query proteins for threading test. We align each query protein to the template database PDB40 and select top sequence-template alignments by alignment score and build corresponding 3D models by MODELLER (Webb and Sali, 2014).
2.6 Evaluation method
2.6.1 Programs to compare
To evaluate alignment accuracy, we compare our new method DeepThreader with several popular methods including HHpred (Soding, 2005) and CNFpred (the threading method underlying RaptorX; Ma et al., 2012, 2013), as well as EigenTHREADER (Buchan and Jones, 2017), a new threading method built upon contacts predicted by MetaPSICOV (Jones et al., 2015). We do not evaluate map_align because we failed to run it correctly. Here, HHpred was run with the option ‘-mact 0.1’. EigenTHREADER produces three kinds of alignment scores: contact map overlap (CMO), t-statistic and logistic regression score. We use CMO to rank templates since it is the best among the three. Besides the CNFpred itself, we also benchmark its variant CNFpredDL, which re-ranks the sequence-template alignments generated by CNFpred using the alignment scoring function described in this paper [i.e. Equation (1)]. CNFpredDL generates the same alignment as CNFpred, but has different threading performance due to the new template selection strategy. To be fair, we use the same template database and the same nr sequence database for profile generation and contact (distance) prediction.
2.6.2 Evaluating alignment accuracy
We calculate the reference-independent alignment accuracy instead of reference-dependent accuracy. This is because (i) our final goal is to predict 3D models for a query protein, and (ii) this avoids generating reference alignments, which are not unique since they depend on structure alignment tools. In particular, for each sequence-template pair, we first generate an alignment by our threading method (and the competing methods), then build a 3D model for the query sequence by MODELLER (Webb and Sali, 2014) based on the alignment and finally use the quality of the generated 3D model to evaluate alignment accuracy. Here, we evaluate the quality of a 3 D model by TM-score (Zhang and Skolnick, 2004), GDT (Zemla, 2003) and uGDT (i.e. unnormalized GDT) as the model quality. TM-score ranges from 0 to 1 with 1 indicating the best. GDT ranges from 0 to 100, but here we divide it by 100 so that it has scale between 0 and 1. uGDT is equal to the scaled GDT times the sequence length, which works better than GDT when a large query protein is only partially covered by its templates (e.g. only one domain is covered). uGDT can also be interpreted as the number of correctly modelled residues weighted by the modeling quality at each residue.
2.6.3 Evaluating threading performance
We evaluate threading performance by measuring the quality of 3D models built by MODELLER from the first-ranked and the best of top five templates. That is, for each query protein in Test500 and CASP12, we thread it onto all the templates in PDB40, select the top five sequence-template alignments (by alignment score) and then build five 3D models for the query by MODELLER from the top five alignments. Finally, we measure the quality of the top 1 and the best of top five 3D models by TM-score, GDT and uGDT.
2.6.4 Remark
In evaluating a threading method, we shall not simply look at the overall average accuracy on the whole test sets with both easy and hard test cases. For easy cases, almost all existing methods can do well, so there is no need to develop new methods. It is not that meaningful to evaluate a threading method on very hard cases either since they do not have reasonable templates and TBM is not supposed to work at all. That is, we shall focus on those query proteins with templates having TM-score between 0.4 and 0.7.
3 Results
3.1 Alignment accuracy
As shown in Table 1, on Test500, our method DeepThreader outperforms all the other competing methods including HHpred, CNFpred and EigenTHREADER in generating sequence-template alignments. On average, the alignments produced by DeepThreader have TM-score, GDT and uGDT of 0.54, 0.45 and 89.82, respectively. In terms of TM-score, DeepThreader outperforms HHpred, CNFpred and EigenTHREADER by 15%, 8% and 28%, respectively. Since DeepThreader and CNFpred share identical singleton potential (and CNFpred uses only singleton potential), this result indicates that pairwise alignment potential indeed helps improve alignment accuracy. The advantage of DeepThreader over the others is the largest when the sequence-template similarity falls into (0.4, 0.65), which may indicate that pairwise potential is the most useful for protein pairs at such a similarity level. EigenTHREADER does not fare as well as expected. It outperforms HHpred in terms of TM-score on difficult cases (TM-score < 0.4), but significantly underperforms in other cases. The possible reasons might be: (i) the predicted contacts used by EigenTHREADER are not very accurate on Test500; and (ii) EigenTHREADER does not make use of sequential features, although they are important for even distantly-related proteins.
Alignment accuracy measured by TM-score, GDT and uGDT on Test500
| HHpred | CNFpred | EigenTHREADER | DeepThreader | |||||||||
|---|---|---|---|---|---|---|---|---|---|---|---|---|
| TM-score | GDT | uGDT | TM-score | GDT | uGDT | TM-score | GDT | uGDT | TM-score | GDT | uGDT | |
| (0.00, 1.00] | 0.47 | 0.39 | 79.57 | 0.50 | 0.42 | 83.96 | 0.42 | 0.33 | 64.74 | 0.54 | 0.45 | 89.82 |
| (0.00, 0.25] | 0.13 | 0.10 | 37.21 | 0.17 | 0.11 | 42.62 | 0.17 | 0.09 | 31.48 | 0.19 | 0.13 | 47.52 |
| (0.25, 0.40] | 0.18 | 0.14 | 32.63 | 0.22 | 0.16 | 37.82 | 0.20 | 0.13 | 29.55 | 0.24 | 0.18 | 42.09 |
| (0.40, 0.65] | 0.36 | 0.30 | 60.76 | 0.41 | 0.34 | 66.24 | 0.34 | 0.26 | 49.50 | 0.47 | 0.38 | 74.36 |
| (0.65, 0.80] | 0.64 | 0.54 | 105.0 | 0.66 | 0.56 | 108.3 | 0.53 | 0.42 | 82.10 | 0.70 | 0.59 | 114.1 |
| (0.80, 1.00] | 0.80 | 0.72 | 140.9 | 0.82 | 0.74 | 143.4 | 0.70 | 0.61 | 117.1 | 0.83 | 0.75 | 145.2 |
Notes: We measure the difficulty of a sequence-template pair by the structure similarity (measured by TM-score) of two proteins in the pair and split all the pairs into five groups: <0.25, 0.25–0.4, 0.4–0.65, 0.65–0.8 and 0.8–1.0.
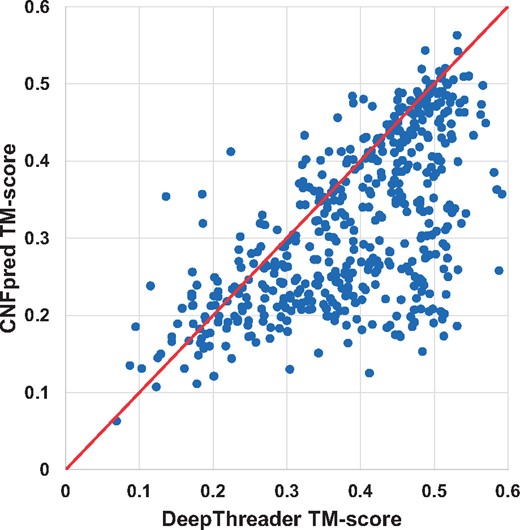
In terms of TM-score and GDT, DeepThreader generates alignments better than HHpred for 811 and 780 pairs, whereas HHpred is better than DeepThreader for only 177 and 199 pairs, respectively. In addition, DeepThreader performs better than CNFpred for 743 and 710 pairs, while worse for 220 and 245 pairs, respectively. DeepThreader significantly outperforms EigenTHREADER on more than 890 pairs. Figures 2 and 3 show the head-to-head comparison between DeepThreader and HHpred and between DeepThreader and CNFpred in terms of TM-score on Test500. These figures confirm that DeepThreader produces better alignments than CNFpred and HHpred for many more sequence-template pairs, especially when the query protein is not very close to template.
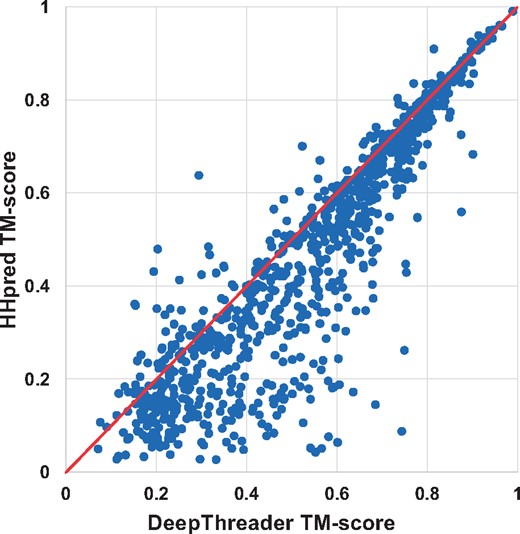
The alignment quality comparison between DeepThreader and HHpred on Test500. Each point represents two alignments generated by DeepThreader (x-axis) and HHpred (y-axis), respectively
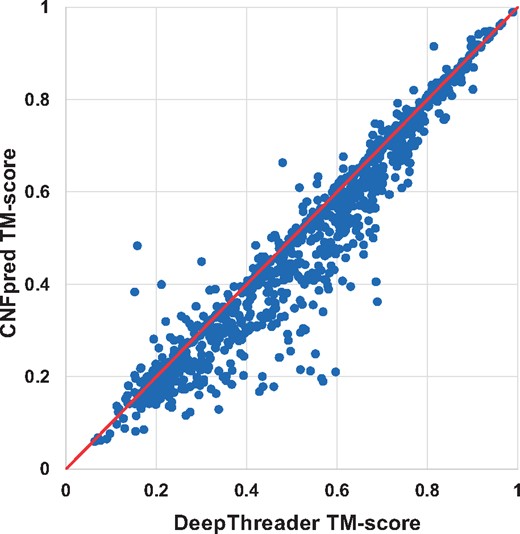
The alignment quality comparison between DeepThreader and CNFpred on Test500. Each point represents two alignments generated by DeepThreader (x-axis) and CNFpred (y-axis), respectively
In order to assess the statistical significance for accuracy improvement, we conduct a statistical t-test to calculate P-value between our methods with CNFpred, HHpred and EigenTHREADER. On the 1000 sequence-template pairs, the P-values between our method and HHpred, CNFpred and EigenTHREADER (in terms of TM-score) are 2.7e–11, 3.6e–04 and 1.2e–34, respectively. Specifically, when the TM-score is in (0.4, 0.65], DeepThreader is better than CNFpred and HHpred by at least 0.05 with corresponding P-values being 6.5e–08 and 2.2e–20, respectively. In summary, the advantage of DeepThreader in building alignments over the others is statistically significant (P < 0.05). See the Supplementary Material for all the detailed P-values.
3.2 Threading performance on Test500
As shown in Table 2, our method outperforms the others by a large margin in terms of the accuracy of the 3D model built from the first-ranked and the best of top five templates. We measure the difficulty of a test protein by its structure similarity (measured by TM-score) with its best template. In Table 2, ‘TM-score < x’ means that when doing threading we exclude all the templates whose structure similarity (measured by TM-score) with the test protein is larger than x. As shown in this table, the harder the test protein are, the larger advantage our method has over the other methods. Our method significantly outperforms the others when the best templates have TM-score <0.65 with the test protein. When the best templates have TM-score < 0.50, our method produces 3D models with average TM-score 0.39, which is 50%, 22% and 62% better than HHpred, CNFpred and EigenTHREADER, respectively. We also calculate the P-value between our method with HHpred, CNFpred, CNFpredDL and EigenTHREADER. When TM-score < 0.7, the P-values are 9.1e–12, 6.7e–05, 4.5e–02 and 9.5e–128, respectively. That is, the advantage of DeepThreader is statistically significant (P < 0.05). EigenTHREADER performs badly no matter whether good templates are available or not. This is because it does not make good use of sequential features and the predicted contacts used by EigenTHREADER are not very accurate. Figure 4 shows the number of test proteins for which DeepThreader and CNFpred perform better, respectively, in terms of the quality of the models built from the first-ranked templates. Similar to Table 2, in this figure, ‘<x’ indicates that the templates with TM-score > x are excluded from consideration in doing threading. This figure further confirms that the harder the test protein, the more advantage DeepThreader has over CNFpred.
Threading performance of different methods on Test500
| TM-score < 0.50 | TM-score < 0.55 | TM-score < 0.60 | TM-score < 0.65 | |||||||||
|---|---|---|---|---|---|---|---|---|---|---|---|---|
| TM-score | GDT | uGDT | TM-score | GDT | uGDT | TM-score | GDT | uGDT | TM-score | GDT | uGDT | |
| HHpred | 0.26/0.33 | 0.21/0.26 | 44.54/54.02 | 0.31/0.37 | 0.25/0.31 | 52.63/62.48 | 0.37/0.43 | 0.30/0.35 | 63.51/72.52 | 0.42/0.48 | 0.35/0.40 | 72.53/81.85 |
| CNFpred | 0.32/0.36 | 0.25/0.28 | 50.02/56.48 | 0.35/0.39 | 0.28/0.31 | 57.48/63.33 | 0.41/0.45 | 0.33/0.36 | 67.97/73.89 | 0.46/0.50 | 0.38/0.41 | 76.89/83.15 |
| CNFpredDL | 0.35/0.39 | 0.29/0.31 | 57.38/62.74 | 0.39/0.43 | 0.32/0.35 | 64.99/69.78 | 0.45/0.48 | 0.37/0.39 | 74.69/79.09 | 0.49/0.52 | 0.40/0.43 | 82.43/87.65 |
| EigenTH | 0.24/0.28 | 0.17/0.20 | 29.90/35.57 | 0.25/0.29 | 0.18/0.21 | 31.52/37.64 | 0.26/0.31 | 0.19/0.23 | 33.21/40.36 | 0.28/0.33 | 0.20/0.24 | 36.20/43.38 |
| DeepThreader | 0.39/0.43 | 0.32/0.34 | 63.09/68.46 | 0.43/0.46 | 0.35/0.38 | 70.31/75.39 | 0.47/0.51 | 0.39/0.42 | 78.96/84.12 | 0.51/0.55 | 0.42/0.45 | 86.12/92.01 |
TM-score < 0.70 | TM-score < 0.75 | TM-score < 0.80 | TM-score < 0.85 | |||||||||
| TM-score | GDT | uGDT | TM-score | GDT | uGDT | TM-score | GDT | uGDT | TM-score | GDT | uGDT | |
| HHpred | 0.48/0.54 | 0.40/0.45 | 84.10/92.28 | 0.54/0.59 | 0.45/0.50 | 95.14/103.0 | 0.59/0.64 | 0.50/0.55 | 106.2/113.6 | 0.63/0.68 | 0.55/0.59 | 117.0/124.9 |
| CNFpred | 0.52/0.55 | 0.43/0.46 | 88.15/93.83 | 0.57/0.60 | 0.48/0.51 | 99.42/104.8 | 0.62/0.65 | 0.52/0.55 | 109.5/114.9 | 0.66/0.69 | 0.57/0.60 | 120.9/126.6 |
| CNFpredDL | 0.54/0.57 | 0.45/0.47 | 91.95/97.15 | 0.59/0.62 | 0.50/0.52 | 102.4/107.6 | 0.63/0.66 | 0.54/0.57 | 112.1/117.2 | 0.68/0.70 | 0.58/0.61 | 122.9/128.0 |
| EigenTH | 0.29/0.34 | 0.22/0.26 | 38.70/46.55 | 0.31/0.37 | 0.24/0.28 | 42.19/50.90 | 0.33/0.39 | 0.25/0.31 | 45.62/55.28 | 0.35/0.41 | 0.27/0.33 | 48.87/60.08 |
| DeepThreader | 0.56/0.59 | 0.46/0.49 | 95.43/101.0 | 0.61/0.64 | 0.51/0.54 | 105.2/110.8 | 0.64/0.68 | 0.55/0.58 | 114.4/119.7 | 0.69/0.71 | 0.59/0.62 | 124.6/130.1 |
Notes: ‘TM-score < x’ means that when doing threading we exclude all the templates whose structure similarity (measured by TM-score) with the test protein is larger than x. Each cell in the table shows the quality of the models built from the first-ranked and the best of top five templates. Values in bold font indicates the best performance.
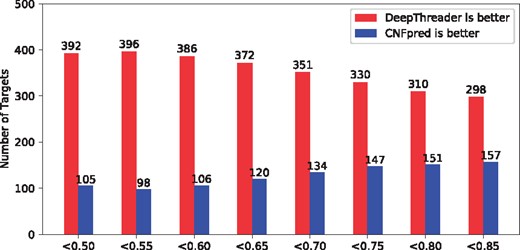
Each red (blue) bar shows the number of test proteins in Test500 for which DeepThreader (CNFpred) perform better in terms of the quality (TM-score) of the models built from the first-ranked template. ‘<x’ indicates that the templates with TM-score > x are excluded from consideration in doing threading
Figure 5 shows the head-to-head comparison between DeepThreader and CNFpred in terms of quality of the models built from the first-ranked templates. In generating this figure, all the templates which have TM-score > 0.5 with the test proteins are excluded from threading. This figure shows that our method significantly outperforms CNFpred. In particular, for 137 test proteins that CNFpred can only predict a 3D model with TM-score < 0.4, our method can produce models with TM-score between 0.4 and 0.6. It is worthy pointed out that for some test proteins, CNFpred or DeepThreader generated 3D models with TM-score > 0.5 even if structure alignment tools DeepAlign and TMalign cannot generate alignments with TM-score > 0.5.
The head-to-head comparison between DeepThreader and CNFpred on Test500 in terms of the TM-score of the models built from the first-ranked templates. Each point represents the TM-score of the two models generated by DeepThreader (x-axis) and CNFpred (y-axis), respectively
3.3 Threading performance on CASP12 data
We further evaluate the threading performance of our method on the 86 CASP12 domains released in 2016 (Moult et al., 2018). Among the 86 domains, 38, 13 and 35 domains belong to the categories of FM, FM/TBM and TBM, respectively. Here, all competing methods use the same set of templates (i.e. PDB40) and the same nr sequence database, both of which were created before CASP12 started.
As shown in Table 3, on FM and FM/TBM targets DeepThreader outperforms all the competing methods by a good margin no matter whether the models are built from the first-ranked or the best of top five templates. On the whole CASP12 set, our method produces the top 1 models with average TM-score 0.54, which is about 20%, 10% and 64% better than HHpred, CNFpred and EigenTHREADER, respectively. On the FM/TBM domains our method shows the largest advantage, outperforming HHpred, CNFpred and EigenTHREADER by 45%, 34% and 83%, respectively. The improvement of our method over CNFpred on the FM targets is not as big as that on the FM/TBM targets. This is possibly because: (i) most FM targets have few sequence homologs (Wang et al., 2018) and our predicted inter-residue distance may not be accurate enough; and (ii) the FM targets have no reasonable templates and TBM is not supposed to work. Again EigenTHREADER does not fare better than HHpred even for FM targets, possibly because that the predicted contacts used by it have low accuracy (Wang et al., 2018). EigenTHREADER does not fare well on TBM targets either because it does not use sequential features.
Threading performance on 86 CASP12 domains
| ALL | FM | FM/TBM | TBM | |||||||||
|---|---|---|---|---|---|---|---|---|---|---|---|---|
| TM-score | GDT | uGDT | TM-score | GDT | uGDT | TM-score | GDT | uGDT | TM-score | GDT | uGDT | |
| HHpred | 0.45/0.50 | 0.40/0.44 | 74.83/81.24 | 0.24/0.30 | 0.23/0.28 | 29.84/35.31 | 0.38/0.44 | 0.35/0.41 | 53.96/59.09 | 0.69/0.73 | 0.59/0.63 | 131.4/139.3 |
| CNFpred | 0.49/0.53 | 0.43/0.47 | 78.81/85.97 | 0.30/0.34 | 0.27/0.31 | 36.50/40.91 | 0.41/0.48 | 0.40/0.46 | 50.92/64.54 | 0.72/0.74 | 0.62/0.65 | 135.1/142.9 |
| CNFpredDL | 0.51/0.55 | 0.46/0.49 | 83.62/88.78 | 0.32/0.37 | 0.30/0.33 | 38.83/43.20 | 0.49/0.55 | 0.47/0.52 | 63.60/69.36 | 0.73/0.75 | 0.64/0.65 | 139.7/143.3 |
| EigenTH | 0.33/0.39 | 0.27/0.33 | 48.51/59.26 | 0.23/0.28 | 0.20/0.24 | 24.85/30.34 | 0.30/0.34 | 0.29/0.33 | 32.59/36.28 | 0.45/0.54 | 0.35/0.43 | 80.12/99.19 |
| DeepThreader | 0.54/0.57 | 0.48/0.50 | 85.98/89.68 | 0.35/0.39 | 0.31/0.35 | 41.24/45.26 | 0.55/0.56 | 0.53/0.54 | 69.28/70.97 | 0.74/0.76 | 0.64/0.66 | 140.8/144.9 |
| MULTICOM | 0.49/0.52 | 0.44/0.47 | 81.72/86.35 | 0.26/0.29 | 0.23/0.26 | 31.33/35.29 | 0.46/0.51 | 0.44/0.49 | 60.39/64.54 | 0.75/0.78 | 0.66/0.69 | 144.4/149.9 |
| RaptorX | 0.53/0.53 | 0.48/0.48 | 88.18/88.18 | 0.32/0.32 | 0.28/0.28 | 37.93/37.93 | 0.50/0.50 | 0.48/0.48 | 69.43/69.43 | 0.78/0.78 | 0.69/0.69 | 149.7/149.7 |
| BAKER-ROS | 0.54/0.58 | 0.49/0.53 | 91.78/97.18 | 0.33/0.37 | 0.29/0.33 | 40.56/45.82 | 0.50/0.57 | 0.48/0.56 | 68.32/75.50 | 0.79/0.81 | 0.70/0.73 | 156.1/161.0 |
| QUARK | 0.55/0.59 | 0.50/0.53 | 89.82/94.14 | 0.34/0.39 | 0.30/0.35 | 40.28/46.13 | 0.53/0.58 | 0.51/0.57 | 68.38/73.78 | 0.80/0.81 | 0.70/0.71 | 151.6/153.8 |
| Zhang-Server | 0.56/0.60 | 0.50/0.53 | 91.14/95.32 | 0.34/0.40 | 0.30/0.36 | 41.05/47.02 | 0.55/0.59 | 0.53/0.56 | 71.03/74.67 | 0.80/0.81 | 0.71/0.72 | 153.0/155.4 |
Notes: Each cell shows the average quality of the 3D models built from the first-ranked and the best of top five templates.
Table 4 shows that when we exclude the targets whose BLAST E-value with the training and validation set <0.1, the advantage of our method is even more significant. For example, our method produces the top 1 models with average TM-score 0.47, which is about 31%, 17% and 74% better than HHpred, CNFpred and EigenTHREADER, respectively. On the FM/TBM domains, our method shows a very large advantage, outperforming HHpred, CNFpred and EigenTHREADER by 53%, 38% and 104%, respectively.
Threading performance on 64 CASP12 domains
| ALL | FM | FM/TBM | TBM | |||||||||
|---|---|---|---|---|---|---|---|---|---|---|---|---|
| TM-score | GDT | uGDT | TM-score | GDT | uGDT | TM-score | GDT | uGDT | TM-score | GDT | uGDT | |
| HHpred | 0.36/0.42 | 0.33/0.38 | 54.78/60.11 | 0.23/0.29 | 0.22/0.27 | 28.32/33.52 | 0.36/0.42 | 0.34/0.41 | 50.47/55.76 | 0.60/0.65 | 0.52/0.56 | 107.6/113.3 |
| CNFpred | 0.40/0.45 | 0.36/0.41 | 57.94/65.67 | 0.29/0.33 | 0.26/0.30 | 34.78/39.61 | 0.40/0.47 | 0.39/0.46 | 47.38/61.50 | 0.63/0.66 | 0.54/0.58 | 108.7/117.7 |
| CNFpredDL | 0.44/0.48 | 0.40/0.44 | 63.57/68.22 | 0.31/0.36 | 0.29/0.33 | 37.38/42.12 | 0.49/0.54 | 0.48/0.53 | 61.11/66.64 | 0.65/0.67 | 0.56/0.58 | 114.7/118.6 |
| EigenTH | 0.27/0.33 | 0.23/0.28 | 33.92/41.90 | 0.23/0.28 | 0.20/0.24 | 24.93/30.41 | 0.27/0.31 | 0.28/0.32 | 27.63/31.63 | 0.36/0.44 | 0.27/0.34 | 55.09/70.48 |
| DeepThreader | 0.47/0.50 | 0.42/0.45 | 66.28/70.06 | 0.34/0.38 | 0.31/0.34 | 40.00/44.30 | 0.55/0.56 | 0.53/0.55 | 67.29/68.58 | 0.66/0.69 | 0.57/0.59 | 115.2/119.7 |
| MULTICOM | 0.41/0.45 | 0.37/0.41 | 60.63/65.61 | 0.26/0.29 | 0.22/0.26 | 30.44/34.09 | 0.45/0.51 | 0.45/0.50 | 57.67/62.17 | 0.67/0.71 | 0.60/0.63 | 119.6/127.4 |
| RaptorX | 0.46/0.46 | 0.42/0.42 | 67.44/67.44 | 0.31/0.31 | 0.28/0.28 | 36.46/36.46 | 0.49/0.49 | 0.48/0.48 | 66.24/66.24 | 0.73/0.73 | 0.64/0.64 | 126.8/126.8 |
| BAKER-ROS | 0.47/0.52 | 0.43/0.48 | 71.86/77.52 | 0.33/0.37 | 0.30/0.34 | 40.49/45.90 | 0.48/0.56 | 0.48/0.56 | 64.94/72.72 | 0.74/0.77 | 0.66/0.69 | 135.7/140.5 |
| QUARK | 0.49/0.53 | 0.44/0.48 | 70.10/74.58 | 0.34/0.39 | 0.30/0.35 | 39.62/45.34 | 0.52/0.58 | 0.52/0.57 | 66.27/71.00 | 0.75/0.77 | 0.65/0.67 | 130.2/132.2 |
| Zhang-Server | 0.50/0.54 | 0.45/0.48 | 71.80/75.73 | 0.35/0.40 | 0.30/0.35 | 40.50/46.17 | 0.54/0.58 | 0.54/0.57 | 69.05/72.05 | 0.75/0.77 | 0.66/0.67 | 132.8/134.0 |
Notes: Each cell shows the average quality of the 3D models built from the first-ranked and the best of top five templates.
Tables 3 and 4 show that DeepThreader is better than CNFpred by 0.14 on the CASP12 TBM/FM targets. DeepThreader is better than CNFpred by 0.05 TM-score on the CASP12 FM targets because most of these targets do not have reasonable templates and TBM is not supposed to work. We conducted the statistical test using all the 51 FM and FM/TBM targets. The P-values between DeepThreader and HHpred and EigenTHREADER are 9.5e–04 and 4.7e–07 on the 51 domains, respectively, which indicates that the advantage of DeepThreader on CASP12 hard targets is statistically significant.
Tables 3 and 4 also list results of 5 top CASP12 servers. On the FM and FM/TBM targets, DeepThreader outperforms MULTICOM, RaptorX and Baker-Rosetta in terms of TM-score and is comparable to QUARK and Zhang-Server. DeepThreader is much worse than the top CASP12 servers on the TBM targets mainly because DeepThreader uses a much smaller template database. In CASP12, RaptorX used PDB70 instead of PDB40 to construct the template database. We shall be very careful in interpreting the comparison between DeepThreader and the top CASP12 servers. DeepThreader is only a threading method while almost all the CASP12 top servers (or human groups) used a hybrid method. For example, our own TBM server RaptorX first used CNFpred to generate sequence-template alignments, then employed an unpublished DL method to rank all the alignments, and finally used Rosetta to build 3D models from a single template or multiple similar templates. In contrast, DeepThreader simply selects alignments by their alignment scores and use MODELLER to build 3D models from individual templates. On average, DL for template selection works better than the raw alignment score, Rosetta builds better 3D models than MODELLER and multi-template modeling works better than single-template modeling. Our in-house test shows that from the same DeepThreader alignment (with TM-score < 0.8), the 3D models built by Rosetta are better than MODELLER by 0.014 in terms of TM-score. That is, by simply combining DeepThreader and Rosetta, we can predict better 3D models than the others on the FM and FM/TBM targets.
Figure 6 shows the number of test proteins for which DeepThreader and CNFpred perform better, respectively, in terms of the quality of the models built from the first-ranked templates. This figure further confirms that DeepThreader is better than CNFpred on FM/TBM and TBM targets. Figure 7 shows head-to-head comparison between DeepThreader and CNFpred in terms of TM-score of the 3D models built from the first-ranked templates. For some quite hard targets for which CNFpred produces models with TM-score < 0.40, DeepThreader generates much better 3D models.
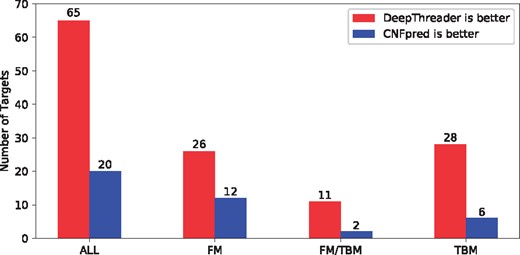
Each red (blue) bar shows the number of CASP12 test proteins for which DeepThreader (CNFpred) perform better in terms of the quality (TM-score) of the models built from the first-ranked templates. The number of targets in ALL, FM, FM/TBM and TBM groups is 86, 38, 13 and 35, respectively
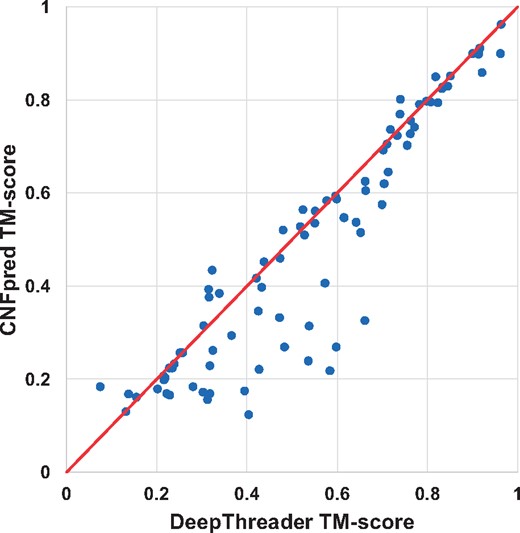
Head-to-head comparison between DeepThreader and CNFpred on CASP12. Each point represents the quality (TM-score) of two models generated by DeepThreader (x-axis) and CNFpred (y-axis), respectively
3.4 Contribution of predicted inter-residue distance
To evaluate the contribution of predicted inter-residue distance information, we examine the difference among DeepThreader, CNFpredDL and CNFpred in terms of alignment accuracy and threading performance. Table 1 shows that DeepThreader outperforms CNFpred, indicating that predicted inter-residue indeed can improve sequence-template alignment. Tables 2 and 3 show that DeepThreader outperforms CNFpred too, indicating that predicted inter-residue distance is helpful to threading performance. In summary, inter-residue distance predicted from DL can improve both alignment accuracy and threading performance. Tables 2 and 3 also show that CNFpredDL performs better than CNFpred. Since CNFpredDL only re-ranks the alignments generated by CNFpred, this implies that CNFpredDL can select better templates than CNFpred. That is, predicted inter-residue distance can help rank alignments generated by the other methods. However, there is still a non-trivial gap between CNFpredDL and DeepThreader, which indicates that the best way to use predicted inter-residue distance is to apply it to both alignment generation and template selection.
3.5 Accuracy improvement versus homologous information
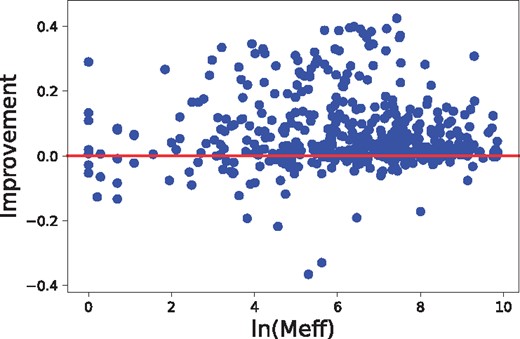
The alignment accuracy and threading performance relies on the accuracy of predicted inter-residue distance, which in turn relies on residue co-variation information. The co-variation information is very noisy when the protein under prediction has a small number of effective sequence homologs. We measure this by Meff (Wang and Xu, 2013), which can be roughly interpreted as the number of non-redundant sequence homologs in multiple sequence alignment when 70% sequence identity is used as cutoff to remove redundancy. As shown in Figure 8, our method can improve alignment accuracy (measured by TM-score) across all Meff values, but the improvement is small when , i.e.7.39. We have similar observation on threading performance, as shown in Figures 9 and 10. In summary, there is a weak correlation between improvement and Meff.
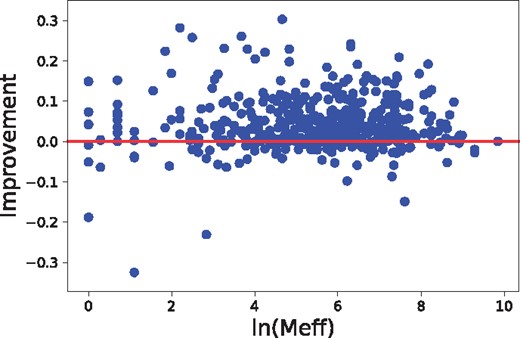
The relationship between alignment accuracy improvement and the number of sequence homologs (measured by Meff), tested on Test500. The 471 sequence-template pairs with TM-score ≤ 0.60 are used
The relationship between threading accuracy improvement and the number of sequence homologs (measured by Meff), tested on Test500. We exclude all the templates whose structure similarity with the test protein is larger than 0.60
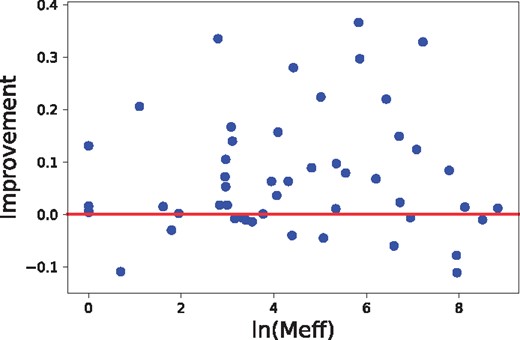
The relationship between threading accuracy improvement and the number of sequence homologs (measured by Meff), tested on CASP12 FM and FM/TBM targets
3.6 Selection of hyper-parameters
DeepThreader has two independent tunable hyper-parameters: the number of iterations in ADMM and the band for the Viterbi algorithm. We ran a grid search to study their impact on alignment accuracy. In particular, we tested the number of iterations from 0 to 40 with stride 1 while fixing the band to 64. We also tested the band 4 and from 8 to 128 with stride 8 while fixing the number of iterations to 10. Figure 11A shows that both the running time and alignment quality increase along with the number of iterations. In fact, the alignment accuracy is already very good after two or three iterations. Figure 11B shows that the running time and alignment quality increase with respect to the band used by the Viterbi algorithm. Initially, the model quality rapidly increases along with the band and then slows down when the band > 64. By default, we set the number of iterations to 10 and the band to 64 to achieve a good balance between accuracy and running time.
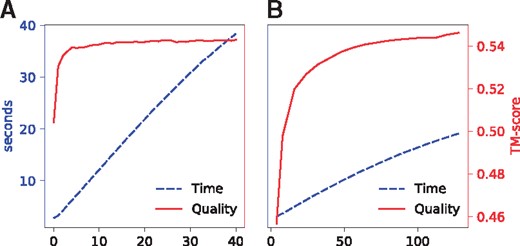
The running time and alignment quality (on Test500) with respect to (A) the number of iterations in the ADMM algorithm, and (B) the band used in the Viterbi algorithm
3.7 Running time
Figure 12 shows the running time of four methods building sequence-template alignment with respect to protein length. Note that all the methods were tested on the same Linux machine of 128 G RAM and 32 CPUs (AMD Opteron(tm) Processor 6376, 1400 MHz, 2 M cache). It is expected that DeepThreader is slower than the other programs, but DeepThreader is less than 5 times slower than EigenTHREADER and CNFpred, and about 10 times slower than HHpred except when the proteins are too long. Overall, the average running time of DeepThreader is acceptable.
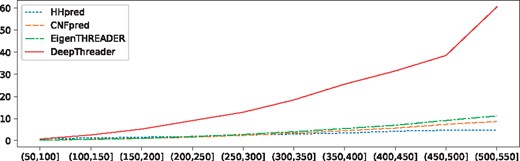
The running time of four programs building alignments for Test500. The x-axis is the geometric mean of protein lengths in a pair, and y-axis is the running time in seconds
4 Conclusion
This paper presents DeepThreader, a distance-assisted protein threading method that can greatly improve protein threading by making use of inter-residue distance predicted from residue co-variation information and DL. Experimental results show that DeepThreader works particularly well for proteins without close templates as long as the query protein has 10 sequence homologs, owing to its effective integration of sequential features and pairwise information. Our predicted inter-residue distance is useful for both protein alignment and template selection regardless of the number of sequence homologs available for the query protein. DeepThreader outperforms not only currently popular homology modeling and threading methods such as HHpred and CNFpred but also the latest contact-assisted threading methods such as EigenTHREADER.
Different from EigenTHREADER that works only on some hard targets with many sequence homologs, our method works well on both hard and easy targets (even if they do not have many sequence homologs) because our predicted distance is more accurate and informative and we use a combination of sequential and pairwise features while EigenTHREADER uses mainly pairwise features. EigenTHREADER does not fare as well as described in (Buchan and Jones, 2017) on our (more realistic) test data, which is much more challenging than those tested by the EigenTHREADER developers. Most of the EigenTHREADER test proteins have more than 1000 effective sequence homologs and thus, reasonable contact prediction. However, this kind of proteins (except membrane proteins) are likely to have good templates in PDB and thus, may not benefit too much from contact-assisted threading. Given that map_align employs contacts predicted from a pure co-evolution analysis method (which requires a large number of sequence homologs to be accurate), we expect that DeepThreader shall greatly outperform map_align on query proteins without many sequence homologs.
Although slower than the other methods, DeepThreader has an acceptable running time. We may speed up DeepThreader by running it on a computing cluster, which can be done easily by splitting the template database. We may also speed up DeepThreader by first running ADMM with only 2–3 iterations to choose top 1000 templates and then realigning the query sequence to the top templates with more iterations. Another speedup strategy is to run DeepThreader on a GPU card, which may greatly speed up the template search process.
Acknowledgement
The authors greatly appreciate the financial support from National Institutes of Health, National Science Foundation and the National Natural Science Foundation of China.
Funding
This work was supported by National Institutes of Health grant R01GM089753 to JX and National Science Foundation grant DBI-1564955 to JX. This work is also supported by National Natural Science Foundation of China grant 31770775, and 31671369 to JZ and DB. The funders had no role in study design, data collection and analysis, decision to publish, or preparation of the manuscript.
Conflict of Interest: none declared.
References

