


Abstract
Network propagation has been widely used to aggregate and amplify the effects of tumor mutations using knowledge of molecular interaction networks. However, propagating mutations through interactions irrelevant to cancer leads to erosion of pathway signals and complicates the identification of cancer subtypes.
To address this problem we introduce a propagation algorithm, Network-Based Supervised Stratification (NBS2), which learns the mutated subnetworks underlying tumor subtypes using a supervised approach. Given an annotated molecular network and reference tumor mutation profiles for which subtypes have been predefined, NBS2 is trained by adjusting the weights on interaction features such that network propagation best recovers the provided subtypes. After training, weights are fixed such that mutation profiles of new tumors can be accurately classified. We evaluate NBS2 on breast and glioblastoma tumors, demonstrating that it outperforms the best network-based approaches in classifying tumors to known subtypes for these diseases. By interpreting the interaction weights, we highlight characteristic molecular pathways driving selected subtypes.
The NBS2 package is freely available at: https://github.com/wzhang1984/NBSS.
Supplementary data are available at Bioinformatics online.
1 Introduction
The Cancer Genome Atlas (TCGA) and International Cancer Genome Consortium (ICGC) have recently used exome or genome-wide DNA sequencing to construct very large catalogs of somatic mutations found in tumors of many types (International Cancer Genome Consortium et al., 2010; Weinstein et al., 2013). Analysis of these data has shown the striking observation that, while a few genes are mutated frequently in cancer, most mutations fall in genes which are mutated quite rarely. That is, the somatic mutation profiles of tumors are fundamentally heterogeneous, with few commonalities and many differences found among and within different cancers.
A popular approach to interpret and reduce this heterogeneity has been to aggregate tumor mutations in the context of molecular networks. Various approaches have been developed based on this principle, including identification of subnetworks that aggregate mutations in different genes across a cohort (e.g. HotNet2) (Leiserson et al., 2015a; Ruffalo et al., 2015; Horn et al., 2018; Miller et al., 2011; Creixell et al., 2015b; Bertrand et al., 2015) or identification of tumor subtypes (e.g. network-based stratification, aka NBS) (Hofree et al., 2013; Kim et al., 2016; Jin et al., 2015; Gaiteri et al., 2015; Cho et al., 2016). The core algorithm of these methods is network propagation (Cowen et al., 2017), which uses a random walk (Pearson, 1905) model to diffuse information about gene mutations through network interactions. The rationale of this approach is that genetic alterations affecting two different, but interacting, genes have an elevated likelihood of yielding the same functional and phenotypic outcomes. The result of network propagation is typically to generate a score for each gene that captures its network proximity to genes with somatic mutations.
While such methods are promising, they face a variety of open challenges, many related to how best to detect the subnetworks (pathways) affected by mutations. In particular, the above network propagation approaches rely on reference molecular networks in the public domain which are neither tissue-specific nor cancer-specific. Propagating mutations through gene interactions not present in cancer cells can cause erroneous aggregation of passenger mutations as well as contamination of characteristic pathway signals, leading to poor tumor subtype stratification. Therefore, it is important to distinguish between interactions that are functional in tumor cells and those that are not, particularly in light of recent studies showing that tumor cells rewire numerous molecular interactions during cell proliferation and clonal expansion (Li et al., 2017; Wu et al., 2009; AlQuraishi et al., 2014; Creixell et al., 2015c; Creixell et al., 2015a).
Here, we develop Network-Based Supervised Stratification (NBS2), a general framework that extends the Supervised Random Walk algorithm (Backstrom and Leskovec, 2010) with a novel loss function designed specifically for cancer subtype classification. Similar to other cancer network approaches, network propagation is a central component for aggregation of mutations impacting the same subnetwork regions. However, unlike previous approaches, supervised learning is used to adjust the weight of each molecular interaction, guiding the direction of propagation to maximize the agreement among tumors of the same subtype. We demonstrate that this new algorithm leads to improved performance in cancer subtype stratification. Moreover, the highly weighted interactions outline biological pathways that affiliate with the underlying cancer subtypes.
2 Materials and methods
Supervised Random Walk (SRW) was originally proposed to recommend interpersonal links in social networks (Backstrom and Leskovec, 2010). From this work, we have borrowed the concept of learning an activation score for each interaction in a gene network used in the random walk process. The cost function used in supervised learning is designed specifically for cancer subtype classification. In the following sections, we first describe the methodology for the basic random walk algorithm and then extend it to a supervised approach (Fig. 1).
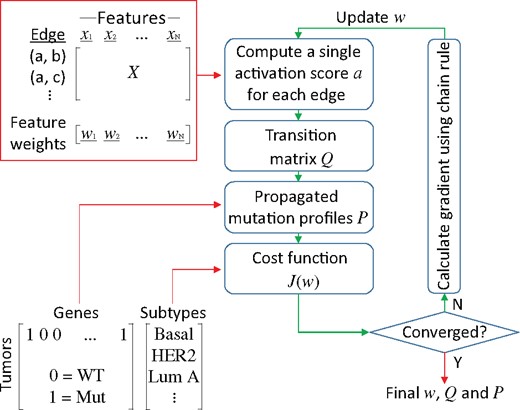
NBS2 Workflow. NBS2 takes three input datasets, represented by red arrows: (1) a molecular network where each edge is annotated by a feature vector , and each feature is assigned an initial weight ; (2) a tumor-by-gene matrix representing the mutation profile of a cohort and (3) the defined subtype of each tumor. In each iteration, NBS2 computes an activation score a for each edge (Equation 3), calculates a transition matrix (Equation 2), performs a random walk (Equation 1), and computes the value of the cost function (Equation 4). Training the classifier is conducted iteratively using gradient descent. To minimize , the algorithm calculates the gradient of with respect to the edge feature weights using the chain rule (Equations 7–11) and updates accordingly. Upon convergence, the algorithm outputs the final feature weights , transition matrix and propagated mutation profiles , which together define the classification model
2.1 Unsupervised tumor stratification based on random walk
Here is a tumor-by-gene binary matrix (0 = wild type; 1 = mutated) representing the mutation profile of each tumor in a cohort, and is the degree-normalized adjacency matrix of . The parameter α denotes the restart probability, governing the distance that mutation signal is allowed to propagate through the network. At convergence, when , stationary random walk scores represent a tumor-by-gene matrix, in which the mutation profile of each tumor has been ‘smoothed’ by the network. The score of each gene represents its network proximity to all genes with mutations. is hereafter referred to as ‘propagated mutation profiles’. Applying non-negative factorization to these propagated mutation profiles has been shown to identify clinically meaningful tumor subtypes (Hofree et al., 2013).
2.2 Supervised tumor classification based on random walk
2.3 Cost function
Instead of directly predicting the subtype label, the NBS2 training process learns the center of each subtype cluster from training data. In the testing/validation phase, each patient sample is assigned to one of these subtypes based on the shortest Euclidean distance to the centers. In this way, the whole classification framework can be viewed as a supervised clustering process.
2.4 Training the classification model
2.5 Subtype prediction for new tumors
2.6 Edge features
To calculate the edge activation score (Equation 3), each edge is annotated by a set of edge features. In particular, in the analysis of real tumor mutation profiles (Sections 3.2 and 3.3), we designed 76 distinct interaction features (Supplementary Table S1) distributed across nine categories:
Interaction types (12 features, e.g. protein complex, transcriptional regulation)
Source databases (19 features, e.g. KEGG, CORUM; containing interactions from different technologies and qualities of data and curation)
Cancer-related pathways (28 features, e.g. Wnt signaling)
Mutual exclusivity of mutations to source and target (one feature)
Mutation rates of source and target genes (two features)
Association between incidence of mutation and subtypes (two features denote associations between source or target gene and its most significantly associated subtype among all subtypes)
Source or target gene is in top five most recurrently mutated (10 features)
Self-loop (one feature)
Intercept (one feature, constant term inside the Equation (3) sigmoid function)
3 Results
In Section 3.1, we present the results of simulations to demonstrate the effect of minimizing the cost function during training and, more importantly, the intuition for why supervision is able to achieve improved results in comparison to unsupervised random walk. Next, in Sections 3.2 and 3.3, we apply the method to classify somatic mutation profiles of two major cancers cataloged in TCGA: glioblastoma (GBM) and breast cancer (BRCA).
3.1 Experiments on simulated data
3.1.1 Simulated data
To demonstrate and benchmark the NBS2 algorithm, we simulated a molecular interaction network, edge features, and a tumor-by-gene matrix of mutation profiles where tumors belong to one of two subtypes that are not immediately separable by mutation profiles or network topology alone (Fig. 2A). Our goal was to recover these two subtypes as well as to detect their characteristic subnetworks.
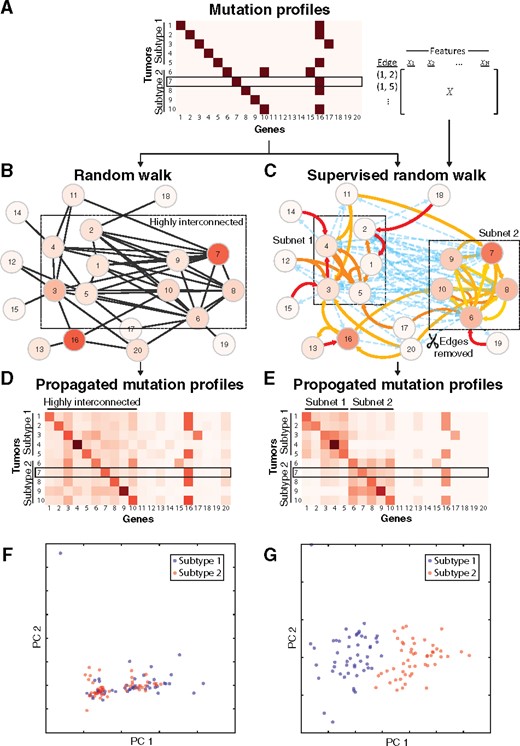
Experiments on simulated data. (A) Simulated mutation dataset including characteristic genes of two subtypes (genes 1–10) and a Frequently Mutated Gene (FMG) (gene 16). Mutated genes are shown in dark red and non-mutated genes are shown in white. A reduced set of tumors and genes (10 × 20) is shown as an example; the full simulation is 100 × 1000. An edge-by-feature matrix is also used as an input for the supervised random walk. (B) Unsupervised and (C) supervised random walk of mutations over a simulated gene interaction network. Shades of red show propagated mutation values for tumor sample #7. (D, E) Propagated mutation profiles following (D) unsupervised and (E) supervised random walk. (F, G) Principal components analysis (PCA) of the full simulation (100 × 1000) between (F) unsupervised random walk-based tumor stratification and (G) supervised random walk-based tumor classification
We simulated somatic mutation profiles with 100 tumors and 1000 genes and divided the tumors into two equal-sized subtypes. Each subtype was assigned with 50 characteristic genes in the network. For each tumor, a unique characteristic gene was mutated (Fig. 2A); none of the two tumors shared the same characteristic gene, so that the two subtypes were completely indiscernible based on gene mutations. The characteristic genes were mutated with probability 1.5% (median mutation rate in 22 types of cancer in TCGA) among tumors within their respective subtype. Beyond mutations on the characteristic genes, other genes were randomly mutated with probability 1.5% to simulate passenger mutations in cancer. Finally, to simulate the influence of frequently mutated genes (FMG, e.g. TTN), we randomly assigned a gene with approximately 50% tumors mutated.
We simulated the molecular network used to guide the random walk using an Erdos-Renyi model (Erdos and Renyi, 1959). On this note, we found empirically that the particular method for generating random interactions, preferential attachment (Albert and Barabási, 2002) or Erdos-Renyi, did not have a large effect on the analysis and therefore chose a simpler model. Specifically, edges were randomly generated with probability 11.4% among the 100 characteristic genes and 0.4% for all other gene pairs, mimicking the connectivity between known cancer genes (Vogelstein et al., 2013) and all other genes, respectively. Note that to better illustrate our results, edge density in Fig. 2B and C (70% for characteristic genes and 5% for others) is much higher than that in the actual simulation.
For each edge in the simulated network, the activation score (Equation 2) was determined by the following eight edge features: two subtype features, which were set to 1 for the edges between characteristic genes within the respective subtype, and 0 otherwise; two FMG features representing the incoming and outgoing edges from the FMG; two random features uniformly sampled from [0, 1]; a ‘self-loop’ feature as described above (Section 2.2); and an intercept term which was held constant at 1 for all edges.
3.1.2 Results of the simulation
We first assessed the performance of unsupervised RWR on the simulated dataset as a baseline. In this case, all edges were equally activated, so a random walk had equal probability to traverse to all neighbors of a specific node (Fig. 2B). Since the characteristic genes were highly connected within and between both subtypes, the final propagated mutation scores were evenly distributed across these genes and the two subnetworks remained unrecognizable (Fig. 2D). As a consequence, the unsupervised algorithm failed to recover the two simulated subtypes (Fig. 2F, accuracy = 51.0% ± 4.6% in 10 simulations).
We next applied the NBS2 algorithm to the simulated dataset. The supervised algorithm learned the underlying fact that the two subtype-characteristic edge features are very important and thus assign large positive weights to them (Table 1). Consequently, the two subtype-characteristic subnetworks emerged because the edge activation scores within each of these subnetworks were boosted (Fig. 2C). In contrast, the intercept term in the edge activation function was assigned a negative weight, which effectively removed edges between the subtype-characteristic subnetworks (activation score close to zero). All other edge features were typically assigned weights close to zero due to the regularization, indicating they were not important in identifying the two subtypes. As a result, the mutation signal was propagated far more avidly within each subnetwork than between subnetworks (Fig. 2E). Overall, our supervised random walk algorithm achieved nearly perfect classification in recovering the two simulated subtypes (Fig. 2G, accuracy = 91.5% ± 2.1% in 10 simulations).
Edge feature weights learned in simulation
| Edge features | Feature weights |
|---|---|
| Subnetwork 1 | 7.84 ± 1.78 |
| Subnetwork 2 | 7.89 ± 1.77 |
| FMG (outgoing) | 0.02 ± 0.10 |
| FMG (incoming) | −0.05 ± 0.13 |
| Random 1 | −2.28 ± 3.18 |
| Random 2 | −0.49 ± 2.20 |
| Self-loop | −0.82 ± 2.18 |
| Intercept | −8.28 ± 2.74 |
| Edge features | Feature weights |
|---|---|
| Subnetwork 1 | 7.84 ± 1.78 |
| Subnetwork 2 | 7.89 ± 1.77 |
| FMG (outgoing) | 0.02 ± 0.10 |
| FMG (incoming) | −0.05 ± 0.13 |
| Random 1 | −2.28 ± 3.18 |
| Random 2 | −0.49 ± 2.20 |
| Self-loop | −0.82 ± 2.18 |
| Intercept | −8.28 ± 2.74 |
To further study the robustness of this method, we randomly flipped the subtype labels of either 10% or 20% of samples (adding noisy/wrong information) and measured the prediction accuracy. We found that accuracy dropped to 82.6% ± 2.7% and 73.0% ± 6.6%, respectively, in 10 simulations. Interestingly, the edge feature weights were learned to have very similar values as the original simulation (Pearson’s r of feature weights = 0.98 and 0.99, respectively). These results indicate our algorithm is robust especially in recovering the correct feature weights for network propagation.
3.1.3 Choice of hyperparameters
We also used simulations to inform the choice of hyperparameters. We found that the NBS2 algorithm was robust to the particular values of hyperparameter , the random walk restart probability (Equation 1), and , the lasso regularization parameter (Equation 7). We achieved very similar results when α was within a range of 0.15 to 0.5 and was within a range of 0 to 0.2. However, we also noted that the hyperparameter in the loss function (Equation 7) was not robust and needed to be fine-tuned for the algorithm to work properly; we achieved reasonable results in the range of 500–10 000. Overall, the best classification performance was achieved with = 0.3, = 0.1 and = 5000. The performance of real tumor mutation profiles with respect to different choices of hyperparameters can be found in Supplementary Figure S1.
3.2 Classification of glioblastoma
Having benchmarked NBS2 in simulation, we next applied it to classify tumor mutation profiles from cancer patients. Glioblastoma multiforme (GBM) is the most common brain cancer malignancy diagnosed in adults. Affected patients have a very poor prognosis with a median survival of one year (Ohgaki and Kleihues, 2005). Widespread differences in gene expression and DNA methylation have previously been reported in GBM, grouping GBM tumors into five subtypes: Glioma-CpG Island Methylator Phenotype (G-CIMP), Proneural, Neural, Classical and Mesenchymal (Verhaak et al., 2010; Brennan et al., 2013). These subtypes have been shown to associate with distinct neural lineages, ages, prognoses and responses to therapy. For instance, G-CIMP is associated with younger age of diagnosis and better survival (Brennan et al., 2013); while the Classical subtype is the most responsive to aggressive therapy (Verhaak et al., 2010). Our goal here was to not only classify the five GBM subtypes based on tumor mutation profiles, but also to identify the underlying gene interactions driving such types on a reference molecular network.
3.2.1 Glioblastoma data processing
We collected and integrated somatic mutation and copy number alteration (CNA) data of 223 GBM tumors (Brennan et al., 2013) as follows: A gene was considered altered if it had a non-silent somatic mutation, if it was a well-defined oncogene or tumor suppressor (Vogelstein et al., 2013), or if it fell within a CNA. We then divided the tumors into a training set (150 tumors) and a validation set (73 tumors). As a reference molecular network we used Pathway Commons (Cerami et al., 2011), documenting 968 186 pairwise relations among 15 485 human gene products pertaining to previously reported protein-protein, transcriptional and metabolic interactions. To focus on driver mutations, we removed all genes that were neither previously reported as cancer genes (Futreal et al., 2004; Vogelstein et al., 2013; Iorio et al., 2016) nor were in cancer-related pathways (Zhang et al., 2013), as well as genes which were mutated in fewer than four tumors in the training set (we observed that such filtering led to a ∼5% improvement in accuracy of predictions and ∼20-fold improvement in running time). This approach resulted in a pruned network with 51 nodes (genes) and 296 edges (gene interactions). We designed 76 edge features based on annotations of interactions and mutation profiles of the training set as described in Section 2.6 (Supplementary Table S1).
3.2.2 Performance of subtype classification of glioblastoma tumors
We next sought to evaluate the predictive performance of the NBS2 algorithm on the GBM data. We conducted a three-fold cross validation within the training set to tune hyperparameters, after which we used the complete training set for building the classifier and the remaining set of 73 tumors for validation. We noticed a strong anti-correlation between cost and accuracy, confirming that the cost function translates well to the goal of accurate classification (Fig. 3A). The training accuracy started at 34% at iteration 0 and increased to a plateau of 55–57% in about 60 iterations (Fig. 3A). Notably, validation accuracy also increased from 47 to 64%, indicating the model generalizes well on new data (Fig. 3B). The precision and recall were very high for G-CIMP, Classical, Mesenchymal and Proneural (54–100%), but poor for the Neural subtype (Table 2). This result is consistent with a previous report that the Neural subtype has very few, if any, characteristic mutations or copy number alterations (Verhaak et al., 2010). We also compared this validation performance to the baselines achieved by our previous NBS method (Hofree et al., 2013) (based on RWR) and through direct use of mutation profiles without random walk. In particular, to achieve two baseline performance scores we calculated the cluster centroids of the training set to make predictions of the validation set, just as what we did in Section 2.5. Both baseline methods achieved 47% in validation accuracy, a performance 17% lower than that of NBS2 (Fig. 3B).
Glioblastoma validation performance
| Predicted | |||||||
|---|---|---|---|---|---|---|---|
| Classical | G-CIMP | Mesenchymal | Neural | Proneural | |||
| Subtype as defined previously by expression | Classical | 17 | 0 | 3 | 0 | 4 | 24 |
| G-CIMP | 0 | 6 | 0 | 0 | 1 | 7 | |
| Mesenchymal | 3 | 0 | 16 | 1 | 0 | 20 | |
| Neural | 3 | 0 | 5 | 1 | 1 | 10 | |
| Proneural | 2 | 0 | 2 | 1 | 7 | 12 | |
| 25 | 6 | 26 | 3 | 13 | |||
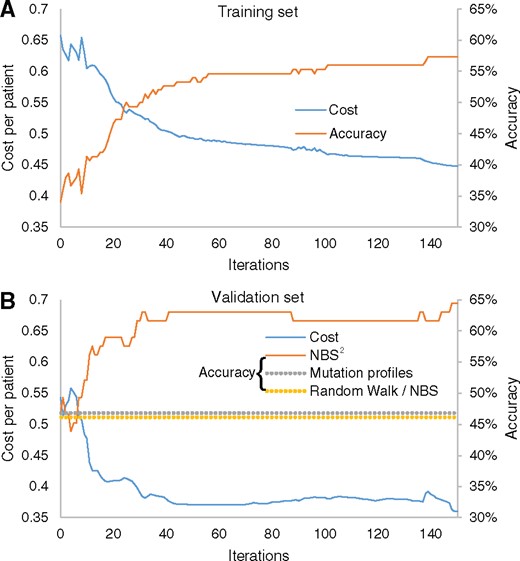
Performance of glioblastoma subtype classification. Values of cost function (left y-axis) and classification accuracy (right y-axis) are plotted against the number of iterations of NBS2 on the (A) training data and (B) validation data. Dashed line indicates accuracy of tumor stratification based on unsupervised random walk and non-propagated mutation profiles (equal values, slight offset in accuracy is for visualization)
3.2.3 Characteristic subnetworks for glioblastoma subtypes
At convergence, the weighted network was of particular interest as it revealed characteristic mutated subnetworks underlying the five GBM subtypes. For instance, the Classical subtype was known to be characterized by EGFR mutations and copy number amplifications (Verhaak et al., 2010; Brennan et al., 2013). The characteristic subnetwork revealed by NBS2 recovers these characteristics along with additional genes, revealing a ‘EGFR-LAMA1-PIK3CA-LRP2’ subnetwork (Fig. 4A). In particular, Integrin-Laminin interaction (Laminin is partially encoded by LAMA1) is regulated by EGFR (Rabinovitz et al., 1999) and can activate PI3K (partially encoded by PIK3CA) during cancer cell migration (Shaw et al., 1997). Separately, PI3K regulates low density lipoprotein-related protein 2 (encoded by LDL2) in Clathrin-mediated endocytosis (Kirchhausen et al., 2014). These interactions together identify a pathway related to motility and invasiveness of cancer cells.
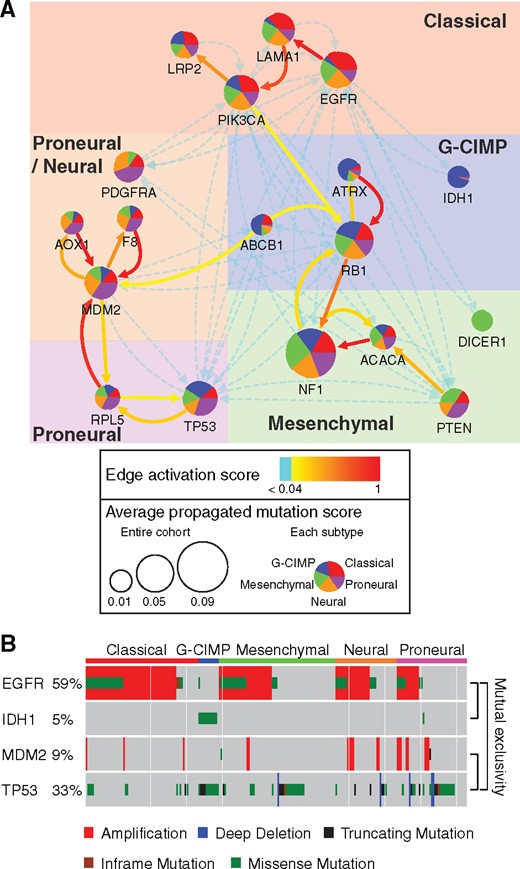
Subnetworks for glioblastoma subtypes. (A) (http://www.ndexbio.org/#/network/3a5206c2-fd4e-11e7-adc1-0ac135e8bacf) Subnetworks characterizing glioblastoma subtypes extracted from Pathway Commons by NBS2. The subnetworks are defined by the set of genes for which the propagated mutation score is significantly different across subtypes (ANOVA False Discovery Rate <0.30) and the set of interactions for which the activation score is above average (>0.04). The pie chart represents the relative proportions of the average propagated mutation score for the five subtypes. For example, the large blue pie slice on IDH1 indicates that its average propagation score is much higher in G-CIMP tumors than other subtypes. (B) Mutation profiles and subtype assignments of individual tumors (columns) associated with genes EGFR, IDH1, MDM2 and TP53 (rows)
Similarly, the G-CIMP subtype was reported to have characteristic somatic mutations at IDH1 and ATRX (Verhaak et al., 2010; Brennan et al., 2013). Our analysis recovered these genes within a larger ‘ABCB1-RB1-ATRX’ subnetwork (Fig. 4A). ABCB1 encodes a ATP-binding cassette transporter well-known to be involved in doxorubicin resistance in cancer therapy (Bray et al., 2010). RB, encoded by RB1, has been recognized to play important roles in doxorubicin-induced senescence of breast cancer cells (Jackson and Pereira-Smith, 2006). Thus, mutations on ABCB1 may regulate RB in tumors treated with doxorubicin. RB is also a known transcriptional repressor of cell cycle, which can control the expression of ATRX, a chromatin remodeler, through inhibition of E2F1 (Gerstein et al., 2012).
The recovered subnetworks were reasonably stable across five different splits of the training/validation data: 9/18 signature genes were selected in most (≥3) splits, while 7/18 were selected in all (5) splits.
Another interesting finding concerns the interactions removed from the network by the NBS2 algorithm (i.e. heavily downweighted), including the three molecular interactions IDH1-EGFR, TP53-EGFR and MDM2-TP53 (Fig. 4A). The four genes connected by these interactions are characteristic of different subtypes: IDH1 is almost exclusively mutated in G-CIMP; EGFR alterations are enriched in the Classical subtype; TP53 is recurrently mutated in G-CIMP and Proneural subtypes but lacks mutations in the Classical subtype; and MDM2 mutations are enriched in both Proneural and Neural subtypes (Fig. 4B). Given these events define different subtypes during training, the algorithm has learned to prohibit sharing of mutation information across these interactions. Remarkably, the mutations of these three gene pairs are all mutually exclusive (Fig. 4B, Fisher’s exact test P < 0.001), a feature that has been used extensively to prioritize functionally related cancer genes (Ciriello et al., 2012). Previous studies (Leiserson et al., 2015b) demonstrated that mutual exclusivity can arise as a consequence of two cancer subtypes with different characteristic alterations. Our results confirm such observation: the mutual exclusivity among these genes may be driven not by functional similarity of mutations but by the genomically and functionally distinct nature of different subtypes. In addition, our method also provides a systematic way to differentiate whether or not mutual exclusivity of a pair of genes is due to cancer evolutionary pressure.
When we examined the interaction feature weights, we found that ‘Epithelial-mesenchymal transition (EMT)’ and ‘Mutual exclusivity’ were assigned large positive values, suggesting that propagating mutations through interactions marked by EMT-pathway and Mutual-Exclusivity features is favorable for stratification. ‘Mutation rate of the target gene’ was assigned a large negative weight, indicating that random walks from a rarely mutated gene to a recurrently mutated gene was not favorable.
3.3 Classification of breast cancer
As a second case study we examined breast cancer, a heterogeneous disease that has been previously stratified into four subtypes—Basal, Her2, Luminal A and Luminal B—based on molecular alterations, cellular composition and/or clinical outcomes (Prat and Perou, 2011). For instance, the Her2 subtype is characterized by ERBB2 amplification and poor prognosis, whereas the Luminal A subtype is characterized by normal estrogen receptor (ER positive), low tumor grade, good prognosis and low risk of relapse. These subtypes have been intensively studied and repeatedly identified by clustering of mRNA expression data (Perou et al., 2000; Parker et al., 2009).
3.3.1 Breast cancer data processing
We collected somatic mutation and copy number alteration (CNA) data from 863 breast tumors (Cancer Genome Atlas Network, 2012; Ciriello et al., 2015) which we divided into a training (577 tumors) and a validation set (286 tumors). The data were then preprocessed as for GBM, resulting in a pruned network with 557 nodes (genes) and 16 590 edges (interactions). For each edge, we generated the same 76 features as in the GBM network (Sections 2.6 and 3.2.1, Supplementary Table S1).
3.3.2 Performance of breast cancer subtype classification
We evaluated predictive performance on the breast cancer data in a similar way as we did for GBM. During training, the algorithm converged in about 200 iterations and achieved approximately 70% classification accuracy (Fig. 5A). The accuracy of the 286-tumor validation set also increased from 53% to 68% (Fig. 5B). Notably, the prediction performance of BRCA was better than that of GBM. The main reason is that 50% of BRCA samples are of type Luminal A, indicating that a naive classifier could achieve a baseline of 50% accuracy simply by always predicting this subtype label. The GBM subtypes are more balanced, resulting in a lower baseline prediction accuracy around 32% (Supplementary Table S2). Importantly, the gain in prediction accuracy (10–20%) is very significant for both tissues. The precision and recall were very good for Basal and Luminal A (66–79%, Table 3) and acceptable for the HER2 subtype (precision = 46%, recall = 60%). The recall was a bit lower for Luminal B (35%), in which 24 tumors were mistakenly predicted as Luminal A. This is understandable as the Luminal cancers are the most heterogeneous in terms of mutation spectrum (Cancer Genome Atlas Network, 2012). We next compared this validation accuracy to the baselines achieved by unsupervised RWR (53%) or mutation profiles (56%). Overall NBS2 achieved a 12–15% improvement over baseline methods (Fig. 5B).
Breast cancer validation performance
| Predicted | ||||||
|---|---|---|---|---|---|---|
| Basal | HER2 | Lum A | Lum B | |||
| Subtype as defined previously by expression | Basal | 40 | 1 | 8 | 4 | 53 |
| HER2 | 3 | 12 | 2 | 3 | 20 | |
| LUM A | 10 | 6 | 121 | 16 | 153 | |
| LUM B | 8 | 7 | 24 | 21 | 60 | |
| 61 | 26 | 155 | 44 | |||
| Predicted | ||||||
|---|---|---|---|---|---|---|
| Basal | HER2 | Lum A | Lum B | |||
| Subtype as defined previously by expression | Basal | 40 | 1 | 8 | 4 | 53 |
| HER2 | 3 | 12 | 2 | 3 | 20 | |
| LUM A | 10 | 6 | 121 | 16 | 153 | |
| LUM B | 8 | 7 | 24 | 21 | 60 | |
| 61 | 26 | 155 | 44 | |||
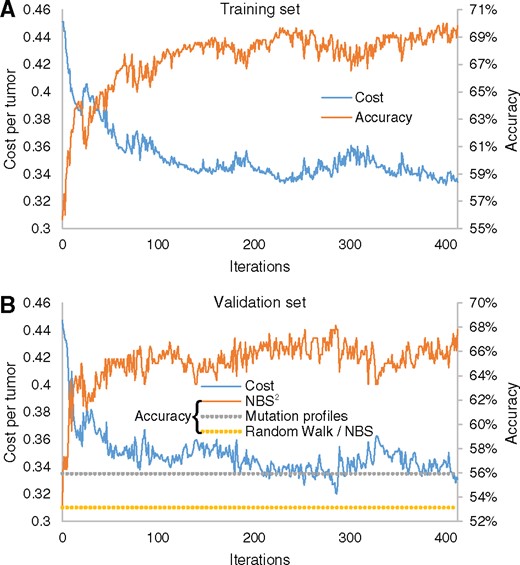
Performance of breast cancer subtype classification. Values of cost function (left y-axis) and classification accuracy (right y-axis) are plotted against the number of iterations of NBS2 on the (A) training data and (B) validation data. Dashed line indicates the accuracy of tumor stratification based on unsupervised random walk and non-propagated mutation profiles
3.3.3 Characteristic subnetworks of breast cancer subtypes
At convergence, the weighted interactions revealed subtype-characteristic subnetworks (Fig. 6A). The resultant subnetworks were stable across five different splits of the training/validation data: 18/30 genes were selected in most (≥3) splits, while 9/30 were selected in all (5) splits. The Luminal A subtype was characterized by a 10-gene subnetwork centered on PIK3CA, CDH1, CCND1 and NOTCH1. These genes were highly interconnected, indicating synergies between their mutations: for example, Cadherin 1 (encoded by CDH1) does not only activate PI3K (partially encoded by PIK3CA) (Xie and Bikle, 2007), but also interacts with and degrades cyclin D1 (encoded by CCND1) (Pawar et al., 2010), which regulates cell cycle. Beyond the interactions with CDH1, PI3K is required for expression of cyclin D1 (Ye et al., 2000). This subnetwork also linked to Notch1, which forms a complex with PI3K (Sade et al., 2004) and, separately, promotes the reduction of E-cadherin levels (Fujiki et al., 2014).
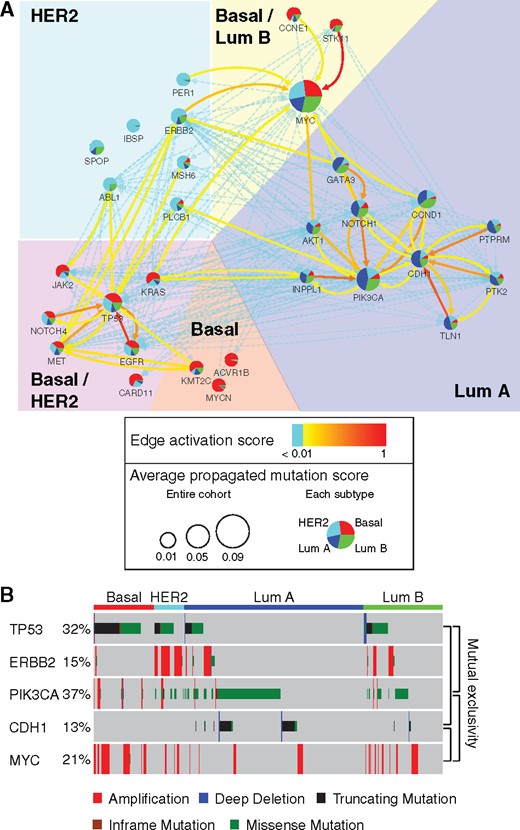
Subnetworks of breast cancer subtypes. (A) (http://www.ndexbio.org/#/network/dd268e2f-fd4d-11e7-adc1-0ac135e8bacf) Subnetworks characterizing breast cancer subtypes extracted from Pathway Commons by NBS2, defined as for GBM in Figure 4. (B) Mutation profiles and subtype assignments of individual tumors (columns) associated with genes TP53, ERBB2, PIK3CA, CDH1 and MYC (rows)
A second subnetwork of interest, characterizing both Basal and HER2 subtypes, contained interactions between TP53, EGFR, NOTCH4 and MET. P53 (encoded by TP53) transcriptionally activates oncogenes EGFR (Ludes-Meyers et al., 1996) and c-met (encoded by MET) (Seol et al., 1999). Separately, P53 also suppresses Notch4-associated tumorigenesis (Sun et al., 2011). The mutations on these genes may thus be functionally related in Basal/HER2 cancers.
Many of the interactions that were removed connect genes characterizing different subtypes, including TP53-PIK3CA, TP53-MYC, ERBB2-PIK3CA and ERBB2-CDH1. As described above, TP53 mutations characterize Basal and HER2 subtypes; PIK3CA and CDH1 mutations characterize the Luminal A subtype. In addition, ERBB2 amplification defines the HER2 subtype; and MYC amplification is enriched in Basal and Luminal B subtypes (Fig. 4C). Similar to the GBM network, traversal through these interactions was prohibited during supervised learning so as to avoid cross-contamination between different subtype-characteristic mutation signals.
In terms of interaction features, we found that ‘CORUM’ (the protein complex database) and ‘Epithelial-mesenchymal transition (EMT)’ were assigned the largest positive weights, and ‘Intercept’ was assigned the largest negative weight. These weights indicated that random walks were generally prohibited for all edges except for those supported by select edge features such as high-quality protein complexes or known interactions in the EMT pathway.
4 Discussion
We have presented Network-Based Supervised Stratification (NBS2), a supervised random walk algorithm for cancer subtype classification. Given a reference molecular network and tumor mutation profiles, NBS2 learns a strategy to guide the direction of network propagation for better subtype classification. Case studies on glioblastoma and breast tumors demonstrated that NBS2 significantly outperforms state-of-the-art unsupervised methods. By dissecting the learned model, NBS2 was able to highlight underlying biological pathways characteristic of cancer subtypes.
In future, we anticipate that NBS2 can be extended in several ways. First, from a computational point of view, the linear scoring function of features could be replaced by a non-linear function (e.g. neural network) to capture more complicated relationships between genetic features and clinical measurements. Second, although our analysis focused on glioblastoma and breast cancer, the methodology is general and could be applied to other cancer types or complex diseases in which information on somatic mutations or inherited variants is available. Furthermore, the method is extensible to other types of ‘omics’ data such as gene expression, epigenomics, proteomic and metabolic profiles and so on.
From a biological perspective, gene expression-based cancer subtypes have been extensively studied as they are sometimes associated with distinct molecular, cellular, clinical and therapeutic characteristics (Brennan et al., 2013; Prat and Perou, 2011; Cancer Genome Atlas Research Network, 2011; Li et al., 2009). However, it has been a long standing challenge to connect such expression patterns to their underlying mechanistic basis, that is, the genetic alterations that drive them. In this study, the networks identified by NBS2 create bridges between mutations and gene expression-based subtypes in GBM and BRCA.
Finally, our results provide an important counterexample of the notion that mutual exclusivity always indicates co-function within a pathway (Ciriello et al., 2012). Here, we found that it is sometimes driven by the genomically and functionally distinct nature of different subtypes.
Acknowledgements
The results are in whole or part based upon data generated by the TCGA: http://cancergenome.nih.gov/. Networks (Figs. 4A and 6A) have been deposited to NDEx (Pillich et al., 2017; Pratt et al., 2015, 2017). We would like to thank members of the Ideker laboratory for valuable comments on this work.
Funding
This work was supported by NIH grants to T.I. (U24CA184427, U54CA209891, P50GM085764, P41GM103504 and R01GM070743).
Conflict of Interest: Trey Ideker is co-founder of Data4Cure, Inc. and has an equity interest. Trey Ideker has an equity interest in Ideaya BioSciences, Inc. The terms of this arrangement have been reviewed and approved by the University of California, San Diego, in accordance with its conflict of interest policies. No potential conflicts of interest were disclosed by the other authors.
References
Author notes
The authors wish it to be known that, in their opinion, Wei Zhang and Jianzhu Ma authors should be regarded as Joint First Authors.

