


Abstract
A chief goal of systems biology is the reconstruction of large-scale executable models of cellular processes of interest. While accurate continuous models are still beyond reach, a powerful alternative is to learn a logical model of the processes under study, which predicts the logical state of any node of the model as a Boolean function of its incoming nodes. Key to learning such models is the functional annotation of the underlying physical interactions with activation/repression (sign) effects. Such annotations are pretty common for a few well-studied biological pathways.
Here we present a novel optimization framework for large-scale sign annotation that employs different plausible models of signaling and combines them in a rigorous manner. We apply our framework to two large-scale knockout datasets in yeast and evaluate its different components as well as the combined model to predict signs of different subsets of physical interactions. Overall, we obtain an accurate predictor that outperforms previous work by a considerable margin.
The code is publicly available at https://github.com/spatkar94/NetworkAnnotation.git.
1 Introduction
With increased mapping of physical interactions in living cells (Huttlin et al., 2017), we now have a blueprint of the inner workings of the cell. However, the functional interpretation of this map to simulate the behavior of the cell under different genetic and environmental cues is still beyond reach. One fundamental piece of information that is often missing is the annotation of the network interactions with direction of signal flow and functional activation/repression (sign) effects. The interpretation of the latter effects depends on the type of the physical interaction being considered. For protein–DNA interactions (PDIs), a +/– sign describes a regulatory effect; for protein–protein interactions (PPIs), it represents a functional activation/repression effect. Currently, direction and sign information is available to only a few well-studied pathways (see Fig. 1 for an example), although a large fraction (40–70%) of the PPIs are expected to admit such an annotation (Silberberg et al., 2014). The inference of such annotation information is a pre-condition to any logical model of a system under study [see, e.g. (Morris et al., 2010)].
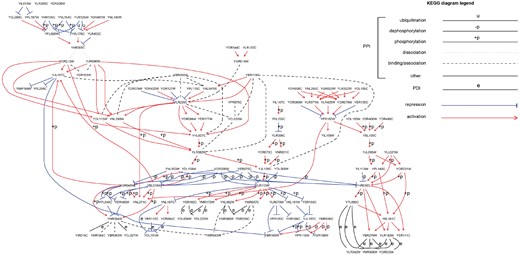
The yeast signaling pathways from KEGG in one network depicting the organization of different types of physical interactions with their respective experimentally derived signs (activation/repression) and directions
A pioneering work by Yeang et al. (2004) for network annotation suggested a simple yet effective logical model for signaling whereby physical interactions are directed and signed, and a signal can flow along a directed path with its effect being the aggregate effect of its member interactions, i.e. the product of their signs. To tackle the annotation challenge, Yeang et al. suggested a machine learning framework, but their method was limited to physical networks of small scale where it is possible to enumerate all paths. Subsequent work in this area adopted the signaling model suggested by Yeang et al. but employed (to the most part) combinatorial methods to learn the hidden annotations. In the most common scenario, one is given a partially annotated physical interaction network and a list of pairs of genes obtained from knockout experiments in which a knockout gene (cause, or source) affected the expression of some other gene (effect, or target). The goal is to annotate the remaining interactions in the physical network with directions and signs such that a maximum number of knockout pairs can be explained by the model.
The problem of inferring interaction directions so that a maximum number of pairs admit a directed path from the cause to the effect was shown to be non-deterministic polynomial time (NP)-hard and a sub-logarithmic approximation algorithm was given for it (Blokh et al., 2013). Using SAT solvers and integer linear programming (ILP) techniques, optimal algorithms were given for various variants of the problem (Gitter et al., 2011; Silverbush et al., 2011; Silverbush and Sharan, 2014), potentially restricting the length of the path connecting each cause-effect pair. In addition, a machine learning based inference method was suggested by Stelzl et al. (2005).
In contrast, the problem of inferring interaction signs received far less attention. Ourfali et al. (2007) considered explanatory paths of very short length (3) and provided ILP formulations to maximize the expected number of pairs that can be explained in a probabilistic network. Peleg et al. (2010) showed that the sign assignment problem is NP-hard and developed network-free algorithms for predicting genome-wide effects of gene knockouts. A related approach using regression was adopted by Cosgrove et al. (2008) to distinguish direct and indirect targets of cell perturbation. Houri and Sharan (2012) were the first to tackle the problem of inferring physical interaction signs on a network while accounting for paths of any length. Specifically, they searched for an assignment that maximized the number of pairs that admit a path of the required sign. They provided network reduction techniques and an ILP formulation to solve this problem to optimality on current physical interaction networks. However, their algorithm could only account for a small fraction of physical interactions in the network (low coverage), as most were contracted in their network reduction step.
In this paper, we present novel network based ILP formulations for the purpose of predicting interaction signs in a physical network. The models we propose bypass the issue of network reduction and thus significantly improve the scale of predictions that can be made. In particular, we consider signaling models where a pair is explained by (i) a shortest path connecting the pair having a desired sign (ASP), (ii) a directed shortest path connecting its nodes having a pre-defined sign (AdirSP) and (iii) all shortest paths connecting its nodes having a desired sign (AllSP). We then evaluate the performance of each model in predicting physical interaction signs in yeast over two different gene expression datasets. We show that these models lead to 15-fold higher coverage and higher accuracy than the state-of-the-art method of Houri and Sharan (2012). Additionally, we propose a machine learning approach for predicting interaction signs that combines features from each of these models and show that it improves over any individual model in predicting signs of previously annotated interactions.
2 Materials and methods
2.1 An optimization framework for sign prediction
In this section we describe novel algorithms for inferring signs of physical interactions. We start by formally defining the problem and sketching the previous approach of (Houri and Sharan, 2012). Then, we study three variants of the original problem (each describing a hypothetical signaling model) and develop novel ILP formulations to solve them to optimality on current networks. We assume we are given a (potentially partially signed) physical interaction network along with a collection of cause-effect gene pairs, such as commonly obtained from knockout experiments. The maximum sign assignment (MSA) problem is to assign signs to the unsigned edges of the network in a way that best explains the given pairs. We say that a cause-effect pair (s, t) with sign δst (+ encoding down-regulation of t in response to the knockout of s, − encoding up-regulation of t in response to the knockout of s) is explained or satisfied by a sign assignment, if there exists a path in the network from s to t whose aggregate sign (the product of the signs along its edges) is δst. Formally, MSA is defined as follows:
Input. A partially signed network G(V, E) and a set of k cause-effect pairswith signs
Goal. A sign assignment to the unsigned edges of the network such that a maximum number of input pairs are satisfied by the assignment.
This problem focuses on the hypothetical A-path signaling model of Yeang et al. (2004). Houri and Sharan (2012) showed that due to the nature of the model, any unsigned edge that lies on a cycle in the network cannot be uniquely signed. They generalized this notion to any 2-connected component (or block) by determining if these components are strongly signed. They then proposed an approach to reduce the input network to an acyclic one by contracting all edges in these strongly signed components without affecting the maximum number of pairs that could be satisfied. In the reduced network, every pair is connected by a unique path, facilitating the formulation of an ILP to assign signs to the unsigned edges of this path such that the number of satisfied pairs is maximized. A key drawback of this approach is that reducing the network to an acyclic one severely restricts the number of edges participating in the ILP (coverage) and, hence, restricts the number of interactions that can be uniquely signed. In subsequent paragraphs, we discuss three variants of MSA, each describing a different plausible signaling model, where edges lying on cycles may have unique signs and, hence, may no longer be contracted.
Let l denote a layer of Gs such that all nodes belonging to this layer have . Given a feasible solution to the ILP, if yst = 1 we can show that there exists a shortest path from s to t with aggregate sign δst. Indeed, if yst = 1 then cst = 0 by the third constraint. This implies that . Thus, if t is in layer l of Gs, there must exist a neighbor u of t in layer l −1 such that csu = 0. Furthermore, if cst = 0, xut is bound by the XOR constraint to have a sign whose product with rsu is δst. Similarly, if csu = 0, there must be a neighbor w in layer l − 2 where csw = 0 and . By carefully investigating the constraints applicable to the subsequent layers of Gs (i.e. ) we find that there must exist a shortest path from s to t such that the product of signs along its edges is δst. The final two constraints incorporate prior knowledge of signs in the ILP.
Notably, the models discussed above permit mathematically efficient formulations. Specifically, if p is the number of sources (), then each formulation contains variables and constraints.
2.2 Quantifying the activation/repression potential of a physical interaction
Each of the above models may admit multiple sign assignments with optimal or near optimal scores. Hence, it is necessary to quantify the robustness of a sign assignment to an edge. To this end, we solve each ILP repeatedly n times; each time adding a small Gaussian noise of mean 0 and variance 0.01 to the objective function as shown below. This stochastic approach, motivated by Hazan and Jaakkola (2012), effectively results in a random sampling of different likely solutions that exist nearby in the optimum solution space, thereby allowing us to assess the robustness of the sign on each edge. The procedure is as follows:
1: procedure GetScores(ILP, n)
2: that are in ILP
3: for i = 1: n
4: , where ɛst(0, 0.01)
5:
6: that are in ILP
7: return scores
An edge score close to 1 implies that the sign is negative with high confidence, a score close to 0 implies a positive sign with high confidence and a score close to 0.5 implies that the sign on that edge cannot be uniquely determined (possibly implicating the absence of an activation/repression effect). For efficiency, we use n = 10 throughout. Our results remain qualitatively the same for larger values of n.
3 Results
3.1 Input data
We focused our analysis on budding yeast (Saccharomyces cerevisiae). We obtained 4095 PDIs spanning 2079 proteins (conserved across at least two other yeast species) from MacIsaac et al. (2006). We additionally downloaded 2930 high-quality experimentally verified PPIs from Yu et al. (2008), 1361 kinase–substrate/phosphatase–substrate interactions (KPIs) among 802 proteins from Breitkreutz et al. (2010), and 189 physical interactions from signaling pathways of yeast in Kyoto Encyclopedia of Genes and Genomes (KEGG). We merged these sets into a unified yeast network of 8268 unique physical interactions among 3695 proteins.
We extracted all 110 487 knockout pairs spanning 6228 proteins from Reimand et al. (2010) and additionally 699 771 pairs spanning 6110 proteins from Kemmeren et al. (2014). A pair was assigned a positive sign if the target gene was repressed in response to knockout of the source, and a negative sign if the target gene was activated/up-regulated. We restricted ourselves to knockout pairs such that the absolute log fold change in expression of the target gene is >2 and FDR < 0.001. This leaves us with 1756 significant knockout pairs from Reimand et al. (2010), referred to here as the Reimand set, and 3524 significant knockout pairs from Kemmeren et al. (2014), referred to here as the Kemmeren set. The above choice of thresholds was made while taking into consideration the inherent computational complexity of the problem.
3.2 Validation data
For a systematic validation of our sign prediction models we collected sign information as follows. Only 147 of 192 physical interactions in yeast had an experimentally confirmed sign from KEGG (See Fig. 1).
In addition, following Houri and Sharan (2012), we extracted gene ontology (GO) molecular function annotations related to transcriptional activators (GO: 0045893) and transcriptional repressors (GO: 0045892). PDIs originating from transcriptional activators were given a positive sign whereas PDIs originating from transcriptional repressors were given a negative sign. Finally, we also extracted information on protein kinases (GO: 0004672) and protein phosphatases (GO: 0004721). We reasoned that since there are roughly three times as many confirmed functionally activating phophorylation sites compared to repressive ones (PhosphoNET database, www.phosphonet.ca), and that 71% of phosphorylation interactions of yeast in KEGG are annotated as activating and 81% of de-phosphorylation interactions of yeast are annotated as repressing, kinase–substrate interactions tend to be activating while phosphatase–substrate interactions tend to be repressing. Thus, physical interactions linking a GO annotated kinase and a substrate were given a positive sign whereas interactions linking a GO annotated phosphatase to a substrate were given a negative sign. Any interaction in the unified network that had conflicting signs was left unsigned (unless it had sign information from KEGG, in which case this latter information was used).
In summary, the validation set consists of three groups of signed interactions in the network: (i) 2014 (1131+, 883−) signed PDIs, (ii) 1044 (872+, 172−) signed kinase/phosphatase–substrate interactions and (iii) 147 (96+, 51−) signed KEGG interactions.
3.3 Performance evaluation of individual models
We evaluated each of the four models presented above (A-path/ASP/AdirSP/AllSP) in a 5-fold cross-validation setting on the unified yeast network, focusing on the interactions covered by each model, i.e. participating in the corresponding ILP. To this end, we randomly divided all signed and covered interactions into five equal parts. Using each model, we predicted the activation/repression potential of the interactions in each part (see Section 2.2) while constraining the signs of interactions in the remaining parts. Then we measured the performance of the activation/repression scores of a given model across the five parts for different subsets of signed interactions covered by the model. For each subset, we denote its set of covered positive and negative interactions by E+ and E−, respectively.
As a benchmark, we discuss the performance of the previous A-path model. Recall that in this model we should contract all interactions that lie in a strongly signed block of size (see Section 2.1). Since all blocks were strongly signed, this resulted in an acyclic network with 77% of the interactions contracted. When working with knockout pairs from the Reimand set, we observe that only 1% of all the network interactions participate in the ILP constraints due to network reduction, and 25 of them belong to the validation set. Due to low coverage over the validation set, we instead evaluated this framework using knockout pairs from the Kemmeren set. Overall, 4% of network interactions are covered in this instance and 73 interactions from the validation set were part of the ILP formulation, yielding an AUC of 0.66. Since there were only 73 interactions to validate our predictions, we could not evaluate the performance on individual subsets.
Next, we evaluated the ASP, AdirSP and AllSP models over the unified network. Tables 1 and 2 summarize the performance over the validation PDIs, KPIs and the KEGG interactions. We find that our new formulations lead to sign assignments on 35% of network interactions when working with the Reimand set and 59% of network interactions when working with the Kemmeren set; 15-fold coverage increase compared to previous work (A-path).
Performance evaluation using the Reimand set (coverage of 35%)
| Interaction | AUC | AUC | AUC | |
|---|---|---|---|---|
| (ASP) | (AdirSP) | (AllSP) | ||
| PDI | 435, 458 | 0.75 | 0.63 | 0.84 |
| KPI | 205, 20 | 0.83 | 0.56 | 0.72 |
| KEGG | 40, 27 | 0.56 | 0.52 | 0.65 |
| Interaction | AUC | AUC | AUC | |
|---|---|---|---|---|
| (ASP) | (AdirSP) | (AllSP) | ||
| PDI | 435, 458 | 0.75 | 0.63 | 0.84 |
| KPI | 205, 20 | 0.83 | 0.56 | 0.72 |
| KEGG | 40, 27 | 0.56 | 0.52 | 0.65 |
Performance evaluation using the Kemmeren set (coverage of 59%)
| Interaction | AUC | AUC | AUC | |
|---|---|---|---|---|
| (ASP) | (AdirSP) | (AllSP) | ||
| PDI | 744, 653 | 0.63 | 0.59 | 0.83 |
| KPI | 522, 98 | 0.61 | 0.51 | 0.77 |
| KEGG | 46, 32 | 0.58 | 0.54 | 0.71 |
| Interaction | AUC | AUC | AUC | |
|---|---|---|---|---|
| (ASP) | (AdirSP) | (AllSP) | ||
| PDI | 744, 653 | 0.63 | 0.59 | 0.83 |
| KPI | 522, 98 | 0.61 | 0.51 | 0.77 |
| KEGG | 46, 32 | 0.58 | 0.54 | 0.71 |
In order to directly compare the performance of the A-path model to our suggested alternative models, we evaluated them on the restricted validation set of 73 interactions covered by the A-path model. On this set () the performance of AdirSP was lower to A-path (AUC of 0.64), while ASP and AllSP had better performance (AUCs of 0.73 and 0.68, respectively).
3.4 Performance evaluation of the combined model
Previous work as well as our models above vary in the assumptions they make on the way a knockout effect is explained, going all the way from requiring a single path of any length to requiring all paths of shortest length. Note that we adopt these models partly because they are grounded in our very own observations of cellular signaling pathways (see Section 2.1) and because they permit an efficient mathematical formulation. These descriptions are not perfect. In turn, the solution of each model allows different degrees of freedom on the signs of underlying interactions. To make the best inference possible for each physical interaction given the complex nature of cellular signaling, we integrate the predictions of each model in an ensemble. That is, using the sign scores from solutions to ASP, AdirSP and AllSP as features, we train a hybrid model, specifically a random forest classifier, that makes an overall prediction of the sign of an interaction (A-path was excluded due to low coverage).
The ensemble model is evaluated via nested cross-validation. In detail, the validation set is divided into the same five parts as above. Four of the parts are used for training the individual models to score the fifth part. Next, we perform a 5-fold cross-validation on the fifth part to train and test the classifier. Finally, using the cross-validated predictions across all parts, we report the mean classifier performance (AUC) against the signs of different validation subsets. Tables 3 and 4 summarize the performance of the random forest classifier on the different knockout sets and validation subsets.
Performance evaluation of the random forest classifier using the Reimand set
| Interaction | AUC | |
|---|---|---|
| (classifier) | ||
| PDI | 435, 458 | 0.86 |
| KPI | 205, 20 | 0.85 |
| KEGG | 40, 27 | 0.77 |
| Interaction | AUC | |
|---|---|---|
| (classifier) | ||
| PDI | 435, 458 | 0.86 |
| KPI | 205, 20 | 0.85 |
| KEGG | 40, 27 | 0.77 |
Performance evaluation of the random forest classifier using the Kemmeren set
| Interaction | AUC | |
|---|---|---|
| (classifier) | ||
| PDI | 744, 653 | 0.80 |
| KPI | 522, 98 | 0.67 |
| KEGG | 46, 32 | 0.81 |
| Interaction | AUC | |
|---|---|---|
| (classifier) | ||
| PDI | 744, 653 | 0.80 |
| KPI | 522, 98 | 0.67 |
| KEGG | 46, 32 | 0.81 |
The performances of the classifier and the individual models are depicted in Figures 2 and 3. Importantly, we observe that the classifier outperforms all individual models on the set of curated interactions from KEGG. It also outperforms the different models with respect to PDIs and KPIs on the Reimand set. The lower performance of the classifier on the KPI set (compared with the AllSP model) when working with the Kemmeren set is likely an artifact resulting from the skewed distribution of class labels. Such a skew may influence ensemble classifier performance on unseen data. (Galar et al., 2012).
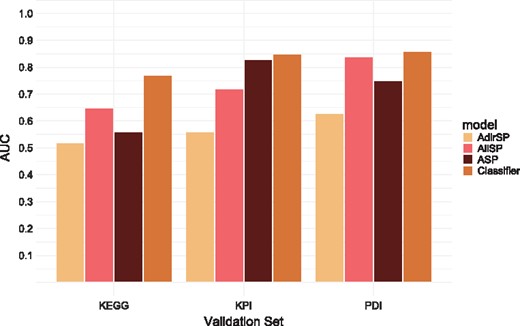
Performance evaluation of all models using the Reimand set
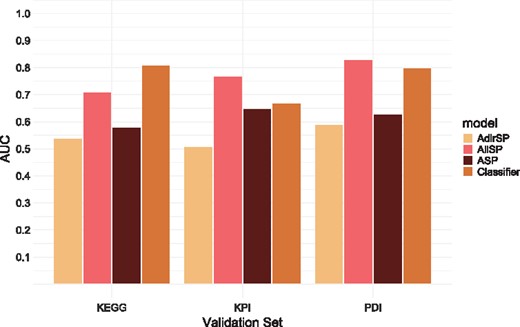
Performance evaluation of all models using the Kemmeren set
4 Conclusions
In summary, we developed novel ILP formulations for predicting signs of physical interactions under different signaling models. We discussed the underlying assumptions guiding the predictions of each model and its advantages in terms of coverage relative to prior work by Houri and Sharan (2012). We then measured the cross-validation accuracy of our models in predicting signs across two knockout datasets to find that our models lead to improvement in accuracy and coverage over the previous state-of-the art method by Houri and Sharan (2012). Finally, we derive a hybrid signaling model based classifier that uses the sign assignment confidence scores of each model studied for predicting interaction signs. This was partly motivated by the fact that the three models presented in the paper, although mathematically efficient to represent, may be insufficient to capture the complex nature of cell signaling. Furthermore, this warrants the exploration of other plausible models that could be potentially integrated into the classifier to improve its predictions. For instance, one could additionally formulate an ILP that considers All-Directed Shortest paths (All-dirSP) as a plausible signaling mechanism to explain some of the knockout effects. Notably, the AdirSP model is the first to combine both direction and sign prediction within the same optimization framework and may be of independent interest to readers to expand on for the general problem of annotating a network with directions and signs.
A potential limitation of our approach is the computational cost involved in solving the models (especially if the network is sparsely annotated with signs). In this work, running the AllSP model on the Kemmeren set took the most time (up to 3 h to obtain a single solution). In all other cases it took on average 3 min to obtain a single solution (note that these values may differ based on the solver and the computer used). A theoretical comparison of efficiency can be done by analytically reasoning about the size of the search space for each model. The ASP and AdirSP models require O(d) XOR constraints to be satisfied to explain a single knockout pair (s, t) (where d denotes the shortest path distance from s to t). In contrast, the AllSP model requires a much larger number of XOR constraints to be satisfied to explain a single knockout effect (where denotes the number of edges in the network). Each constraint introduces at least one new Boolean variable and hence the search space for AllSP is much larger than that for ASP or AdirSP. This might pose a major limitation when it comes to predicting physical interaction signs over much larger networks, e.g. the human network, which still remains mostly unsigned. To enhance the scalability of our methods, one can pre-process the network and either contract interactions involved in protein complexes or pre-annotate them with positive signs (which are logically consistent with their role as a means to propagate signal forward without influencing the overall effect of the path taken). This vastly cuts down the size of the solution space; by half per interaction. The different models we proposed represent a trade-off between model coverage (of networks edges) and complexity (of its solution).
Another limitation of our results is that they are based on two approximate sources of sign information, namely KPI signs derived from whether the source protein is a kinase or a phosphatase and PDI signs derived from whether the involved transcription factor is an activator or a repressor. We expect our models to yield more accurate results as better quality sign information becomes available.
Acknowledgements
We thank Eytan Ruppin, Sridhar Hannenhalli and Dana Silverbush for helpful discussions about this work.
Funding
R.S. was supported by a research grant from the I-CORE Program (grant 757/12).
Conflict of Interest: none declared.
References

