


Abstract
Several large-scale efforts have been made to collect gene expression signatures from a variety of biological conditions, such as response of cell lines to treatment with drugs, or tumor samples with different characteristics. These gene signature collections are utilized through bioinformatics tools for ‘signature matching’, whereby a researcher studying an expression profile can identify previously cataloged biological conditions most related to their profile. Signature matching tools typically retrieve from the collection the signature that has highest similarity to the user-provided profile. Alternatively, classification models may be applied where each biological condition in the signature collection is a class label; however, such models are trained on the collection of available signatures and may not generalize to the novel cellular context or cell line of the researcher’s expression profile.
We present an advanced multi-way classification algorithm for signature matching, called SigMat, that is trained on a large signature collection from a well-studied cellular context, but can also classify signatures from other cell types by relying on an additional, small collection of signatures representing the target cell type. It uses these ‘tuning data’ to learn two additional parameters that help adapt its predictions for other cellular contexts. SigMat outperforms other similarity scores and classification methods in identifying the correct label of a query expression profile from as many as 244 or 500 candidate classes (drug treatments) cataloged by the LINCS L1000 project. SigMat retains its high accuracy in cross-cell line applications even when the amount of tuning data is severely limited.
SigMat is available on GitHub at https://github.com/JinfengXiao/SigMat.
Supplementary data are available at Bioinformatics online.
1 Introduction
Matching a gene signature, i.e. expression profile of a sample or set of dysregulated genes in a sample, to a library of pre-determined signatures is a common step in studies on drug development as well as disease diagnosis and prognosis. Large compendia of gene signatures have been created by expression-profiling of cell lines treated with specific drugs, e.g. Connectivity Map (CMAP) (Lamb, 2006) and LINCS L1000 (Subramanian, et al., 2017), or tumor samples of different cancers, e.g. MSigDB (Liberzon, et al., 2011), and support online queries with user-provided signatures. Matching of drug treatment signatures is often used for identifying related drugs and mechanisms of action (Clark, et al., 2014). Likewise, gene signatures are used in cancer studies for subtyping of patients and improving prognosis (van de Vijver, et al., 2002).
Signature matching tools provide researchers with two types of information about their ‘query’ signature. First, certain tools retrieve individual experiments in the database that are most related to the query, typically by pairwise signature comparison through a similarity score such as correlation coefficient (Tenenbaum, et al., 2008), the Kolmogorov-Smirnov statistic (Lamb, 2006), Fisher’s test (Yi, et al., 2007) and Wilcoxon rank-sum test (Gower, et al., 2011). Second, there exist tools that identify or rank classes of experimental conditions in the database that comprise signatures most similar to the query signature. (A class here refers to a set of experiments performed under common conditions.) This is typically achieved by aggregating similarity scores computed between the query signature and each signature in a class (Lamb, 2006). However, for rich compendia such as the CMAP and LINCS that include signatures for large numbers of drugs in many cell lines, the current approach of matching a query separately to each class may not be optimal. Rather, it is reasonable to expect that a discriminative approach trained to perform multi-label classification will improve the accuracy of signature matching. This is the premise of the current work, where we develop a new multi-way classifier that can accurately match a given gene signature to the most related class of signatures in a database, thus yielding insights into the query signature.
A key challenge for us was to match signatures across cell lines. For instance, if the query signature represents a drug D in a less-studied cell line C1, and the database has signatures for that drug (as well as other drugs) in a different cell line C2, the classifier should be able to match the query to its drug class D, despite not having seen training examples of the (D, C1) drug-cell line combination. This is a practical problem, since gene signature compendia such as LINCS L1000 have a stark imbalance in representation of cell lines, with an overwhelming majority of experiments being done on a small set of cell lines, and a sparse representation of other cell lines. When a signature from a less-studied cell line is used as a query, it is likely to get matched to profiles from the over-represented cell lines. Addressing this challenge is an important feature of our new method.
In this work, we propose SigMat, a classification-based approach for gene signature matching. Our presentation and evaluations are specific to the case where signatures represent drug treatments (LINCS database), but the approach is generally applicable to other domains where gene signatures are used. Given a compendium of gene signatures from a cell line, organized as classes defined by common conditions (e.g. drug), SigMat can predict the class that a given (previously unseen) signature belongs to. It can do so even if the query signature is from a cell line different from the training cell line. For this, it relies on a ‘tuning’ dataset of signatures from the cell line of the query, which may be much sparser than the training data and may or may not include signatures from the same class as the query. SigMat is a modified kernel support vector machine algorithm with two-step training: (i) It learns its linear (SVM) classification parameters from training data representing different experimental classes (such as drugs) on a well-characterized cell line. (ii) In a subsequent ‘tuning’ phase it learns a cell line-specific scaling parameter from sparse training data on less-studied cell lines where several of the classes may not be represented. The scaling parameter is used to adjust the trained model for optimal predictive performance for the cell line of the query.
We evaluate the accuracy of signature matching with SigMat on a large dataset comprising 12 500 signatures over 9 cell lines, extracted from the LINCS database (Subramanian, et al., 2017) of drug treatments. We compare the new method to current approaches such as the connectivity score (Lamb, 2006), as well as several statistical and machine learning techniques, and find a substantial improvement, especially in cross-cell line prediction.
We provide SigMat as an open-source software available for download at https://github.com/JinfengXiao/SigMat.
2 Materials and methods
2.1 Data preparation
The LINCS L1000 database (Subramanian, et al., 2017) provides measured differential expression levels of 978 genes upon treating a cell line with a drug, for a combination of 72 cell lines and 20 413 drugs. The LINCS Consortium has deposited this dataset into the Gene Expression Omnibus (Edgar, et al., 2002) with the ID GSE92742. We refer to the 978-dimensional LINCS ‘level 4’ plate-normalized differential expression z-score vectors for each experiment as gene signatures. The combination is unbalanced, in the sense that there are nine cell lines—MCF7, PC3, A549, HA1E, A375, HT29, HEPG2, HCC515 and VCAP—on which far more drug-treatments and experiments were performed than other cell lines. We based our analysis on gene expression profiles of these nine well-studied cell lines. In order to evaluate cross-cell line predictions, we further restricted ourselves to drugs for which at least 10 experiments are available in at least two of the nine cell lines. If a drug D has at least 10 experiments in cell line C1 as well as cell line C2, we say that C1 and C2share that drug D. The number of shared drugs shared between each pair of cell lines is shown in Supplementary Table S1. For each cell line pair (C1, C2) and for each drug D shared by them, we randomly sampled 10 experiments representing drug D from each of C1 and C2. All samples together form our data pool. We refer to experiments on drug D in cell line C as (D, C) experiments.
In order to simulate an important use case for gene signature matching, we divided our data pool to represent the case when the user submits a query signature from an understudied cell line. First, we chose HEPG2 as our well-studied cell line, and took all sampled data in the data pool from HEPG2 as the training data. There are 244 drugs in the training data, naturally defining 244 training classes with 10 signatures per class. (We will first use models trained on HEPG2 to demonstrate detailed aspects of SigMat, and then present in Section 3.6 the results when training is done on other cell lines with as many as 500 training classes.) Next, we set another cell line, say C2, as the understudied cell line of the user, which provides some model tuning and testing data. For each drug D shared between HEPG2 and the cell line C2, we randomly sampled five of the ten (D, C2) experiments in our pool into our ‘all-drug tuning dataset’, and put the other five experiments in the ‘all-drug testing dataset’. The so-called ‘tuning data’ simulate the existing signatures in a gene expression database, while the testing data simulate the query signatures submitted by users. Compositions of the all-drug tuning dataset and all-drug testing dataset are shown in Table 1. We refer to this arrangement of the training, tuning and testing data, which contains all drugs shared with HEPG2, as ‘setting #0’. This setting allows testing of signature matching across cell lines, but anticipates that the tuning data includes experiments on the test drug in the appropriate cell line.
Composition of the training, tuning and testing datasets in ‘setting #0’
| MCF7 | PC3 | A549 | HA1E | A375 | HT29 | HCC515 | VCAP | HEPG2 | |
|---|---|---|---|---|---|---|---|---|---|
| #D | 153 | 152 | 131 | 127 | 131 | 133 | 129 | 50 | 244 |
| #Train/D | 10 | ||||||||
| #Tune/D | 5 | 5 | 5 | 5 | 5 | 5 | 5 | 5 | |
| #Test/D | 5 | 5 | 5 | 5 | 5 | 5 | 5 | 5 |
| MCF7 | PC3 | A549 | HA1E | A375 | HT29 | HCC515 | VCAP | HEPG2 | |
|---|---|---|---|---|---|---|---|---|---|
| #D | 153 | 152 | 131 | 127 | 131 | 133 | 129 | 50 | 244 |
| #Train/D | 10 | ||||||||
| #Tune/D | 5 | 5 | 5 | 5 | 5 | 5 | 5 | 5 | |
| #Test/D | 5 | 5 | 5 | 5 | 5 | 5 | 5 | 5 |
Note: #D: Number of drugs (i.e. classes) per cell line. #Train/D: Number of training signatures per drug per cell line. #Tune/D: Number of tuning signatures per drug per cell line. #Test/D: Number of testing signatures per drug per cell line. Blanks are zeros. The training, tuning and testing signatures do not overlap each other.
Additional settings were created to represent increasing sparsity of available data in databases on the user’s query cell line. Rather than explicitly including in the tuning data experiments for all drugs shared between HEPG2 and C2, we constructed additional settings where the tuning data encompasses only 75%, 50%, 25% or 5% of the shared drugs. The testing datasets for these new settings were then constructed from the experiments corresponding to the shared drugs that were not included in the tuning data. These settings (Table 2) allow us to evaluate how well a method performs on a new cell line that was not available for training and does not have tuning experiments for many of the training drug classes, especially the drug class of the test signature.
Different evaluation settings of cross-cell line prediction
| Setting # | Training | Tuning | Testing |
|---|---|---|---|
| 0 | 100% | 100% | 100% |
| 1 | 100% | 75% | 25% |
| 2 | 100% | 50% | 50% |
| 3 | 100% | 25% | 75% |
| 4 | 100% | 5% | 95% |
| Setting # | Training | Tuning | Testing |
|---|---|---|---|
| 0 | 100% | 100% | 100% |
| 1 | 100% | 75% | 25% |
| 2 | 100% | 50% | 50% |
| 3 | 100% | 25% | 75% |
| 4 | 100% | 5% | 95% |
Note: The three columns indicate the percentage of drugs ‘shared’ between the training cell line HEPG2 and the query cell line, that are used in the training, tuning and testing datasets respectively.
2.2 SigMat algorithm
Given training data from the cell line C1=HEPG2, tuning data from another cell line C2, and testing data from C2, SigMat learns a kernel SVM from the training data, adjusts its parameters using tuning data for enhanced performance on signatures from C2, and ranks the class labels (i.e. drugs) for their match to test signatures. The algorithm is outlined below.
- Compute the kernel function K(s1, s2) between each pair of signatures s1, s2 in the training data aswhere corr() represents the Spearman (rank) correlation coefficient of the two signatures.
- Train an ensemble of kernel support vector machine (KSVM) (Cristianini and Shawe-Taylor, 2000) binary classifiers on the training data, using the drug for each experiment as the training class label. We train the KSVM ensemble with the R package kernlab (Karatzoglou, et al., 2004). One binary classifier Bij is trained for each unordered pair of drugs (Di, Dj). Each Bij has its own set of support vectors Ωij. The number of parameters in Bij equals the number of its support vectors |Ωij| plus 1. The parameters and support vectors are then used to calculate the score of a new signature vector snew, by the classifier Bij:where N is the number of examples (signatures) in the training data, wkij’s are the linear classification parameters for Bij, and bij is a constant parameter for Bij. If KSVM is applied as it is, each Bij contributes a vote to Dj if , otherwise a vote to Di. Votes from all binary classifiers are then aggregated (and normalized to [−1, 1]) to score the match of to drug class Di, denoted by ‘KSVM-score()’.
- To allow the classifier to adjust its predictions for the test signature’s cell line C2, we modify the KSVM score (above) by introducing a positive scaling parameter α, so that the new score (called ‘KSVM-scaled’) is defined aswhere the value of α is chosen to maximize overall prediction accuracy (as defined in Section 2.4) on the tuning set of signatures from C2. (Note that the scaling parameter α is cell line-specific but not drug specific.) The KSVM-scaled score is used in a voting scheme as above to obtain the modified match score ‘KSVM-scaled-score()’.
- Our preliminary tests showed that the KSVM score has some degree of complementarity, in its predictive ability, to an alternative scheme of identifying the training signature st with greatest similarity (corr() ) to the test signature , and labeling the latter with the class of st. To combine the strengths of this ‘nearest-neighbor’ scheme with the KSVM approach, we scored the match of a test signature to a training drug class as an interpolation of the two scores:where is the maximum correlation between snew and training signatures in class Di, and β is a linear interpolation parameter whose value is chosen within [0, 1] to optimize the overall prediction accuracy on the tuning set.
Finally, drug classes Di are ranked for match to the query signature snew by the score SigMat.
In short, the kernel SVM score output from a binary classifier model trained on the training cell line data is scaled by a cell line-specific constant , aggregated across all binary classifiers to obtain multi-way classification score, and interpolated with a nearest-neighbor scoring scheme using a cell line-specific parameter , with parameters and being trained on tuning data from the appropriate cell line. If no prior signatures representing the test signature’s cell line are available, these two parameters may be set to 1.
2.3 Methods for comparison
For comparative study of the performance of SigMat and the effect of its cell line-specific parameters α and β, we also implemented other classification algorithms as well as variants of SigMat. Each method produces a score for each drug class Di in the training data given a signature s in the testing data, which is used to rank drugs in the training for match to s.
Spearman correlation. This is the ‘max-corr’ score introduced above, defined as the maximum Spearman correlation between s and training signatures in class Di.
Connectivity score (Lamb, 2006). This score, based on the Kolmogorov-Smirnov (KS) statistic, is used by CMAP to rank expression profiles. In our tests, we used the maximum connectivity score between s and training signatures in Di as the connectivity score between s and Di.
Support Vector Machine (SVM) (Cristianini and Shawe-Taylor, 2000). This is similar to the ‘KSVM-score’ introduced above, except that the kernel function is the Euclidian distance in the input space.
Random forests (RF) (Liaw and Wiener, 2002). A random forest is an ensemble of decision trees (Safavian and Landgrebe, 1991) generated with sample bootstrapping and feature subsampling. This model has proved powerful in many prediction tasks, including the classification of microarray data (Diaz-Uriarte and Alvarez de Andres, 2006), and serves in this manuscript as a representative of complex non-linear ensemble models. We used the Random Forest implementation in the R package randomForest (Liaw and Wiener, 2002) to perform multi-way classification of drug signatures, and used the classifier vote counts as the match score between a signature s and a drug class Di.
SigMat-α. This represents a variant of the SigMat model with its α parameter fixed to 1. Therefore, SigMat-α is a linear interpolation model between KSVM-score (Section 2.2) and maximum Spearman correlation.
SigMat-β. This represents a variant of the SigMat model with its β parameter fixed to 1. It is identical to the KSVM-scaled-score (Section 2.2).
SigMat-αβ. This represents a variant of our SigMat model with its α and β both fixed to 1. Therefore, SigMat-αβ is equivalent to KSVM-score.
2.4 Evaluation metric
3 Results
3.1 SigMat significantly improves drug signature matching across cell lines
We trained and tested SigMat and several other methods using the experimental settings #1–4 (Table 2), and evaluated AvgSuccess@10 on the testing data for each model (see ‘Materials and methods’ section). Recall that every test signature is scored against M = 244 drug classes in the training data, and the evaluation metric captures how frequently the true class is found within the top 10 classes ranked by a method. Results for each setting are shown in Figure 1a–d, organized by the cell line from which test signatures were drawn. The four settings represent increasing sparsity of drug (class) representation in the tuning dataset made available to SigMat; thus its accuracy is noted to deteriorate for higher numbered settings in some cases (e.g. cell lines MCF7 and VCAP), though in most cases its performance is consistent across settings. For instance, even in setting #4, where the tuning data includes only 5% of the drugs shared between HEPG2 and the test cell line, the average SigMat AvgSuccess@10 across six cell lines (MCF7 and VCAP excluded) is 0.301, compared to 0.331 in setting #1. As expected, there is some variation across settings because the size and (randomly selected) membership of testing data varies.
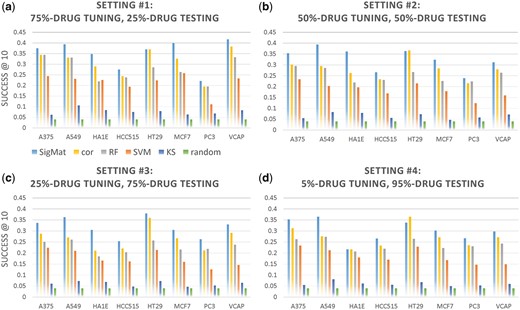
Comparison of SigMat to baseline methods across cell lines on different testing datasets. In each plot, models are trained on the HEPG2 cell line and tested on the 8 other cell lines (horizontal axis) independently. Each panel (a–d) shows the Success@10 for a different percentage of the shared drugs from the testing cell line corresponding to a different setting from Table 2. The SigMat model uses only the shared drugs from the testing cell line that are not in testing set for tuning data. The baseline methods (different colors) are as explained in Section 2.3. Legends are under Panel (a). cor: Spearman correlation. RF: random forest using 500 trees. SVM: support vector machines. KS: KS-based connectivity score with |z-score| > 2 providing up and down regulated genes lists, and random: drug label for test signatures chosen at random
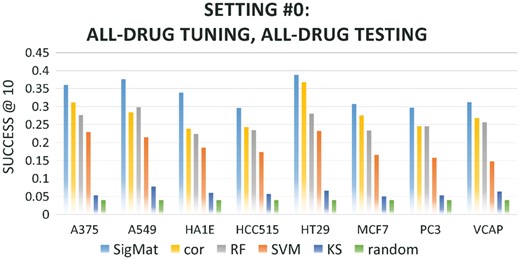
Importantly, we noted that SigMat consistently outperforms other methods on all cell lines except HT29, on which its accuracy is comparable to Spearman correlation. In particular, we would like to highlight Figure 1d, where SigMat only used about 10 tuning drugs to achieve a superior accuracy in the 244-way classification task. The Spearman correlation is clearly the second-best. We also evaluated SigMat under the case where the tuning and testing datasets both contained all 244 drugs from the training data (Setting #0, Table 2), while preserving clear separation of test signatures from tuning data (see Section 2.1). As shown in Figure 2, the trends are very similar to Figure 1, with SigMat outperforming all other methods on all testing cell lines, while on HT29 the difference between SigMat and the correlation method is modest. It must be noted that SigMat has access to more data (the tuning set) than other methods, and its ability to exploit such data, even when it is sparse, is a key feature of the method. We also note that in settings #1–4, the tuning data does not include any signature from the same class as a test signature.
According to Figure 1, methods for matching gene signatures to drug libraries have relative accuracy roughly described as: SigMat > Spearman correlation > RF > SVM > KS Connectivity score > random. The KS-based connectivity score used by CMAP only shows marginal improvement over a random model in our tests. We tried replacing the connectivity score by the KS statistic between the real-valued signatures (not truncated into up and down gene lists with thresholds, as in CMAP), and observed similar AvgSuccess@10 values (data not shown). We note that while the definition of the connectivity score for a pair of signatures used in our tests was borrowed from CMAP (Lamb., 2006), we defined the match score between a signature and a class (set of signatures) as the maximum connectivity score between the given signature and all signatures from that class (Section 2.3), although it is not clear that this is the scheme that the CMAP tool implements.
3.2 Examination of cell line-specific parameter tuning
Tuned values of the α scaling parameter
| Cell line | Setting #0 | #1 | #2 | #3 | #4 |
|---|---|---|---|---|---|
| A375 | 3.0 | 2.5 | 2.5 | 2.0 | 2.5 |
| A549 | 1.5 | 1.5 | 2.5 | 2.0 | 2.0 |
| HA1E | 2.0 | 1.0 | 2.0 | 2.0 | 3.0 |
| HCC515 | 2.5 | 3.0 | 3.0 | 3.0 | 3.0 |
| HT29 | 2.0 | 2.0 | 2.0 | 2.0 | 3.5 |
| MCF7 | 1.0 | 1.5 | 1.5 | 1.5 | 2.5 |
| PC3 | 3.0 | 2.5 | 4.0 | 2.5 | 4.0 |
| VCAP | 3.0 | 3.0 | 3.0 | 3.0 | 2.0 |
Note: Values tuned using percentage of the drug library dictated by each setting # (column) for each cell line (row).
The β parameter values tuned on each cell line are shown in Table 4. β is the weight of the KSVM-scaled score in the final SigMat score, relative to the max-corr score (step 4, Section 2.2). As shown in Table 4, the β values learned from tuning datasets containing 75%, 50% or 25% of all shared drugs are usually consistent with each other, although tuning datasets with all shared drugs (setting #0) or only 5% of shared drugs (setting #4) sometimes yield more extreme β values. Therefore, the β parameter appears to be stable over a wide range of x, where x% represents the relative size of the drug library in the tuning cell line compared to the training cell line. As long as the percentage x is not too small or close to perfect, β is unlikely to suffer from overfitting the tuning data.
Tuned values of the β interpolation parameter
| Cell Line | Setting #0 | #1 | #2 | #3 | #4 |
|---|---|---|---|---|---|
| A375 | 1.0 | 0.2 | 0.2 | 0.2 | 0.6 |
| A549 | 0.9 | 0.4 | 0.6 | 0.8 | 0.4 |
| HA1E | 1.0 | 0.8 | 1.0 | 0.6 | 0.0 |
| HCC515 | 0.5 | 0.7 | 0.7 | 0.7 | 0.1 |
| HT29 | 0.1 | 0.1 | 0.3 | 0.1 | 1.0 |
| MCF7 | 0.1 | 0.1 | 0.1 | 0.1 | 0.1 |
| PC3 | 0.8 | 0.5 | 0.3 | 0.6 | 0.5 |
| VCAP | 0.9 | 0.2 | 0.2 | 0.2 | 0.1 |
Note: Values tuned using percentage of the drug library dictated by each setting # (column) for each cell line (row).
3.3 Evaluation of drug signature matching within a cell line
Having established that SigMat improves signature matching accuracy across cell lines, across various test cell lines and under varying test configurations, we sought to assess its performance in the easier scenario where signatures are matched to their own cell lines. The performance of SigMat, tuned and tested on HEPG2 (while preserving separation of tuning and test examples), is shown in Table 5, along with comparison to other methods. (To train and test SigMat on HEPG2, we took a standard two-fold cross-validation approach with all signatures from HEPG2.) Note that SigMat automatically learns α = 1, which means it recognizes that the distribution of the kernel function values in testing is close to that in training and thus leaves the learned KSVM intact. The learned β is 0.5, giving balanced weights to the KSVM score and the correlation score in the final SigMat score. The relative performance of different methods follows the trends seen in Figure 1, specifically SigMat has the highest overall accuracy, over ∼1000 test signatures under cross-validation, and the Spearman correlation method is the second-best, followed by the Random Forest method.
Comparison of SigMat to baseline methods when tested on training cell line, HEPG2
| SigMat | cor | RF | SVM | KS | random |
|---|---|---|---|---|---|
| 0.665 | 0.627 | 0.587 | 0.183 | 0.129 | 0.04 |
| SigMat | cor | RF | SVM | KS | random |
|---|---|---|---|---|---|
| 0.665 | 0.627 | 0.587 | 0.183 | 0.129 | 0.04 |
Note: The average Success@10 is reported for each method (corresponding to abbreviations in Fig. 1).
3.4 SigMat variants
To illustrate the effects of the scaling parameter α and the interpolation parameter β in SigMat, we performed tests in settings #0-4 (Table 2) with variants of SigMat as described in Section 2.3. Results are shown in Figures 3 and 4. The performance of the Spearman correlation method is also included, to represent the best possible performance from other methods we tested. In most cases, SigMat performs better than its parameter-constrained variants as well as the correlation method.
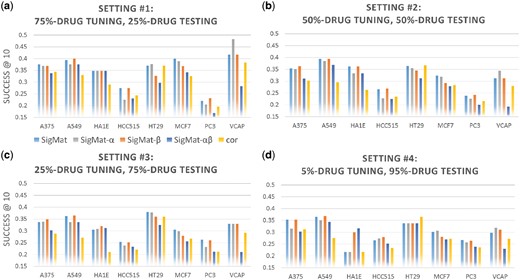
Comparison of SigMat variants and correlation method on non-overlapping tuning and testing sets. Similar to Figure 1 with the panels representing different evaluation settings, the horizontal axes the different testing cell lines, and the vertical axes the average Success@10. The methods (different colors) in this figure correspond to the variants of SigMat as described in Section 2.3, SigMat-α, SigMat-β and SigMat-αβ, as well as the full SigMat model and the Spearman correlation method (cor). Legends are under Panel (a)
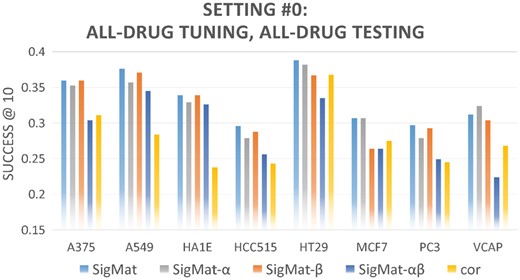
Comparison of SigMat variants and correlation method using all drugs for tuning and testing. Similar to Figure 3 except data from all shared drugs are used in tuning and testing each test cell line (Setting #0 in Table 2)
To quantitively compare the model reliability of the four variants of SigMat (i.e. SigMat, SigMat-α, SigMat-β and SigMat-αβ), we counted the frequency that each model is outperformed by at least one other variants on the same cell line with the same experimental setting. Since there are 5 experimental settings (Table 2) and 8 testing cell lines, each SigMat variant is compared against the others for 5 × 8 = 40 times. The results are shown in Table 6. Similarly, we counted the frequency that each SigMat variant is outperformed by correlation, and list the results in Table 7.
Other variants outperforming SigMat variants
| SigMat | SigMat-α | SigMat-β | SigMat-αβ |
|---|---|---|---|
| 17 | 30 | 22 | 36 |
| SigMat | SigMat-α | SigMat-β | SigMat-αβ |
|---|---|---|---|
| 17 | 30 | 22 | 36 |
Note: Number of times out of 40 combinations of testing cell line and experimental setting that a SigMat variant (column) has a lower Success@10 than any other SigMat variants.
Correlation outperforming SigMat variants
| SigMat | SigMat-α | SigMat-β | SigMat-αβ |
|---|---|---|---|
| 2 | 4 | 5 | 21 |
| SigMat | SigMat-α | SigMat-β | SigMat-αβ |
|---|---|---|---|
| 2 | 4 | 5 | 21 |
Note: Number of times out of 40 combinations of testing cell line and experimental setting that a SigMat variant (column) has a lower Success@10 than the correlation method.
Tables 6 and 7 and Figures 3 and 4 show that SigMat is a better choice than any of its parameter-constrained variants in our 40 experiments (combinations of 8 testing cell lines and 5 experimental settings). Therefore, tuning α and β as outlined in Section 2.2 does help improving the performance of SigMat.
3.5 Tuning data size
It can be observed from Figures 1 and 4 that reducing the number of drugs (classes) represented in the tuning dataset does not significantly hurt the performance of SigMat, which consistently outperforms other methods. On the other hand, when we allow SigMat to tune on only 5% (i.e. about ten) of all shared drugs, for five of the eight testing cell lines SigMat is outperformed by one of its parameter-constrained variants. Therefore, when signatures are matched to those from another cell line and the number of tuning drugs is very limited, the α and β parameters of SigMat may overfit to the tuning data and deviate from the optimum values for the query signatures. Nevertheless, in most cases SigMat gives better Success@10 than other methods even when the tuning data is very limited (Figure 1d).
3.6 Larger-scale validation
Now that we have established the superior performance of SigMat (trained on HEPG2 and tested on other cell lines) with Success@K where K = 10, we would like to extend our analysis to cases where training is performed on other cell lines and evaluation is based on other K values (1, 5 and 10).
In this section, we performed an additional set of 28 runs to compare SigMat against other methods under various training, testing and evaluation conditions. Note that those 28 runs are for this section only. For each run, we trained on one of the seven largest cell lines (i.e. A375, A549, HA1E, HT29, MCF7, PC3 and VCAP) and tested on one of the two smaller cell lines HCC515 and HEPG2. That gives 14 combinations of training and testing cell lines. To evaluate models trained on different cell lines at a consistent scale, on each training cell line we trained models with the top 500 drugs which have the greatest number of L1000 experiments on that cell line. The number of testing drugs for each combination of training and testing cell lines is shown in Supplementary Table S2. For each pair of training and testing cell lines, we ran two experiments, one allowing SigMat to tune on 50% of the testing drugs and testing on the rest 50%, while another restricting the tuning of SigMat to 5% of the testing drugs and testing on the remaining 95%. To summarize, each of the 28 runs in this section was composed of training 500-way classifiers on a training cell line, tuning SigMat with 5% or 50% of shared drugs on a testing cell line, and evaluating Success@K (K = 1, 5 or 10) on the rest 95% or 50% of shared drugs on the testing cell line.
The results of the 28 runs (Supplementary Table S3) show that the comparative performance of SigMat against other methods is in general consistent with what we observe in Section 3.1. SigMat outperforms other methods under most (≥75%) training, testing and evaluation conditions (Table 8).
SigMat outperforming other methods
| K | 1 | 5 | 10 |
|---|---|---|---|
| #Best | 21 | 23 | 22 |
| K | 1 | 5 | 10 |
|---|---|---|---|
| #Best | 21 | 23 | 22 |
Note: Number of times out of 28 combinations (Section 3.6) of training cell line, testing cell line and percentage of drugs used for tuning that SigMat has a higher Success@K than any other methods for three different K values.
4 Discussion
We have developed the SigMat tool to bring the power of discriminative classification models learned on rich datasets to the important problem of signature matching. In doing so, we had to address the difficult problem of learning models that can be applied to the cellular context of the user’s query signature, potentially a very different cellular context from the training instances of the model. We did this by learning two additional parameters, a global scaling parameter, α, and a model interpolation parameter, β, from a relatively small tuning dataset representing the cellular context of the user’s query. The global scaling parameter is designed to correct for discrepancies between similarity scores observed i) among signatures within the training set and ii) between signatures from different cell types. When the discriminative model learned in the training cellular context is not reliable for prediction in the query cellular context, the model interpolation parameter compensates by integrating the trained model’s prediction with that based on a simple nearest neighbor classifier. We showed that even with limited tuning datasets, the SigMat method outperforms other similarity-based and classification-based signature matching algorithms, especially in the cross-cell line evaluations.
In our initial application of the SigMat method, we trained our classification model on LINCS L1000 gene signatures from a single cell line, HEPG2, with 244 classes representing the response conditions from the administration of different drugs. This classifier typically had AvgSuccess@10 that was six to nine times better than random, which is remarkable considering there are nearly 250 classes, only ten training examples per class, and the predictions were on query signatures from cell lines other than HEPG2. At the same time, these evaluations are only on a small subset of the available LINCS L1000 drug response dataset. Additional investigation is required into how to train the SigMat model on multiple, rather than a single cell line. Furthermore, it is an open question to how well the model will scale to the potentially tens of thousands of small molecule treatment classes available in the L1000 dataset, especially with the great imbalance in the number of available training examples of each class and with the inherent structural and functional similarities between the corresponding molecules.
We then trained SigMat as 500-way classifiers on each of the seven largest cell lines in the L1000 dataset and tested it on each of two smaller ones (HCC515 and HEPG2) with 5% or 50% testing drugs allowed for tuning. We observed that SigMat gave better Success@K for various K values under more than 75% of the 28 combinations of training cell line, testing cell line and percentage of drugs for tuning. The success of SigMat in such large-scale cross-cell line testing gives us confidence in the generalizability of SigMat to other cell lines. We also note that there exist pairs of cell lines, for example VCAP + HCC515, on which SigMat is not the best performer under more than one tuning and evaluation settings. It remains an open question whether such exceptional cases appear randomly or with some pattern that can be explained with biomedical insights into those cell lines.
The evaluation of SigMat presented above was focused on an application of mapping a drug response condition to a user’s query gene signature. However, the method is flexible and could be applied to other application domains. SigMat could be applied to the shRNA and CRISPR based signatures in LINCS L1000, allowing users’ query gene signatures to be mapped to the best matching loss-of-function gene and thus providing a possible mechanistic insight into the query signature. SigMat could equally be applied to gene signature collections from cancer sample databases such as The Cancer Genome Atlas (Cline, et al., 2013) or the International Cancer Genomics Consortium (Zhang, et al., 2011), where if the biological conditions of interest were survival or treatment outcome, the signature matching task would have prognostic value. In the TCGA case, the gene expression signatures would not be the L1000 ‘level 4’ plate-normalized 978 z-scores, but the RNA-seq profiles from cancer samples. Additional evaluations would be required to quantify how well SigMat performs with these different types of expression measurements and at least 20x greater dimensionality of the model input features. In any of these potential applications and more, if a researcher is able to provide tuning data from their cellular context that matches the class labels of large training signature collections, then SigMat maximizes the benefit of applying a discriminative model to the task of signature matching.
Acknowledgements
We thank Mario Medvedovic and Jarek Meller for useful discussions regarding the LINCS L1000 data.
Funding
This research was supported by grant U54GM114838 awarded by NIGMS through funds provided by the trans-NIH Big Data to Knowledge (BD2K) initiative.
Conflict of Interest: none declared.
References

