


Abstract
High-throughput sequencing technologies, in particular RNA sequencing (RNA-seq), have become the basic practice for genomic studies in biomedical research. In addition to studying genes individually, for example, through differential expression analysis, investigating co-ordinated expression variations of genes may help reveal the underlying cellular mechanisms to derive better understanding and more effective prognosis and intervention strategies. Although there exists a variety of co-expression network based methods to analyze microarray data for this purpose, instead of blindly extending these methods for microarray data that may introduce unnecessary bias, it is crucial to develop methods well adapted to RNA-seq data to identify the functional modules of genes with similar expression patterns.
We have developed a fully Bayesian covariate-dependent negative binomial factor analysis (dNBFA) method—dNBFA—for RNA-seq count data, to capture coordinated gene expression changes, while considering effects from covariates reflecting different influencing factors. Unlike existing co-expression network based methods, our proposed model does not require multiple ad-hoc choices on data processing, transformation, as well as co-expression measures and can be directly applied to RNA-seq data. Furthermore, being capable of incorporating covariate information, the proposed method can tackle setups with complex confounding factors in different experiment designs. Finally, the natural model parameterization removes the need for a normalization preprocessing step, as commonly adopted to compensate for the effect of sequencing-depth variations. Efficient Bayesian inference of model parameters is derived by exploiting conditional conjugacy via novel data augmentation techniques. Experimental results on several real-world RNA-seq datasets on complex diseases suggest dNBFA as a powerful tool for discovering the gene modules with significant differential expression and meaningful biological insight.
dNBFA is implemented in R language and is available at https://github.com/siamakz/dNBFA.
1 Introduction
High-throughput sequencing technology has emerged as a powerful tool for life science research (Wang et al., 2009). In particular, RNA sequencing (RNA-seq), which measures the expression of each gene (transcript) or genomic feature of interest by counting the number of sequence reads mapped to them, has been widely adopted for genotype-phenotype association studies. A large body of statistical tools and frameworks have been developed for identifying the genes that are differentially expressed between different groups of samples, either based on their genotypes, phenotypic traits, or treatment conditions (Dadaneh et al., 2017; Law et al., 2014; Love et al., 2014; Robinson et al., 2010).
Living systems are complex and their behavior is coordinated by multiple components. Especially, when studying complex disease, phenotypic changes have been shown to be associated with co-ordinated regulation in functional modules of interacting genes (pathways or sub-networks) rather than statistically significant changes in individual genes (Nam and Kim, 2008). Therefore, a class of approaches has been developed to detect genes with similar expression patterns as potential functional modules. Weighted Gene Co-Expression Network Analysis (WGCNA; Langfelder and Horvath, 2008), a popular tool for gene co-expression network analysis, first constructs an adjacency matrix based on the pairwise co-expression measures, for example, based on the correlation between gene expressions across samples; then it assigns genes to different modules using the hierarchical clustering algorithm. DiffCoEx (Tesson et al., 2010) builds on WGCNA, and by computing the matrix of adjacency differences between different experiment conditions, aims at identifying differentially co-expressed genes. Several targeted methods also have been proposed for studying co-expression changes across conditions, relying on pre-defined gene modules (Cho et al., 2009; Choi et al., 2005; Choi and Kendziorski, 2009). For instance, Choi and Kendziorski (2009) focuses on the analysis of modules based on known gene annotations, such as gene ontology categories.
All of the aforementioned methods were proposed for data generated from microarray based experiments; and thus there remains a lack of tools for gene module detection specifically designed for RNA-seq count data. Furthermore, the existing methods often require prior knowledge from either manual annotations or other module identification methods. They need to be supplied with prepared lists of genes as candidate functional modules. For example, Lei et al. (2017) have proposed a network module-based generalized linear model for identifying differentially expressed pre-defined gene sets.
A suitable method for gene module identification based on RNA-seq data should explicitly model highly over-dispersed count data that are often skewed (Datta and Nettleton, 2014) to avoid potential bias introduced by inappropriate modeling. One of the most popular solutions to account for over-dispersion due to biological variability is using the negative binomial (NB) distribution, which possesses a quadratic variance-mean relationship. More importantly, the number of ad-hoc choices in modeling and data analytics should be minimized. Many existing methods, which often take two stages to first construct co-expression networks based on expression profile data and then identify co-expressed modules based on different clustering methods, may lead to uncertain results sensitive to different choices. Last but not least, when dealing with RNA-seq data, the variability of the sequencing depths across samples needs to be taken into account.
In this paper, we propose a novel covariate-dependent NB factorization model for identifying gene modules in RNA-seq experiments. The proposed method, directly applied to gene counts from RNA-seq, obviates the need for multiple ad-hoc steps as required in co-expression network analyses of WGCNA (Langfelder and Horvath, 2008) and DiffCoEx (Tesson et al., 2010). In addition, by employing a flexible regression model for the scale parameter of the gamma distribution in our fully Bayesian NB factor analysis model, dNBFA is capable of tackling RNA-seq experiments with complex confounding factors and quantifies the impact of these factors on the identified modules. Finally, similar to the mechanisms employed in Dadaneh et al. (2017), this new approach does not require an ad-hoc normalization step, as the model accounts for the sequencing-depth heterogeneity of different samples automatically.
For posterior inference of the model parameters of dNBFA, closed-form Gibbs sampling update equations are derived by exploiting novel data augmentation techniques. More specifically, we apply the augmentation technique of Zhou and Carin (2015) for the NB distribution, and the Polya-Gamma (PG) distributed auxiliary variable technique of Polson et al. (2013) for the closed-form inference of regression coefficients, removing the need for non-trivial Metropolis-Hastings correction steps (Chib and Greenberg, 1995). Experimental results on various RNA-seq datasets demonstrate the superior performance of dNBFA in finding more biologically significant modules, in comparison to the two-stage methods, such as WGCNA and DiffCoEx.
The remainder of this paper is organized as follows. In Section 2, we introduce the model and its Gibbs sampling inference for covariate-dependent NB factor analysis of RNA-seq data. In Section 3, we present our experimental results on multiple The Cancer Genome Atlas (TCGA) cancer datasets as well as a Autism study dataset, which demonstrate that not only the modules identified by dNBFA are more differentially expressed, but also the incorporation of confounding factors in dNBFA may increase the chance for relevant biological discoveries tailored to the designed experiments. We conclude the paper in Section 4.
2 Materials and methods
2.1 NB factor analysis
From biological perspectives, K factors can correspond to the underlying biological processes (BPs) or functional modules related to genotypic, phenotypic, or treatment condition changes. The corresponding sub-counts nvjk can be viewed as the result of the contribution of underlying BP k to the expression of gene v in sample j. The probability parameter pj, which only depends on the sample index, can be considered as a parameter reflecting the potential heterogeneity of counts, due to the variation of the sequencing depths across different samples.
More precisely, using Equation (2) and the formula for the mean of the NB distribution, the expected expression of gene v in sample j can be expressed as . The term can be interpreted as the effect of the sequencing-depth heterogeneity of sample j on the corresponding gene expression in this sample. This approach removes the need for an ad-hoc normalization step, as the model accounts for the sequencing-depth heterogeneity of different samples automatically, similar to the mechanisms employed in Dadaneh et al. (2017). The remaining term in this expectation, , can represent the true abundance of gene v in sample j. Specifically, it comprises of contributions from all latent factors, where each contribution is encoded as the product of the gene association with latent factors as modules and the contribution of those modules to sample j.
NBFA proceeds by placing the Dirichlet and gamma prior distributions on and θkj, respectively, and appropriate prior distributions on the other model parameters. A Gibbs sampling algorithm that exploits novel data augmentation techniques has been derived for inferring the model parameters (Zhou, 2017).
2.2 Covariate-dependent NBFA
In real-world RNA-seq experiments, it is often desirable to identify the functional modules corresponding to critical BPs specific to the behavior of interest by the design of experiments. Often, the presence of potential confounding factors also requires that the developed factor analysis method based on RNA-seq data can take them into account (when the corresponding conditions are given) to derive correct functional module results. The aforementioned NBFA model neglects such information about sequencing samples from designed experiments. In order to empower the NBFA model in tackling the setups with complex experiment design, we extend its framework to make it capable of incorporating the external covariate information (e.g. phenotypes, treatments and other confounding factors) into the factor analysis model to derive the new covariate-dependent NBFA (dNBFA) model.
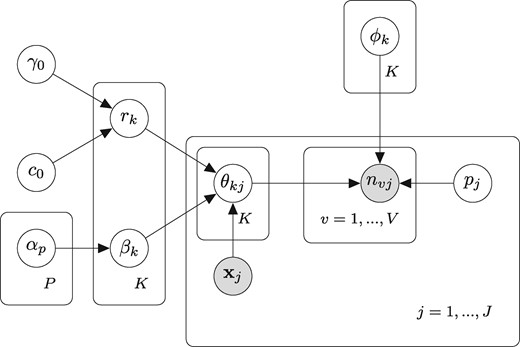
Graphical representation of the dNBFA model
Employing the law of total expectation, and removing the sequencing depth effect by the related terms containing pj, we have . This new layer of model, splits the effect of the latent factor k on sample j into two parts; rk, which can be considered as representing the baseline expression of the factor k across all samples, and the exponential term , which adjusts the effect of the latent factor on the sample according to its traits. We note that including an intercept in may weaken the identifiably of rk, as in the expectation of the count nvjk a product term depending only on latent factor k appears. Thus in all subsequent experiments a separate intercept term is not used when considering covariate effects. The parameters of the dNBFA model with their interpretations in the context of RNA-seq experiments are presented in Table 1.
Parameters of covariate-dNBFA and their interpretations in the context of RNA-seq data
| Parameter | Constraint | Interpretation |
|---|---|---|
| rk | Module baseline expression | |
| pj | Sequencing depth | |
| Gene-module association | ||
| θkj | Popularity of factor k in sample j | |
| βkp | Impact of covariate p on expression of factor k |
| Parameter | Constraint | Interpretation |
|---|---|---|
| rk | Module baseline expression | |
| pj | Sequencing depth | |
| Gene-module association | ||
| θkj | Popularity of factor k in sample j | |
| βkp | Impact of covariate p on expression of factor k |
Note: The inputs of dNBFA are gene counts nvj and vector of covariates .
A challenge in NB factorization is how to determine the number of latent factors K. To address this issue, one can employ a reasonably large K and then according to the inference step for rk [refer to Equation (12) below], the baseline expression inferred for non-important latent factors vanishes as the number of assigned gene sub-counts to it decreases.
Throughout the experiments in this paper, we set the hyperparameters as and . In the following section, we provide an efficient inference algorithm that adopts novel data augmentation techniques tailored to our dNBFA model.
2.3 Inference via Gibbs sampling
By utilizing a few data augmentation techniques (Polson et al., 2013; Zhou et al., 2012; Zhou and Carin, 2015), we derive an efficient Gibbs sampling algorithm for inferring the model parameters in Equation (6), as described below. Algorithm 1 summarizes all the steps in the Gibbs sampling algorithm.
Sample . For the regression coefficients modeling potential covariate effects, the lack of conditional conjugacy precludes immediate closed-form inference. Therefore, we adopt another data augmentation technique, specifically designed for dNBFA, to infer the regression coefficients , relying on the PG data augmentation of (Polson et al., 2013; Zhou et al., 2012). Denote ωkj as a random variable drawn from the PG distribution as
The Gibbs sampling steps in Equations (7) to (22) are summarized in Algorithm 1.
dNBFA model inference
Inputs: RNA-seq counts, design matrix of covariate effects, N
Outputs: gene module membership matrix
Initialize model parameters
# Do Gibbs sampling:
foriter = 1 to Ndo
Sample using the CRT distribution [Equation (7)]
Update and θkj using the gamma-Poisson conjugacy [Equation (9)]
Sample using the CRT distribution [Equation (11)]
Update rk and γ0 using the gamma-Poisson conjugacy [Equation (12),(14)]
Sample auxiliary variables ωkj, using the PG distribution [Equation (16)]
Update regression coefficients [Equation (17)]
Update η using auxiliary beta distributed random variables [Equation (21)]
Update αp, pj and c0 [Equation (22)]
end for
3 Results
We evaluate our dNBFA for covariate-dependent factor analysis based on two sets of real-world RNA-seq data studying complex diseases, and compare its performance with those of WGCNA (Langfelder and Horvath, 2008) and DiffCoEx (Tesson et al., 2010), two commonly adopted two-stage co-expression network based methods.
The first set of RNA-seq data was extracted from TCGA [Cancer Genome Atlas (TCGA) Research Network and others, 2008], including three datasets on breast invasive carcinoma (BRCA), lung squamous cell carcinoma (LUSC) and kidney renal clear cell carcinoma (KIRC). These data were retrieved using the TCGA2STAT R package (Wan et al., 2015). Using TCGA data we expect to illustrate the higher differential expression significance of gene modules identified by dNBFA with respect to the disease factor compared to the results from WGCNA and DiffCoEx.
The second experiment was performed on a RNA-seq dataset of the Autism study in Gupta et al. (2014), where samples were obtained from three brain regions: the cerebral cortex Brodmann area (BA) 19, anterior prefrontal cortex (BA10) and a part of the frontal cortex (BA44). For this dataset, we demonstrate how incorporating covariate information may enhance the chance of achieving meaningful biological discoveries.
For both TCGA and Autism experiments, dNBFA was run using 3000 MCMC iterations, where after the first 1000 burn-in iterations, the posterior samples with the highest likelihood were collected as the point estimates of model parameters. The total number of latent factors for both TCGA and Autism were initially set as K = 250, and after the parameter inference, only the top 100 factors with non-negligible baseline expressions were kept for further analyses. In addition, to determine module membership, for each latent factor k, only the top 20 genes with highest were considered as members of module k. It should be noted that when an evaluation metric that can take advantage of the whole association matrix exists, this ad-hoc step of using a cut-off for the gene-association parameter can be avoided.
For WGCNA, the adjacency matrix was built by first computing the pairwise Pearson correlation coefficients between gene expression profiles and then applying the soft threshold for TCGA and Autism data, respectively. The gene modules were identified by applying a hierarchical clustering algorithm to the derived topological overlap dissimilarity matrix (Ravasz et al., 2002). A similar procedure was followed for DiffCoEx, except that the topological overlap matrix was built upon the matrix of adjacency difference (Tesson et al., 2010). Our experiments show that the discovered modules by WGCNA and DiffCoEx comprise of large lists of genes, where no further modeling capability is provided to narrow down the gene sets for more consequent exploratory analysis.
3.1 TCGA data
For all TCGA datasets, we have filtered out the genes whose total read counts across all samples are less than 50, resulting in roughly 20 000 genes in each dataset. The total numbers of samples for BRCA, LUSC and KIRC datasets are, respectively, 40, 34 and 40, where in each case the number of primary tumor and normal samples are equal.
Based on the resulting RNA-seq count data, dNBFA, WGCNA and DiffCoEx have been applied to derive functional gene modules using the aforementioned settings. To assess the significance of differential expression of identified modules with respect to the disease status of samples, we follow the framework of Langfelder and Horvath (2008). More precisely, for each detected module, first the eigengene (Langfelder and Horvath, 2008) is computed via the first principal component of the expression matrix of the corresponding derived module. The module eigengene is used to summarize and represent the expression profiles of the module genes (Horvath and Dong, 2008). Then, the association of the eigengene expression with the disease status is evaluated and finally the significance of the association is assessed based on the student’s t-test.
We calculate the P-values for gene modules identified by dNBFA, WGCNA and DiffCoEx, applied to the three TCGA datasets. The sorted P-values [based on -log(P-value)] are illustrated in Figure 2. The eigengenes of the modules detected by dNBFA are remarkably more differentially expressed than those detected by WGCNA and DiffCoEx in all three TCGA datasets. To further investigate the results, we present the per-sample eigengenes of the module ranked 10th for differential expression, which was identified by dNBFA, WGCNA and DiffCoEx for the three TCGA datasets in Figure 3. The per-sample eigengenes of dNBFA modules are more consistently differentially expressed with respect to the disease status covariate for all three TCGA datasets, while per-sample eigengenes of WGCNA and DiffCoEx demonstrate higher variations within each group of samples with the same disease status. To ensure that the gene modules detected by dNBFA are not redundant, we also have examined the modules for significant overlap. Except a minor overlap between two modules, the rest of the modules identified by dNBFA are completely disjoint. These results suggest that dNBFA can be a powerful untargeted module identification tool, without pre-defined gene lists, for genomic experiments that study coordinated gene expression pattern changes across multiple groups.
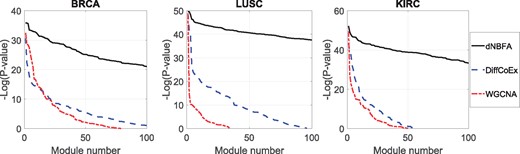
Significance of differential expression for eigengenes associated with gene modules identified by dNBFA, WGCNA and DiffCoEx applied to three TCGA datasets. The panels show the sorted negative logarithm of P-values of the derived modules. P-values are calculated using the student’s t-test on association between module eigengene expression and the samples’ condition factor (cancerous versus normal)
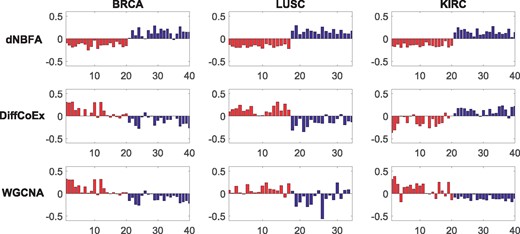
Per-sample eigengene expression of modules with the 10th lowest P-values discovered by dNBFA, WGCNA and DiffCoEx, across cancerous and normal samples for the three TCGA datasets. In each figure the y-axis is the eigengene expression, and the x-axis is the sample number. Red and blue bars correspond to the normal and cancer groups, respectively. Figures in top, middle and bottom rows are the results of dNBFA, DiffCoEx and WGCNA, respectively. Figures in left, middle and right columns correspond to BRCA, LUSC and KIRC datasets, respectively
To further verify the advantages of dNBFA that it avoids overfitting when the initial number of modules K is set high, we present in Figure 4 the learned rk’s, representing the baseline expression associated with the derived modules, for three TCGA datasets. Only the top 40 rk’s are included in this figure. For all datasets, only a fraction of modules have significantly large baseline expression; and thus in practice, a threshold can be used to extract the modules that contribute significantly to coordinated gene expression changes specific to the experiment design factors of interest.
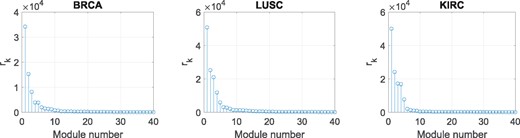
Inferred baseline expression rk for modules detected by dNBFA in the three TCGA datasets. Only the top 40 rk’s are included in this figure
For the analysis of the real-world TCGA dataset on a single cluster node with Intel Xeon 2.5 GHz E5–2670 v2 processor, on average it took around 8 h for both the dNBFA and NBFA methods with 3000 MCMC iterations and about 1 h for both WGCNA and DiffCoEx.
3.2 Autism data
Autism is a neuro-developmental disorder, in which the affected individuals are characterized by impairments in social and communicative developments (Gupta et al., 2014). To apply dNBFA to the RNA-seq dataset of the Autism study in Gupta et al. (2014), we first discard the samples with low sequencing depths, resulting in a dataset with 36 samples from the control group and 23 Autism samples. The following analyses are performed using a subset of 12 010 genes that have a count of at least three per sample across 90% of the samples. In this experiment, site of sample collection, age, sex and brain region are available as the covariate information in factor analysis. To examine how this information can alter the NB factor analysis results, in the first set of experiments we use the covariates to apply dNBFA; and in the second set of experiments, we neglect all covariate information and run the naive NBFA on the dataset.
We perform gene set enrichment analysis on the discovered modules by applying dNBFA and NBFA, respectively, to the Autism data, covering molecular function (MF), cellular component (CC) and BP ontology domains. We calculate the significance of GO terms using Fisher’s exact test and depict the sorted negative logarithm of P-values for both dNBFA and NBFA in Figure 5. The modules detected by dNBFA have, in general, lower P-values than those identified by NBFA without covariates, suggesting that incorporating covariate information may increase the chance of discovering biologically meaningful modules.
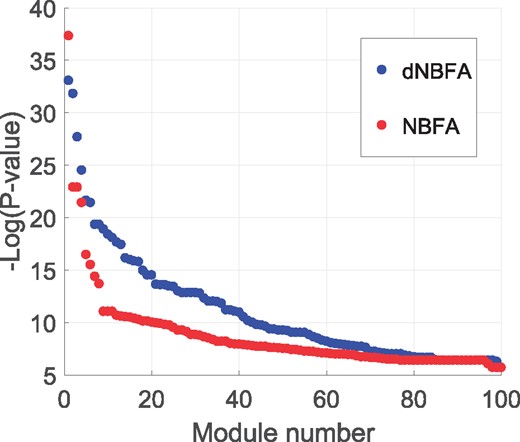
Negative logarithm of P-values for GO term enrichment analysis of modules detected by dNBFA and NBFA, applied to Autism RNA-seq data. For dNBFA, site of sample collection, age, sex and brain region are used as covariate information, while no such information is incorporated for NBFA
To investigate the gene ontology results more thoroughly, the top 10 GO terms with the lowest P-values are presented in Tables 2 and 3 for dNBFA and NBFA methods, respectively. In these tables, each row is the most significant GO term corresponding to one module identified by dNBFA or NBFA. The top modules discovered by dNBFA provide more explicit connections to neural system. Especially, the top module identified by dNBFA, which was not detected by NBFA, is associated with GO term ‘type I interferon signaling pathway’, where type I Interferon responses in the brain are classically attributed to viral infections (Delhaye et al., 2006), which in turn are connected to Autism (Patterson, 2011). Another important module detected only by dNBFA, the third module in Table 2, is related to adaptive immune response which is closely correlated to the development of Autism spectrum disorders (Ashwood et al., 2006; Heuer et al., 2008). More precisely, this module includes the human leukocyte antigen (HLA) genes that play an instrumental role in many innate and adaptive immune responses (Torres et al., 2012). Many reports have provided the evidence on associations between Autism and HLA genes/haplotypes, suggesting an underlying dysregulation of the immune system mediated by HLA genes (Torres et al., 2002; Torres et al., 2012; Warren et al., 1996). A third important module identified only by dNBFA is associated with GO term ‘neuron differentiation (GO: 0030182, P-value = 1.4 × 10–08). Specifically, this module includes calmodulin 1 (CALM1) gene. Significant defects in CALM1 interaction modules, which regulate voltage-independent calcium-activated action potentials at the neuronal synapse, are reported in autistic patients (Hadley et al., 2014).
Top enriched GO terms identified by dNBFA algorithm applied to Autism RNA-seq data
| GO-ID | Aspect | Term | P-value |
|---|---|---|---|
| GO: 0060337 | BP | Type I interferon signaling pathway | 4.377782e–15 |
| GO: 0043209 | CC | Myelin sheath | 1.522628e–14 |
| GO: 0002460 | BP | aSee blow | 9.487407e–13 |
| GO: 0061024 | BP | Membrane organization | 2.250911e–11 |
| GO: 0044456 | CC | Synapse part | 4.010908e–10 |
| GO: 0005575 | CC | Cellular component | 4.950009e–10 |
| GO: 0033693 | BP | Neurofilament bundle assembly | 3.982179e–09 |
| GO: 0031720 | MF | Haptoglobin binding | 3.982179e–09 |
| GO: 0000982 | MF | bSee blow | 6.267732e–09 |
| GO: 0001504 | BP | Neurotransmitter uptake | 1.015843e–08 |
Adaptive immune response based on somatic recombination of immune receptors built from immunoglobulin superfamily domains.
Transcription factor activity, RNA polymerase II core promoter proximal region sequence-specific binding.
Top enriched GO terms identified by NBFA algorithm applied to Autism RNA-seq data
| GO-ID | Aspect | Term | P-value |
|---|---|---|---|
| GO: 0022625 | CC | Cytosolic large ribosomal subunit | 6.175728e–17 |
| GO: 0097458 | CC | Neuron part | 1.134089e–10 |
| GO: 0006735 | BP | NADH regeneration | 1.153145e–10 |
| GO: 0005575 | CC | Cellular component | 4.950009e–10 |
| GO: 0051050 | BP | Positive regulation of transport | 7.042487e–08 |
| GO: 0007399 | BP | Nervous system development | 1.841155e–07 |
| GO: 0065010 | CC | Extracellular membrane-bounded organelle | 5.614232e–07 |
| GO: 0017111 | MF | Nucleoside-triphosphatase activity | 1.144582e–06 |
| GO: 0048630 | BP | Skeletal muscle tissue growth | 1.586369e–05 |
| GO: 0071208 | MF | Histone pre-mRNA DCP binding | 1.586369e–05 |
Other GO terms directly related to the nervous system associated with the top modules discovered by dNBFA include ‘Myelin sheath’, ‘synapse part’, ‘neurofilament bundle assembl’ and ‘neurotransmitter uptake’. Specifically, the decreased thickness of myelin in the orbitofrontal cortex region is closely related to Autism disorders (Zikopoulos and Barbas, 2010). In addition, the module detected by dNBFA corresponding to GO term ‘synapse part’ has the highest association with the gene SNAP-25, whose reduced expression level is responsible for the cognitive deficits in children affected by Autism spectrum disorders (Braida et al., 2015).
Examining the detected modules by both dNBFA and NBFA, we observe that multiple GO terms relevant to Autism, such as ‘myelin sheath’, ‘NADH regeneration’ and ‘nervous system development’, are revealed by both algorithms. NADH is mainly involved in catabolic reactions (energy metabolism and mitochondrial function), whose decreased level has been reported in some children with Autism (Adams et al., 2011). On the other hand, defects in Autism appear closely tied to late developmental steps of nervous system that depend on synaptic activity and activity-dependent transcriptional changes (Walsh et al., 2008). Hence the relevance of the discovered GO terms by both dNBFA and NBFA to Autism is confirmed.
Finally, by examining the trace plots of model parameters, such as c0 and rk, we find that the Markov chains for the dNBFA method converge fast and mix well, supporting the practice of performing downstream analysis with 3000 MCMC iterations.
In summary, both NBFA and dNBFA methods emerge as useful module identification tools in RNA-seq data analysis, as in comparison to other available methods for gene module detection, they require minimum user adjustments. Specifically, the experimental results on the Autism dataset show that the incorporation of covariate information by dNBFA may lead to the discovery of more significant Autism-relevant modules, which otherwise would be missed by NBFA.
4 Conclusions
We propose a novel Bayesian covariate-dependent negative binomial factor analysis (dNBFA) method for analyzing RNA-seq count data. Our experimental results on real-world RNA-seq data demonstrate that dNBFA is capable of handling complex experiments involving multiple factors. What’s more, dNBFA does not require any ad-hoc data normalization, data preprocessing, or co-expression network construction steps. By taking advantage of novel data augmentation techniques, dNBFA possesses efficient closed-form Gibbs sampling update equations. Experimental results on multiple RNA-seq data studying complex diseases, both cancer and Autism, demonstrate that our dNBFA can be directly applied to RNA-seq data to derive meaningful functional modules and it has potential advantages over existing two-stage co-expression network based methods.
Acknowledgement
The authors thank Texas A&M High Performance Research Computing and Texas Advanced Computing Center for providing computational resources to perform experiments in this paper.
Funding
This work was supported in part by the NSF Award CCF-1553281, the USDA NIFA Award 06-505570-01006 and the TEES-AgriLife Center for Bioinformatics and Genomic Systems Engineering (CBGSE).
Conflict of Interest: none declared.
References

