


Abstract
The length of the untranslated region ( UTR) of an mRNA is essential for many biological activities such as mRNA stability, sub-cellular localization, protein translation, protein binding and translation efficiency. Moreover, correlation between diseases and the shortening (or lengthening) of UTRs has been reported in the literature. This length is largely determined by the polyadenylation cleavage site in the mRNA. As alternative polyadenylation (APA) sites are common in mammalian genes, several tools have been published recently for detecting APA sites from RNA-Seq data or performing shortening/lengthening analysis. These tools consider either up to only two APA sites in a gene or only APA sites that occur in the last exon of a gene, although a gene may generally have more than two APA sites and an APA site may sometimes occur before the last exon. Furthermore, the tools are unable to integrate the analysis of shortening/lengthening events with APA site detection.
We propose a new tool, called TAPAS, for detecting novel APA sites from RNA-Seq data. It can deal with more than two APA sites in a gene as well as APA sites that occur before the last exon. The tool is based on an existing method for finding change points in time series data, but some filtration techniques are also adopted to remove change points that are likely false APA sites. It is then extended to identify APA sites that are expressed differently between two biological samples and genes that contain UTRs with shortening/lengthening events. Our extensive experiments on simulated and real RNA-Seq data demonstrate that TAPAS outperforms the existing tools for APA site detection or shortening/lengthening analysis significantly.
Supplementary data are available at Bioinformatics online.
1 Introduction
According to the central dogma of molecular biology, the transcription process in eukaryotes synthesizes a pre-mRNA from the genomic sequence of a gene (Leavitt and Nirenberg, 2010). The pre-mRNA is then converted to a mature mRNA by the post-transcriptional process. Finally, this mature mRNA is translated into the corresponding protein. The post-transcriptional process includes three major steps: the addition of a cap, addition of a polyadenylation (polyA) tail and splicing. In particular, a polyA tail is added at the end of a pre-mRNA with the help of the polyadenylation process. More precisely, the polyadenylation process consists of two steps (Wahle and Kühn, 1997): cleavage near the end of a pre-mRNA and the addition of a polyA tail at the cleavage site. Certain cis-acting elements and trans-acting factors have been found in the literature that influence the choice of a particular polyA cleavage site (Barrett et al., 2012; Pichon et al., 2012). In particular, the end sequence of a pre-mRNA usually contains a AAUAAA hexamer (or some close variant). This hexamer is called the polyadenylation signal (PAS) and it usually appears 10–30 bps upstream of the cleavage site (Tian, 2005). The PAS serves as a binding site for the cleavage and polyadenylation specificity factor (CPSF). U-rich or U/G-rich elements located 20–40 bps downstream of the cleavage site are also involved in polyadenylation (Tian, 2005). These U-rich or U/G-rich elements serve as the binding sites for the cleavage stimulation factor (CstF). In addition, some auxiliary elements upstream of the PAS and downstream of the cleavage site may enhance the polyadenylation process (Tian, 2005). Due to the interactions between these cis elements and polyadenylation factors, alternative cleavage sites can be formed for a pre-mRNA, resulting in more than one mRNA transcript from a single pre-mRNA containing untranslated regions ( UTRs) of different lengths. Note that a UTR is a suffix of an mRNA sandwiched between the stop codon and polyadenylation cleavage site of the mRNA. The length of a UTR as well as some sequence elements in the UTR such as AU-rich elements and GU-rich elements may have impact on mRNA stability, mRNA localization, protein translation, protein binding and translation efficiency (Barrett et al., 2012). Moreover, the secondary structure of a UTR is also important for its translation efficiency and disruption of expression (Barrett et al., 2012). Alternative polyadenylation (cleavage) is very common in mammalian genes (Tian, 2005). According to the study in (Christine, 2016), more than half of human genes have alternative polyadenylation in their post-transcriptional process. Therefore, the analysis of alternative (or all) polyadenylation sites (APA sites) would be of great importance for the study of mammalian genes.
The analysis of expressed sequence tags (ESTs) has provided genome-wide annotations of UTRs. Not only does this analysis show that mammalian genes have multiple UTRs (Tian, 2005), but also it reveals that neuronal cell mRNAs have longer UTRs than liver cell mRNAs (Sood et al., 2006). However, an EST based approach is not able to estimate the relative abundance of each UTR in the resultant mRNAs (Kim et al., 2015b). Using 3P-Seq data, the UTRs of genes in yeast, worm, fly, zebrafish, mouse and human genomes have been annotated in (Andrew et al., 2010; Derti et al., 2012; Hoque et al., 2013; Jan et al., 2011; Mangone et al., 2010; Nam et al., 2014; Shepard et al., 2011; Ulitsky et al., 2012). Unlike EST based approaches, these methods based on 3P-Seq precisely detect the usage of different UTRs in mRNAs. On the other hand, they require complex biochemical steps and large amounts of RNA for their analyses (Kim et al., 2015b).
The advancement of RNA-Seq technology has provided new avenues for the study of transcription including the polyadenylation process. A typical RNA-Seq data analysis process begins with mapping RNA-Seq reads to some reference genome using tools like TopHat2 (Kim et al., 2013), HISAT (Kim et al., 2015a). Once the reads are mapped, mRNA transcripts (or isoforms) are assembled by using tools like Cufflinks (Trapnell et al., 2010), IsoLasso (Li et al., 2011), StringTie (Pertea et al., 2015) or TransComb (Liu et al., 2016), and their abundance levels are quantified by using tools like Cufflinks (Trapnell et al., 2010), RSEM (Li and Dewey, 2011), CEM (Li and Jiang, 2012), eXpress (Roberts and Pachter, 2013), Kallisto (Bray et al., 2016), etc. Moreover, differential expression between samples can be analyzed by using tools such as DESeq (Anders and Huber, 2010), Cuffdiff (Trapnell et al., 2013) or DEXSeq (Anders et al., 2012).
Recently, several methods for discovering UTRs from RNA-Seq data have been introduced in the literature. The tool introduced in (Lu and Bushel, 2013) studies the dynamic expression of UTRs using a Poisson hidden Markov model. Due to the design of the model, the tool is only able to identify up to two alternative polyadenylation sites for a given gene. The web server 3USS (Pera et al., 2015) takes a pair of annotated genome and transcriptome and outputs alternative UTRs. It only reports the polyadenylation sites given in the transcriptome and thus would be unable to provide any novel APA sites. Roar (Grassi et al., 2016) takes annotated APA sites from public databases to identify genes undergoing regulation of UTR length. Similar to 3USS, Roar is unable to discover novel APA sites. GETUTR (Kim et al., 2015b) is another RNA-Seq based tool to estimate the UTR landscape. The method takes mapped reads and a reference genome as the input, and finds APA sites by using techniques to smooth read coverage including isotonic (or monotone) regression (Kruskal, 1964). A drawback of the method is that these smoothing techniques may result in many false APA sites. On the other hand, although introns may occur in UTRs (Barrett et al., 2012; Bicknell et al., 2012), GETUTR does not consider intronic regions in its analysis and thus often misses UTRs that contain introns. IsoSCM (Shenker et al., 2014) identifies alternative UTRs based on a multiple change-point inference model. It first uses the (statistical) model to infer change points in a gene that exhibit sharp increase or decrease in read coverage. Then it employs some additional mathematical constraint to filter change points that are likely to be false APA sites. Similar to GETUTR, the method does not consider introns inside a UTR. DaPars (Xia et al., 2014) and ChangePoint (Wang et al., 2014) are tools for comparing APA sites in two biological samples and detecting shortening/lengthening events. Both of these tools consider only two cleavage sites in their shortening/lengthening analysis, although a gene may have more than two APA sites.
In this paper, we introduce a new tool, called TAPAS (i.e. Tool for Alternative Polyadenylation site AnalysiS), for detecting novel APA sites from RNA-Seq data. It can deal with more than two APA sites in a gene as well as UTRs that contain intronic regions. The tool is based on the Pruned Exact Linear Time (PELT) method for finding change points in time series data (Killick et al., 2012), but some filtration techniques that take into account special properties of RNA-Seq data and the exonic structures of the UTRs of the same gene are also employed to remove change points that are likely false APA sites. The tool is then extended to identify APA sites that are expressed differently between two biological samples with multiple replicates by using an elaborate algorithm to align APA sites from each replicate and standard statistical approaches for differential expression analysis such as the one in (Anders and Huber, 2010). The differential expression analysis is further extended to identify genes that have UTRs with shortening/lengthening events.
To assess the performance of TAPAS, we have conducted extensive experiments on both simulated and real data and compared TAPAS with the above mentioned tools IsoSCM, GETUTR, DaPars and ChangePoint for APA site or differential expression analysis. Moreover, since a complete transcriptome provides full information about APA sites, we also include the most popular tool for transcriptome assembly, Cufflinks and its corresponding tool for transcript-based differential expression analysis, Cuffdiff, in the comparison. As none of these existing tools are able to perform all three types of APA site and differential expression analysis that TAPAS can do, we organize the comparison as three groups: (i) detection of APA sites (among TAPAS, IsoSCM, GETUTR and Cufflinks), (ii) detection of genes with differentially expressed APA sites (among TAPAS, Cuffdiff, DESeq and DEXSeq) and (iii) detection of genes with shortening/lengthening events (between TAPAS, DaPars and ChangePoint). We exclude 3USS, Roar and the tool in (Lu and Bushel, 2013) from the comparison because they are either unable to discover novel APA sites or seriously restricted. In the simulation experiments, the tools are compared in terms of sensitivity and precision. Based on these two performance measures, TAPAS outperforms IsoSCM, GETUTR and Cufflinks significantly in the detection of APA sites. When -Seq (or polyA-Seq) and PAS-Seq data are considered as the ground truth in real data experiments, TAPAS is able to deliver more true APA sites than the other tools with a similar number of predicted APA sites. For the detection of genes with differentially expressed APA sites, TAPAS achieves a higher sensitivity than Cuffdiff and DEXSeq even though they are provided with an annotated transcriptome. Although its sensitivity is initially worse than that of DESeq, the gap decreases rapidly with the increase of sequencing depth. While its precision is also higher than that of Cuffdiff without the transcriptome annotation and DEXSeq, it is slightly lower than that of Cuffdiff with the transcriptome annotation and lower than that of DESeq (but the gaps shrink as well with the increase of sequencing depth). In the shortening/lengthening event analysis, TAPAS outperforms significantly DaPars and ChangePoint on simulated data. On a real dataset and once again using -Seq data as the ground truth, TAPAS identifies more genes with real shortening/lengthening events than the other two, when all the tools are tuned to output similar number of events. We also analyze the time and memory efficiency of TAPAS and demonstrate that while TAPAS requires a significant amount of memory, its running time is comparable to that of the other tools.
The rest of the paper is organized as follows. The method of TAPAS is discussed in Section 2. The experimental results and comparison with the other tools are given in Section 3. A brief evaluation of the running time and memory efficiency of the tools is given in Section 4.
2 Materials and methods
TAPAS takes a set of mapped RNA-Seq reads from standard polyA+ libraries along with the read coverage information and an annotated genome as the input to detect alternative polyadenylation sites (i.e. APA sites). It first extracts the UTRs of every gene in the genome annotation. The overlapping UTRs in a gene are merged into a UTR frame (if a gene has only one UTR, then that UTR is considered as the UTR frame of the gene). Then it estimate the the read coverage of the UTR frames. The read coverage of each of these frames is given as the input to the PELT algorithm to infer change points in a gene where the read coverage increases or decreases sharply. Since not all such change points are true APA sites, TAPAS filters them to produce a list of predicted APA sites. The abundance of an APA site (i.e. the total abundance of all transcripts that end at the APA site) can be estimated by using the quantification method in (Trapnell et al., 2010). When two biological samples with multiple replicates are given, TAPAS can be applied to each replicate to obtain its set of APA sites and the associated abundance. The sets of APA sites from all replicates are then aligned using an elaborate algorithm and some standard statistical steps like those used in DESeq (Anders and Huber, 2010) are applied to identify APA sites that are differentially expressed in the two samples. This analysis can be easily extended to infer genes that have shortened/lengthened UTRs between the two samples. The flowchart shown in Supplementary Figure S1 illustrates the main steps of TAPAS. Each of these steps is explained in detail below.
2.1 Detecting alternative polyadenylation sites
As mentioned above, TAPAS starts its APA site analysis by extracting UTR frames of each gene from an annotated genome (or transcriptome, if it is available). Such an annotation typically provides some known UTRs of each gene. Some of the UTRs may overlap. In order to avoid the potential inference between overlapping UTRs in our subsequent change point analysis, we merge multiple overlapping UTRs of a gene into a frame. For convenience, if a gene has only one UTR, the UTR is also considered as the UTR frame of the gene. Next, it takes a set of standard RNA-Seq reads mapped to the reference genome by TopHat2 (Kim et al., 2013) along with read coverage information and extracts the read coverage for each base position of a UTR frame. The prune exact linear time (PELT) algorithm (Killick et al., 2012) based on dynamic programming is applied to infer APA sites in each UTR frame as follows.
The change points found by the PELT algorithm indicate positions in a UTR frame where the read coverage increases or decreases sharply. Not all of them are necessarily true APA sites. In particular, the read coverage typically decreases rather than increases at an APA site, although it may increase after an intron contained in a UTR frame. Therefore, we need filter the change points output by the PELT algorithm to reduce false positives.
It has been observed in our preliminary experiments that the PELT algorithm often outputs an extra change point before a true APA site when the read coverage increases or decreases gradually (please see Supplementary Fig. S2a for more details). To remove the spurious change point, we scan the coverage between two consecutive change points from left to right. If it is generally decreasing, then TAPAS removes the first change point. If it is generally increasing, then TAPAS removes the second change point. The details of this filtration procedure are given in Algorithm 2 of the Supplementary Material.
If a UTR frame does not contain any intron, then the read coverage is generally expected to monotonically decrease across the frame. However, introns occur in UTRs (Barrett et al., 2012) and they cannot be ignored (Bicknell et al., 2012) in APA site analysis. When introns (either annotated or novel) exist in a frame, ‘wells’ could be created in the read coverage, as illustrated in Supplementary Figure S2b. This might lead the PELT algorithm to output change points around the introns that are unlikely to be true APA sites. These spurious change points can be removed according to cases as illustrated in Supplementary Figure S2c. More details of this filtration step are given in Algorithm 3 of the Supplementary Material. Note that various biases in RNA-Seq data such as positional bias, sequencing bias and mappability bias may also cause PELT to report false change points, but they are not dealt with explicitly here.
After filtering potentially spurious change points, TAPAS obtains a list of predicted APA sites for each UTR frame. Note that since the UTR frames are extracted from the input genome (or transcriptome) annotation and the end of each such frame is likely an (expressed) APA site, the real novelty of TAPAS is the detection of internal APA sites located inside the UTR frames.
2.1.1 Estimation of the abundance of alternative 3′ UTRs
2.2 Detecting differentially expressed APA sites
If two biological samples with multiple replicates are given, TAPAS first identifies potential APA sites for each replicate along with their abundance levels (measured in read count) by following the steps in Section 2.1. It then ‘aligns’ the APA sites from all replicates by merging them based on their genomic locations as follows. It puts all the APA sites of a gene across the replicates into a list and sorts them by their genomic locations. TAPAS then merges a pair of neighboring APA sites on the list into a cluster if their genomic distance is less than some threshold (which is set as 70 bps in our experiments based on several trials) and they are from different replicates. It repeats this step until no more neighboring APA sites can be merged. Finally, every singleton cluster (i.e. a cluster with only one APA site from some replicate) is merged with its nearest neighbor cluster. Each cluster will be considered as an APA site in the differential expression analysis, and its genomic location is determined by the majority location in the cluster. If there is a tie, TAPAS takes the median genomic location of all APA sites in the cluster. If a cluster contains an APA site a from a replicate r, then its abundance in r is defined as the abundance of a. If the cluster does not contain any APA site from r, then its abundance in r is zero.
Finally, TAPAS reports an APA site as differentially expressed if the Benjamini & Hochberg adjusted P-value for the APA site is less or equal to 0.1.
2.3 Detecting shortening/lengthening events of 3′ UTRs
3 Experimental results
In this section, we compare the performance of TAPAS with those of some state-of-the-art methods in term of detecting APA sites, differentially expressed APA sites and shortening/lengthening events on both simulated and real data.
3.1 Performance on detecting APA sites
In this experimental study, we compare TAPAS with two existing tools IsoSCM (Shenker et al., 2014) and GETUTR (Kim et al., 2015b) for detecting APA sites. As explained in Introduction, as APA sites are uniquely determined by transcripts, we also include the most popular transcriptome assembly method Cufflinks (Trapnell et al., 2010) in the comparison. In order to simulate RNA-Seq data, we download the human RefSeq annotation GRCh37 (hg19) from the UCSC Genome Browser. The annotation contains 19 150 genes with 44 923 transcripts and 21 731 APA sites. Among these genes, 17 083, 1769 and 298 have one, two or more than two unique APA sites each, respectively. The distribution of the lengths of the UTR frames extracted by TAPAS from the annotation is plotted in Supplementary Figure S3. Using this annotation and RNASeq Read Simulator (http://alumni.cs.ucr.edu/∼liw/rnaseqreadsimulator.html) (genexplvprofile.py with parameters -e -1, 2) introduced in (Li and Jiang, 2012), an expression profile is generated with the log normal distribution. Based on this expression profile, single-end reads with lengths 76 bps are simulated to create 50, 100 and 150 million read datasets. We consider three datasets to evaluate how sequencing depth may impact the performance of the tools in APA site detection.
Since it is difficult to detect APA sites from RNA-Seq data at single nucleotide precision, some degree of flexibility is used to match predicted APA sites to the annotated ones as done similarly in (Shenker et al., 2014). For TAPAS, if a predicted APA site is within 50 bps of some annotated APA site then the prediction is considered as a true positive (TP), or otherwise a false positive (FP). We use 100 bps as the flexible range of matching for IsoSCM, GETUTR and Cufflinks because it was used in (Kim et al., 2015b; Shenker et al., 2014). The numbers of TPs, FPs and true (i.e. annotated) APA sites (P) are used to calculate sensitivity () and precision (). In the calculation of sensitivity, all TPs matching the same true APA site count as one TP.
Among the 21 731 annotated APA sites, TAPAS identifies 16 866, 18 205 and 18 871 true APA sites on the 50, 100 and 150 million read datasets, respectively. For the other tools, IsoSCM identifies 11 790, 13 583 and 14 592 true APA sites, GETUTR identifies 15 495, 16 596, 17 082 true APA sites and Cufflinks identifies 15 117, 16 303 and 16 779 true APA sites, respectively. The sensitivity and precision of the methods are illustrated in Figure 1. It can be seen from the figure that all tools perform better with the increase of sequencing depth. Supplementary Table S1 provides a detailed account of the performance of the tools. Clearly, TAPAS outperforms all three other tools in both sensitivity and precision. Note that among the tools, IsoSCM and Cufflinks do not use the transcriptome annotation, but TAPAS and GETUTR use the annotation to define UTR frames. However, once the reads are mapped to the frames, the annotation is no longer used in the latter two tools. In particular, these tools do not consult the annotated APA sites when deciding if a change point should be output as a predicted APA site. While the use of annotation might have helped the performance of TAPAS and GETUTR (especially its sensitivity), it does not benefit GETUTR’s precision because the tool does not perform rigorous filtration as TAPAS and IsoSCM do. Although Cufflinks achieves a decent sensitivity, its precision is low because it assembles many transcripts with incorrect APA sites. GETUTR and IsoSCM have the worst performance in the experiment (in term of precision). While the performance of GETUTR is consistent with the results in (Kim et al., 2015b), it is reported in (Shenker et al., 2014) that IsoSCM performs well when the sequencing depth is 500 reads/kb or more. Note that the sequencing depths for our 50, 100 and 150 million read datasets are in fact 326, 652 and 977 reads/kb, respectively. However, the simulation study in (Shenker et al., 2014) assumed the abundance is distributed uniformly among all transcripts while we use a log normal distribution. Moreover, a slightly different (and more relaxed) criterion was used in (Shenker et al., 2014) to define correctly identified APA sites. To make sure that we have installed/run IsoSCM correctly, we created a small dataset based on Chromosome 18 with deep coverage (1000 reads/kb) and uniform abundance distribution. Using the evaluation criterion in (Shenker et al., 2014), IsoSCM was able to achieve 86.98% precision and 96.71% sensitivity, matching the results reported in (Shenker et al., 2014).
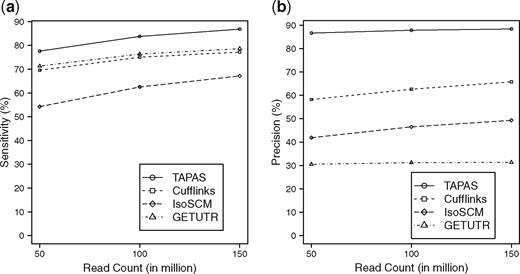
Performance of the tools in APA site detection on simulated data with different sequencing depths. (a) The sensitivity and (b) the precision
We also compare the performance of the four tools for detecting APA sites on real data. We download paired-end RNA-Seq reads from standard polyA+ libraries for mouse brain (GSE41637) from NCBI. TopHat2 is able to map 85.4% of these reads to the reference genome (76189196 out of 87264604 reads). The mouse RefSeq annotation NCBI37 (mm9) is downloaded from the UCSC Genome Browser. For performance evaluation, a -Seq dataset (BED file of annotated APA sites, GSM747481) for mouse (GSE30198) is also downloaded from NCBI and used as the benchmark, as done similarly in Shenker et al. (2014) and Xia et al. (2014). We run the tools with the mapped reads and compare their predicted APA sites against the benchmark using two flexible ranges of 50 and 100 bps for matching. Here, we consider two flexible ranges because the default flexible range for TAPAS is 50 bps but 100 bps was used as the default range in IsoSCM (Shenker et al., 2014). Among the 33 751 APA sites reported in the -Seq data, TAPAS, Cufflinks, IsoSCM and GETUTR identify 10 429, 5711, 6354 and 3111 APA sites, respectively, using the flexible range of 50 bps. When the flexible range is increased to 100 bps, TAPAS, Cufflinks, IsoSCM and GETUTR identify 12 224, 7956, 7680 and 6977 APA sites in the benchmark, respectively. Clearly, all tools found more true APA sites with more flexibility in matching. The detailed performance of the tools is illustrated in Figure 2 and Supplementary Table S2. Note that TAPAS and Cufflinks predicted similar numbers of APA sites while IsoSCM and GETUTR predicted many more. Clearly, TAPAS outperforms the three other tools on this real dataset. Supplementary Tables S2–S4) show that this advantage of TAPAS remains true when the prediction results of the other tools are filtered by the UTR frames or only internal APA sites located inside UTR frames are considered. In particular, it still outperforms Cufflinks even if the latter is provided with the reference transcriptome in RefSeq.
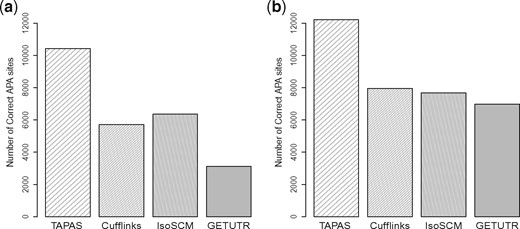
Number of correct APA sites detected by different tools on the real dataset when the flexible range for matching a predicted APA site to a true APA site of -Seq is 50 bps (a) and 100 bps (b)
Similar to the -Seq data, we also use mouse PAS-Seq data (BED file of annotated APA sites) from NCBI (GSE25450) as a benchmark for the performance evaluation of the tools using two flexible ranges (50 and 100 bps). This PAS-Seq dataset contains APA sites from mouse ES (embryonic stem), NPS (Neuropeptide S) and neuron cells. We extract APA sites from neuron for our evaluation. Moreover, we consider only APA sites that are supported by four or more reads of PAS-Seq. Among the 50 148 APA sites reported in the PAS-Seq data, TAPAS, Cufflinks, IsoSCM and GETUTR identify 26 336, 12 338, 17 606 and 6253 APA sites, respectively, using flexible range 50 bps and 29 346, 17 290, 19 919 and 15 442 APA sites, respectively, using flexible range 100 bps. The detailed results of the tools are given in Supplementary Table S5. Clearly, TAPAS outperforms other the tools again with respect to this new benchmark. Although all tools have better performance on the PAS-Seq benchmark (because it contains more sites), the trends are similar on both benchmarks.
3.2 Performance on APA site-based differential expression analysis
In this section, we compare the performance of TAPAS with Cuffdiff (Trapnell et al., 2013), DESeq (Anders and Huber, 2010) and DEXSeq (Anders et al., 2012) in detecting differentially expressed genes on simulated data. Note that TAPAS’s differential expression analysis is based on APA sites while Cuffdiff’s, DESeq’s and DEXSeq’s are based on transcripts, genes and exons, respectively. Moreover, DEXSeq is designed for differential splicing (DS) rather than DE analysis (Liu et al., 2014; Soneson et al., 2016). The data is simulated for two conditions as follows. For condition 1, the expression profile created in Section 3.1 is taken as its initial expression profile. Genes with at least one major transcript (i.e. a transcript that has RPKM value greater than or equal to 1) in the expression profile are kept, similar to Yang and Jiang (2016). For these genes, only transcripts with different APA sites are selected for the analysis. This results in 12 683 genes with a total of 14 716 transcripts (and 14 716 APA sites). For condition 2, 1254 (around 10% of all genes) genes are randomly selected as differentially expressed (DE) genes and a major transcript of each selected gene is chosen as a DE transcript (indirectly, making the APA site of that transcript a DE APA site). Among the 1254 DE genes, 630 are designated as up-regulated and 624 as down-regulated. For each up-regulated gene, the abundance of its DE transcript is increased by a factor of four and for each down-regulated gene, the abundance of its DE transcript is decreased by a factor of four, similarly to (Bullard et al., 2010) and (Yang et al., 2013). For the other (non-DE) transcripts, their abundance levels are kept the same as in condition 1. This gives us the initial expression profiles of both conditions.
Given the RPKM value ρt,c of a transcript t in the initial expression profile for condition c, a negative binomial distribution is used to generate a set of RNA-Seq reads rt,j for each replicate j of condition c. We generate six replicates for each condition. The mean and variance of the negative binomial distribution are and , respectively, where lt is the effective length of the transcript t in kilo bps, the size of the RNA-Seq library in millions and ϕ the dispersion. We simulate four RNA-Seq datasets by setting , 50, 100 and 150 million with ϕ = 0.179, as done in (Kimes et al., 2014). A similar simulation procedure was also adopted in (Yang and Jiang, 2016).
To compare the performance of TAPAS, Cuffdiff, DESeq and DEXSeq in differential expression analysis, we run all four tools on the simulated datasets to detect DE genes based on the abundance of either APA sites, transcripts, genes, or exons, respectively. In order to make a thorough comparison, Cuffdiff is run with and without the transcriptome annotation. DEXSeq divides exons into ‘counting bins’ [or expressed segments (Li et al., 2011)] according to the overlapping structure of annotated transcripts, and outputs DE counting bins between samples. It can be regarded as either a tool for detecting DE APA sites where we only consider counting bins in front of each APA site or a tool for detecting DE genes where we consider all counting bins in a gene. We adopt the latter option to be consistent with the other tools. Since it is designed for DS rather than DE analysis, we consider only true DE genes with at least two transcripts (298 in total) as the benchmark for evaluating DEXSeq. The FDR value of 0.1 is used in Cuffdiff to call a DE transcript to make it comparable with TAPAS (which uses the adjusted P-value of 0.1). Similar to TAPAS, the adjusted P-values for DESeq and DEXSeq are set to 0.1. The performance of TAPAS, Cuffdiff, DESeq and DEXSeq are summarized in Figure 3. From the figure, we can see that DESeq has the best overall performance and DEXSeq has the worst overall performance. Both TAPAS and Cuffdiff with annotation perform better with the increase of sequencing depth. In terms of sensitivity, DESeq outperforms the rest of the tools when the number of reads is less than 100 million. But, the sensitivity of TAPAS catches up quickly when the number of reads gets close to 100 million (perhaps helped by its improved performance on lowly expressed DE APA sites). TAPAS outperforms both Cuffdiffs when the number of reads reaches 50 million or more, even if it is given the transcriptome annotation. It also achieves a better precision than Cuffdiff without annotation. Although its precision is worse than that of Cuffdiff with annotation and DESeq, the gap closes rapidly with increased sequencing depth (again, perhaps helped by its improved performance on lowly expressed DE APA sites). The detailed results of TAPAS, Cuffdiff, DESeq and DEXSeq are given in Supplementary Table S6. It is interesting to observe that TAPAS is able to achieve a better overall performance than Cuffdiff with annotation when the sequencing depth is high in the experiment. This is because in the simulated datasets, the average number of APA sites contained in a gene is . Thus, most genes (and hence UTR frames) contain just a single APA site. This makes the estimation of the abundance of an APA site quite easy (actually trivial) while Cuffdiff still has to face the challenging problem of quantification, since the average number of annotated transcripts for each gene is .
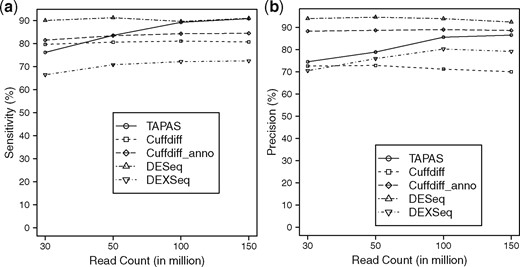
Performance of TAPAS, Cuffdiff, DESeq and DEXSeq in differential expression analysis in terms of sensitivity (a) and precision (b). Cuffdiff_anno denotes running Cuffdiff with the transcriptome annotation and DEXSeq_gene denotes running DEXSeq to detect DE genes (instead of DE APA sites)
Although an RNA-Seq based differential expression analysis is generally expected to perform better with the increase of sequencing depth (Zhang et al., 2014), it is interesting to observe that Cuffdiff does not exhibit this behavior when the transcriptome annotation is not given. In fact, its performance decreases slightly when the sequencing depth is increased. This could be caused by Cuffmerge, which is used by Cuffdiff without annotation to merge assembled transcripts from different replicates. In particular, Cuffmerge tends to merge a transcript that is contained in another into the latter transcript. It may also merge two similar transcripts into one transcript. Both cases may result in the loss of transcripts in a sample and thus false DE genes. When the sequencing depth increases, more transcripts are assembled for each replicate and hence more transcripts could be merged.
In this simulation experiment, DESeq is able to outperform the other tools mostly because each simulated DE gene contains only one DE transcript. Although the performance of DEXSeq is worse than the other tools, it is generally consistent with the performance results reported in (Liu et al., 2014; Soneson et al., 2016). Again, DEXSeq is designed for DS analysis instead of DE analysis. Although we used a different benchmark for DEXSeq in the experiment to account for this difference, our specific simulation procedure above might still have put DS analysis methods at a disadvantageous position since each DE gene is only required to have one major transcript.
3.3 Performance on detecting shortening/lengthening events
In this section, we compare the performance of TAPAS with two methods DaPars (Xia et al., 2014) and ChangePoint (Wang et al., 2014) in the literature for detecting genes with UTRs that shortened or lengthened between conditions on both simulated and real data. For the simulation study, similar to the above differential expression analysis, we need generate data for two conditions. For condition 1, the log normal distribution used in Section 3.1 is used again to obtain the initial expression profile, but we now consider only genes with at least one transcript whose RPKM value is greater than or equal to 2 and keep these genes for further analysis. The number of such gene is 7033. For each of these genes, select a transcript t with RPKM value at least 2 and introduce another transcript (called an artificial transcript) that is the same as t but with a UTR half as long as that of t. We then divide the initial expression value of t evenly between t and . To create data for condition 2, 674 genes are randomly selected as differentially expressed. Moreover, we make sure that the APA site of the artificial transcript in each such gene is at least 100 bps upstream of the corresponding original transcripts. Here, the distance of 100 bps is chosen because we found that the distance between two APA sites given in the benchmark data is more than 100 bps. Among the 674 artificial transcripts, 340 are chosen to be up-regulated and 344 are down-regulated by a factor of four. The abundance of the other (non-DE) transcripts is kept the same as in condition 1. This gives us the initial expression profiles of both conditions.
Similar to Section 3.2, six replicates per condition are generated using negative binomial distributions. Three different datasets are created with sequencing depths of 50, 100, 150 million reads, respectively. TAPAS, DaPars and ChangePoint are run on these datasets to compare their performance. We do not include Cuffdiff here because we have run Cufflinks on the first dataset (50 million read) and found that it output only one APA site for most genes and failed to identify most of the artificial APA sites. A similar observation about Cufflinks was also be made in (Shenker et al., 2014). Since ChangePoint does not support multiple replicates, it is run with only one replicate from each condition. The FDR cutoffs for both DaPars and ChangePoint are set to 0.1, since TAPAS uses 0.1 as adjusted P-value cutoff.
The performance of the tools is summarized in Figure 4. Again, the performance of all tools improve with the increase of sequencing depth. TAPAS outperforms the other two methods significantly. The poor performance of ChangePoint can probably be attributed to the fact it allows only one replicate per condition. (We also tried running ChangePoint by pooling all replicates but its performance got even worse.) The details results of all three tools can be found in Supplementary Table S7.
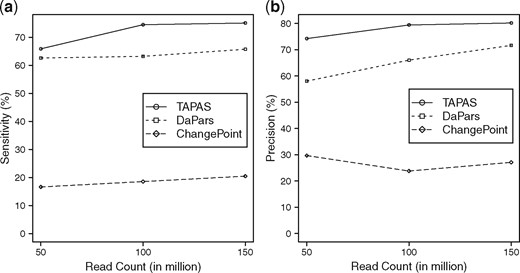
Performance of TAPAS, DaPars and ChangePoint on detecting genes with shortening/lengthening events in terms of sensitivity (a) and precision (b)
We also compare the tools on a real dataset (RNA-Seq reads from standard polyA+ libraries) used in (Xia et al., 2014). Four replicates of MAQC human brain (SRX016368, SRX016367, SRX016366, SRX016365) and MAQC UHR (SRX016372, SRX016371, SRX016370, SRX016369) data are downloaded from NCBI. The reads are then mapped to the reference human genome by TopHat2 to be used by the tools for shortening/lengthening analysis. To evaluate the performance, -Seq datasets are downloaded for MAQC human brain (GSM747473 and GSM747474) and UHR (GSM747475 and GSM747476) from NCBI. Similar to (Xia et al., 2014), the significance of each APA site in the -Seq data is assessed by using Fisher’s exact test, and only statistically significant APA sites are kept to create the benchmark of shortening/lengthening events by estimating the abundance of the APA sites using -Seq reads and relative change values for each pair of APA sites as in Equation 4 and applying the cutoff |rcij|≥ 1.0.
On this real dataset, TAPAS reports 872 genes having shortening/lengthening events with a precision of 61.7%. On the other hand, Dapars and ChangePoint output 808 and 734 genes having shortening/lengthening events with precision values of 39.85 and 34.33%, respectively. Clearly, TAPAS outperforms the other two tools significantly. The detailed results are given in Supplementary Table S8.
4 Discussion and time/memory efficiency
In this work, we have introduced TAPAS, a bioinformatics tool for detecting novel APA sites from standard RNA-Seq data. It is also capable of finding differentially expressed APA sites and genes with shortening/lengthening events. Our extensive experiments on both simulated and real data show that TAPAS performs better than all existing RNA-Seq based tools for APA site analysis. Compared with methods based on more dedicated experimental protocols such as 3P-Seq, standard RNA-Seq data is more abundant and easier to obtain. Moreover, a preliminary analysis of a 3P-Seq data against the corresponding 3′-Seq data and TAPAS prediction results suggests that although 3P-Seq may have a higher sensitivity than TAPAS, it actually achieves a lower precision than TAPAS (see Supplementary Table S11 for more details). Hence, we expect that TAPAS will serve as a useful APA site analysis tool in biological research.
Although both TAPAS and Cufflinks are capable of finding novel APA sites, TAPAS relies on a transcriptomic or genomic annotation while Cufflinks can assemble transcripts from scratch. As a result, Cufflinks may potentially discover novel APA sites that are not found by TAPAS, especially because TAPAS only searches in UTR frames. Hence, one may consider combining the output of both TAPAS and Cufflinks to increase the coverage of novel APA sites.
Since the efficiency of a bioinformatics tool is critical to its practical utility, we also compare TAPAS with the existing tools in term of time and memory efficiency. Similar to the study in the previous section, we divide the comparison into two groups: comparison between the APA site detection tools and comparison between the shortening/lengthening analysis tools. Our computation platform is a high-end computer cluster, where each node has 32 Intel Broadwell cores and 512 GB memory. We compare the four APA site detection tools (i.e. TAPAS, IsoSCM, GETUTR and Cufflinks) on the simulated dataset with 50 million reads as considered in Section 3.1 based on sequential running time (i.e. using a single core) and peak memory usage. As shown in Supplementary Table S9, although TAPAS requires a significant amount of memory, its running time is comparable to that of the other three tools. We then compare the running time and memory efficiency of the three tools for shortening/lengthening event detection (i.e. TAPAS, DaPars and ChangePoint) on the dataset with 50 million reads as considered in Section 3.3. It can be seen from Supplementary Table S10 that TAPAS requires more time and memory than DaPars when it is run on a single core, but the gap in running time can be significantly reduced when more cores are used (one core per replicate) since DaPars is unable to take advantage of parallelism. TAPAS is significantly more efficient than ChangePoint in both running time and peak memory usage. Also note that ChangePoint cannot be parallelized either.
Acknowledgements
The authors would like to thank the anonymous reviewers and associate editor for many constructive comments.
Funding
The research was partially supported by National Science Foundation grants DBI-1262107, DBI-1262134 and IIS-1646333 and the National Natural Science Foundation of China grants 61370172, 61502027 and 61772197.
Conflict of Interest: none declared.
References

