


Abstract
A standard method for the identification of novel RNAs or proteins is homology search via probabilistic models. One approach relies on the definition of families, which can be encoded as covariance models (CMs) or Hidden Markov Models (HMMs). While being powerful tools, their complexity makes it tedious to investigate them in their (default) tabulated form. This specifically applies to the interpretation of comparisons between multiple models as in family clans. The Covariance model visualization tools (CMV) visualize CMs or HMMs to: I) Obtain an easily interpretable representation of HMMs and CMs; II) Put them in context with the structural sequence alignments they have been created from; III) Investigate results of model comparisons and highlight regions of interest.
Source code (http://www.github.com/eggzilla/cmv), web-service (http://rna.informatik.uni-freiburg.de/CMVS).
Supplementary data are available at Bioinformatics online.
1 Introduction
Probabilistic models are constructed for specific RNA and protein families sharing a common ancestor and a biological function. The most prominent instances are the HMM architecture as used by HMMER3 (Eddy, 2011) and the CMs utilized by INFERNAL (Nawrocki and Eddy, 2013). Currently there are 2686 RNA families available from the Rfam (Burge et al., 2012; Kalvari et al., 2017; Nawrocki et al., 2015) database and 16 712 from Pfam (Finn et al., 2016). Visualization of the models provides an overview over whole regions and allows to directly inspect states, nodes and probabilities. A HMM visualization tool exists as part of SAM (Krogh et al., 1994), while for CMs, as far as we are aware, no automatic solution exists.
2 Approach
Each tool of CMV accepts one or more models (INFERNAL, HMMER3 format) and optionally one or more corresponding alignments (Stockholm format) as input. The tools for comparison visualization require inputs in CMCompare (Eggenhofer et al., 2013; Höner zu Siederdissen and Hofacker, 2010) format. Additional parameters can be set that control the level of detail of the visualization. In the minimal setting only the index for each node is shown, while full details provide states and probabilities. Moreover it is possible to select if emission probabilities should be displayed as numerical values or using a graphical representation. The number of entries in the alignment, the image size and the output format (svg, png, eps, pdf) can also be defined via options.
The tools have been written using the diagrams library with a cairo back-end for visualization. Processing takes on average, for the first 100 Rfam models, 13 s for a model with detailed output (see Supplementary Table 1).
The tools create one visualization output file per input model. If the Stockholm alignment for the family was provided, then a second output file is generated per alignment.
It is possible to select from three levels of visualization detail (minimal, simple, detailed) for family models and, exclusively for CMs, linear or tree layout. The minimal detail setting shows each node (roughly corresponding to paired nucleotides or single aminoacids or nucleotides) of the model as a box labeled with the index of the node. When the detail level is set to simple, emission probabilities are included in the visualization for each node in case of HMMs and the node type in case of CMs. The detailed level shows the individual states (encoding match, insertion and deletion options) per node, with emission and transition probabilities (see Fig. 1B–G). Emission probabilities are either shown as numerical values (score, probability) or as graphical bars. Transition probabilities are visualized as arrows between states, with probabilities indicated by increasing opacity, as well as text labels. For more information and figures see the Supplementary Material.
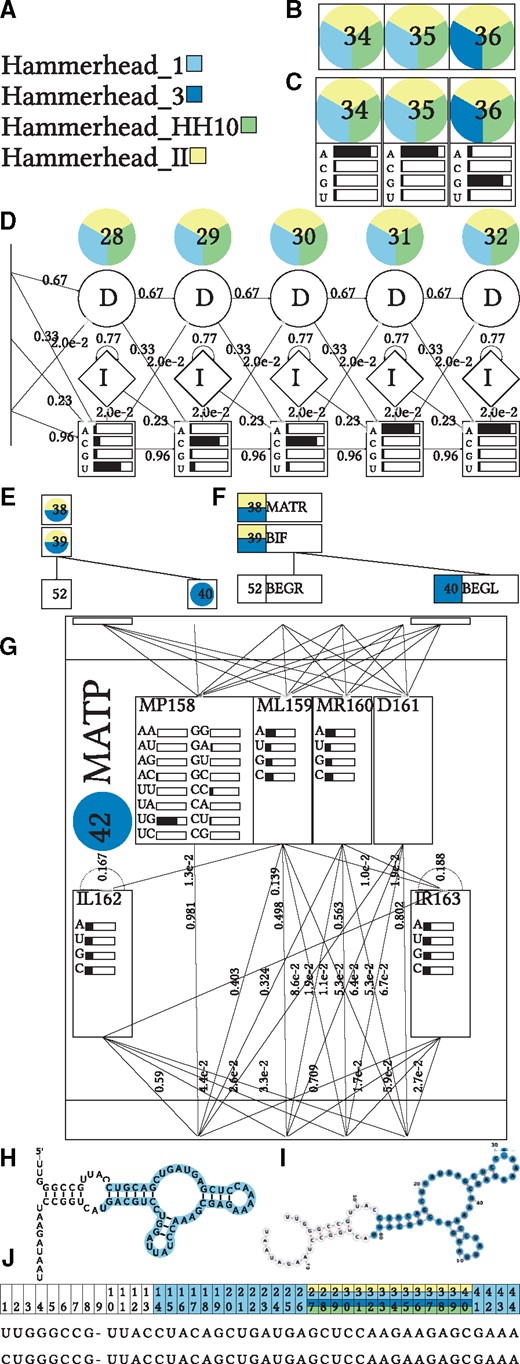
Visualization of HMM (B, C, D) and CM (E, F, G) consensus secondary structure (H, I) and Stockholm Alignment (J) for the Hammerhead RNA_HH9 in comparison with families from the Hammerhead RNA family clan (A). Color labels indicate to which other model an alignment column or node has been linked via CMCompare (Complete figures are shown in Supplementary Material). A: Color Legend for the compared models; B: minimal HMM details show nodes with indices, C: simple HMM details show emission probabilities as well; D: detailed HMM view shows states with emission and transition probabilities; E: minimal CM details show nodes with indices; F: simple CM details add node type information; G: detailed CM view shows nodes with states and emission and transition probabilities; H and I show secondary structure visualization via R2R and forna; J shows a slice of input alignment, each line corresponds to one family member. Numbers on top of the columns represent the column index stored in the corresponding CM node
Results of model comparison are visualized by labeling nodes with colors encoding the linked models (see Fig. 1A). Since the alignment columns corresponding to a node are known via the column index, the comparison information is also annotated in the alignment visualization (see Fig. 1J).
In the case of (structured) RNAs this comparative information can be mapped back to the consensus secondary structure of the family, thus enabling the identification of specific motifs or regions that are linked. This is done via labeling a secondary structure visualization of R2R (Weinberg and Breaker, 2011) or alternatively an input file for forna (Kerpedjiev et al., 2015) (see Fig. 1H and I).
The tool also is available as a web-service, along with documentation and precomputed examples in three detail levels for all available models in the Rfam database and the first 1500 models of the Pfam database.
3 Conclusion
We provide an open-source tool and web-service for the visualization of HMMs, CMs, their alignments and, for RNA, their consensus secondary structure. The visualizations can supplement models in the Pfam and Rfam databases and enable convenient inspection of newly constructed models with RNAlien (Eggenhofer et al., 2016), RNAscClust (Miladi et al., 2017), or the RNA workbench (Backofen et al., 2017; Grüning et al., 2017). Nodes linked by comparison to other models are highlighted in the visualization, which allows to investigate sequence and structure elements shared among family clans. This simplifies the identification of domains, respectively secondary structure elements, with potentially related biological functionality.
Funding
This project was funded, in part, by the Austrian Fonds zur Förderung der wissenschaftlichen Forschung (FWF), project Doktoratskolleg RNA BiologyW1207-B09, project SFB F43 RNA regulation of the transcriptome, Deutsche Forschungs Gesellschaft (DFG) grant BA 2168/3-3 and DFG BA 2168/16-1. The open access fee was covered by FWF F 4305-B09. We thank the anonymous reviewer for constructive comments, which helped us to improve the tools and the manuscript.
Conflict of Interest: none declared.
References

