


Abstract
In a scenario where populations A, B1 and B2 (subpopulations of B) exist, pronounced differences between A and B may mask subtle differences between B1 and B2.
Here we present iterClust, an iterative clustering framework, which can separate more pronounced differences (e.g. A and B) in starting iterations, followed by relatively subtle differences (e.g. B1 and B2), providing a comprehensive clustering trajectory.
iterClust is implemented as a Bioconductor R package.
Supplementary data are available at Bioinformatics online.
1 Introduction
In a scenario where two clusters may exist (A and B), with B further divided into two sub-clusters (B1 and B2), the more pronounced differences between A and B may prevent subtle differences between B1 and B2 from being revealed. To solve this problem and to better describe the sub-cluster hierarchy, we propose to perform cluster analysis iteratively, such that individual clusters may be subdivided into smaller ones until further subdivisions are no longer statistically significant. Thus, for example, differences between A and B would lead to identification of two clusters in the first iteration, while B1 and B2 would be further identified in iteration 2. Previous effort in iterative clustering analysis (Usoskin et al., 2015) lacks systematic criteria in determining key clustering parameters, e.g. optimal number of clusters among iterations. The iterClust Bioconductor R package provides an unsupervised statistical framework for iterative clustering analysis that can be used, for instance, to discover biological heterogeneity, especially in single cell analyses of heterogeneous tissues, where cell lineages impose a relatively strong hierarchical structure, or solve general clustering problems.
2 Results
R function iterClust() performs iterative clustering analysis by organizing user-defined functions in the following workflow:
ith iteration start
featureSelect(), select clustering features in this iteration.
clustHetero(), confirm observation sets to be splitted in this iteration are heterogeneous.
coreClust(), for heterogeneous observation sets confirmed by clustHetero(), generate several clustering schemes.
clustEval(), choose the optimal scheme given by coreClust().
obsEval(), evaluate how each observation is clustered.
obsOutlier(), poorly clustered observations are removed.
ith iteration end
iterClust takes diverse feature selection methods (Saeys et al., 2007); clustering algorithms, e.g. partition-based, hierarchy-based (Kaufman and Rousseeuw, 2009), density-based (Ester et al., 1996) and graph-based (Newman and Girvan, 2004); and cluster/observation evaluation methods, e.g. sampling-based consensus score (Monti et al., 2003) or regular silhouettes score (Rousseeuw, 1987). In addition, parameters for all user-defined functions can be set up as a function of the iteration, for instance, clustHetero() can be set up such that looser threshold parameters may be used as the iteration depth increases to deal with more and more subtle heterogeneity. In addition, featureSelect() can be used to select clustering features based on previous iterations. For instance this can help exclude features used to identify coarser clusters in prior iterations to unveil novel, more subtle heterogeneity at the current iteration. Taken together, these two functions make iterClust a highly flexible statistical framework for iterative cluster analysis. The results of iterClust are organized by iteration. Within a specific iteration, for each cluster, the corresponding observation names and clustering features are recorded, providing a comprehensive clustering trajectory.
As a statistical framework, the running time, as well as influencing factors of iterClust is majorly dependent on the clustering algorithm in coreClust() function that is specified by the user. As an example, we benchmarked iterClust on a public human PBMC (Peripheral Blood Mononuclear Cell) scRNA-Seq dataset. The original dataset was subsampled into different sizes, and pam() function (Partition Around Medoids, in R package cluster) was used in coreClust() function. In this case, running time increases exponentially and linearly as number of cells and genes increases, respectively, agreeing with the property of pam() function (Supplementary Fig. S1).
We further tested the performance of iterClust in heterogeneity detection. As shown in Figure 1, within the PBMC dataset, in the first iteration, iterClust identified T-cell and APC (Antigen Presenting Cell) clusters. In the second iteration, the algorithm further separated the original two clusters into additional sub-clusters, including monocyte and B-cells in the APC cluster (monocyte and B-cell are two major types of APC), as well as effector T-cell and naïve/memory T-cells in the T-cell cluster. Critically, all clusters identified by the analysis were characterized by well-established cell-type-specific gene expression markers (Supplementary Fig. S2). The finer grain sub-division was not the optimal solution using single pass analysis (Supplementary Fig. S3). Taken together, iterClust can correctly elucidate complex hierarchical substructures that contribute to tissue heterogeneity in PBMC single cell dataset, with more pronounced differences in starting iterations, followed by relatively subtle differences, providing a comprehensive clustering trajectory. We further confirmed these conclusions on independent scRNA-Seq datasets (Supplementary Figs S4 and S5), as well as general benchmarking datasets for clustering analysis (Supplementary Figs S6 and S7).
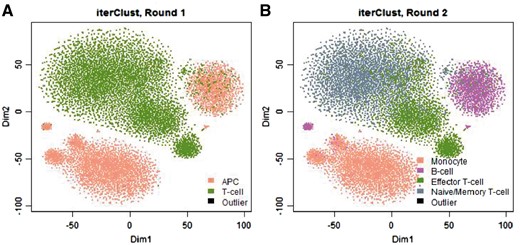
Revealing cell types within human PBMC using iterClust. For illustration purpose, the data was projected on 2D-space with t-SNE plots (Maaten and Hinton, 2008), on which iterClust discovered clusters were colored. iterClust in first round (A) separated two major cell types, T-cell and APC (Antigen Presenting Cell) and second round (B) further dissected these clusters, separating monocyte and B-cell in APC cluster, as well as Effector T-cell and Naïve/Memory T-cell among T-cell cluster
Acknowledgements
We thank Dr. Mariano J. Alvarez, Dr. Eugene F. Douglass and Dr. Pasquale Laise for discussion and comments on the work.
Funding
This work was supported by US National Institutes of Health grants R35 CA197745-03 (Outstanding Investigator Award) and U54 CA209997 (Centers for Cancer Systems Therapeutics).
Conflict of Interest: Dr. Califano is founder and equity holder of DarwinHealth Inc., a company that has licensed some of the algorithm used in this manuscript from Columbia University. Columbia University is also an equity holder in DarwinHealth Inc.
References
Author notes
The authors wish it to be known that, in their opinion, Hongxu Ding and Wanxin Wang authors should be regarded as Joint First Authors.

