


Abstract
Efflux protein plays a key role in pumping xenobiotics out of the cells. The prediction of efflux family proteins involved in transport process of compounds is crucial for understanding family structures, functions and energy dependencies. Many methods have been proposed to classify efflux pump transporters without considerations of any pump specific of efflux protein families. In other words, efflux proteins protect cells from extrusion of foreign chemicals. Moreover, almost all efflux protein families have the same structure based on the analysis of significant motifs. The motif sequences consisting of the same amount of residues will have high degrees of residue similarity and thus will affect the classification process. Consequently, it is challenging but vital to recognize the structures and determine energy dependencies of efflux protein families. In order to efficiently identify efflux protein families with considering about pump specific, we developed a 2 D convolutional neural network (2 D CNN) model called DeepEfflux. DeepEfflux tried to capture the motifs of sequences around hidden target residues to use as hidden features of families. In addition, the 2 D CNN model uses a position-specific scoring matrix (PSSM) as an input. Three different datasets, each for one family of efflux protein, was fed into DeepEfflux, and then a 5-fold cross validation approach was used to evaluate the training performance.
The model evaluation results show that DeepEfflux outperforms traditional machine learning algorithms. Furthermore, the accuracy of 96.02%, 94.89% and 90.34% for classes A, B and C, respectively, in the independent test results show that our model can perform well and can be used as a reliable tool for identifying families of efflux proteins in transporters.
The online version of deepefflux is available at http://deepefflux.irit.fr. The source code of deepefflux is available both on the deepefflux website and at http://140.138.155.216/deepefflux/.
Supplementary data are available at Bioinformatics online.
1 Introduction
Efflux protein is a type of transporter that resides in the cytoplasmic membrane of any sort of cells. As active transporters, efflux pump (efflux protein) requires source of chemical energy to perform their functions. Pumping out toxic substances or extruding the foreign chemicals that are not necessary to external environment of cells is the main task of these proteins as a primary mechanism of antibiotic resistance (Sarkar et al., 2012). Consequently, efflux proteins with pump specifics are required for all living organisms. Furthermore, membrane proteins are layers acting as barriers against undesirable compounds from outside the cells (Ranaweera et al., 2015). Although residing in membrane proteins, efflux proteins have specific biological functions. Active efflux transport proteins skip membrane barriers and transport waste substances through specific pump of the efflux pump. In general, efflux proteins are classified into five different families that represent five different pumps of efflux transporters. They are major facilitator superfamily (MFS) (Pao et al., 1998; Yan, 2013; Ranaweera et al., 2015), ATP-binding cassette superfamily (ABC) (Schneider and Hunke, 1998), small multidrug resistance family (SMR) (Chung and Saier Jr, 2001), resistance–nodulation–cell division superfamily (RND) (Nikaido and Takatsuka, 2009) and multiantimicrobial extrusion protein family (MATE) (Kuroda and Tsuchiya, 2009). Since efflux proteins are active transporters that require energy (chemical energy) to perform their functions (Sun et al., 2014; Ranaweera et al., 2015), the understanding of multisubunit complex (amino acid sequence) and energy sources of efflux pump is an indispensable idea. Among five energy sources of efflux proteins, ABC, one of the largest and possibly the oldest superfamilies with representatives in all extant phyla from prokaryotes to humans, is the primary active transporters; RND superfamily (catalyzes the active efflux of many antibiotics and chemotherapeutic agents) and MFS, SMR, and MATE families are secondary active transporters (West, 1980; Saidijam et al., 2005).
Numerous studies have been conducted on efflux proteins. For example, Saidijam et al. (2017) studied efflux proteins in blood–brain barrier that provides a mechanism for pumping out the waste metabolics from the brain, preventing entry of unwanted substances (such as drugs and xenobiotics) and help to maintain brain homeostasis (Saidijam et al., 2017). Additionally, Sarkar et al (2012) proposed a method for predicting minimum inhibitory concentration ratios based on characteristics of the antibiotic (size, hydrophobicity, scored interactions with efflux pumps). Regarding prediction model, there are two different works to identify efflux proteins from membrane and transport proteins. Ou et al. (2013) used a Radial Basis Function (RBF) network to predict efflux proteins. Taju and Ou (2016) employed a deep learning approach via 2 D convolutional neural network (2 D CNN) model to identify efflux proteins in membrane and transport proteins and achieved higher accuracy compared to RBF network approach. Our current study focuses on classifying efflux proteins into three classes based their amino acid structures and energy dependence mechanisms. Compared to Taju and Ou (2016), this study can be considered as a further research about efflux proteins in transporters.
Recently, with the successful use of deep neural networks (DNNs) approach (a brain-inspired approach) in various fields, including speech recognition and computer vision, many researchers tried to implement the same approach in bioinformatics field. CNN model is among the popular choices. Several applications of CNN model in the bioinformatics field were conducted to classify the types of proteins, predict binding sites, predict structures and predict protein–proteins interactions based on sequence information. Many researchers have used deep learning for solving bioinformatics problems, for example, classification of efflux proteins from membrane and transport proteins, prediction of electron transport proteins, prediction of protein secondary structure, prediction of DNA–protein binding sites and prediction of protein–protein interaction (Taju and Ou, 2016; Wang et al., 2016; Zeng et al., 2016; Le et al., 2017; Sun et al., 2017). According to their family functions, the role of efflux proteins is essential in protein transport process, and it is necessary to develop a novel method to classify each family that represents each pump specific of efflux proteins. In this study, we propose an approach that combines 2 D CNN model with PSSM profiles as a reliable tool to find the hidden features of the dataset.
As shown in a series of recent publications (Chen et al., 2013; Lin et al., 2014; Liu et al., 2016; Chen et al., 2016; Jia et al., 2016; Liu et al., 2015; Cheng et al., 2017; Feng et al., 2017; Liu et al., 2017), to develop a really useful sequence-based statistical predictor for a biological system, one should observe the five-step rule (Chou 2011); i.e. making the following five steps very clear: (i) how to construct or select a valid benchmark dataset to train and test the predictor; (ii) how to formulate the biological sequence samples with an effective mathematical expression that can truly reflect their intrinsic correlation with the target to be predicted; (iii) how to introduce or develop a powerful algorithm (or engine) to operate the prediction; (iv) how to properly perform cross-validation tests to objectively evaluate its anticipated accuracy; and(v) how to establish a user-friendly web server for the predictor that is accessible to the public. Subsequently, we describe how to deal with these steps one-by-one.
2 Materials and methods
2.1 Efflux protein families
In efflux protein structures, three components in cell membrane were used to describe pump specifics, amino acid structures and energy-dependent mechanism of efflux proteins. They are inner membrane efflux proteins (IEPs), periplasmic efflux proteins (PEPs) and outer membrane efflux proteins (OEPs) (Johnson and Church, 1999; Webber and Piddock, 2003; van Amsterdam et al., 2005). Active transporter efflux proteins require chemical energy sources to perform their functions. As shown in Figure 1, we can categorize efflux proteins into three classes based on their chemical energy sources and amino acid structures. The first class (A) is a secondary active transporter that performs its function by pumping hydrogen (H+) or sodium (Na+) ions into the cell as a source of chemical energy. The second class (B) is also a secondary active transporter. In gram-negative bacteria, class B is a multisubunit complex spanning IEPs, PEPs and OEPs (Blair and Piddock, 2009; Nikaido and Takatsuka, 2009). Finally, the third class (C) is a primary active transporter utilizing adenosine triphosphate hydrolysis (ATP), and adenosine diphosphate (ADP) and one inorganic phosphate group (ADP + Pi) (DuPont, 1992) as sources of chemical energy.
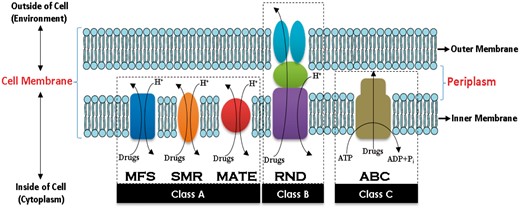
Efflux protein families in the cell membrane. Efflux proteins are active transporters and localized in the cytoplasmic membrane of all kinds of cells. There are five families of efflux proteins, and each performs its function by utilizing sources of chemical energy. (Color version of this figure is available at Bioinformatics online.)
2.2 Data collection
As described in the DeepEfflux architecture in Figure 2, efflux protein data were extracted from Transporter Classification Database (TCDB) (Saier et al., 2014,). Then, the data were separated into two parts, training and testing data, for developing and evaluating the prediction model. In this study, we named each class by using A, B or C character. MFS, SMR and MATE are grouped together and referred to as class A, RND is referred to as class B and ABC family is referred to as class C. We divided the task into three binary classification subproblem: classifying class A against class B and C, classifying class B against class A and C and classifying class C against class A and B. Table 1 shows three datasets of efflux protein families used in this study. From the original data, we removed protein sequences with similarity greater than 80% using BLAST (Altschul et al., 1997). We set aside 50, 10 and 116 proteins of class A, B and C, respectively, for use as testing data, and the remaining 155, 32 and 348 proteins of class A, B and C, respectively, were used for building the model. The 5-fold cross validation technique was used to evaluate the performance of the training process.
Family of efflux proteins data
| No. | (Super) family | Original data | Identity < 20% | Training data | Testing data | Name |
|---|---|---|---|---|---|---|
| 1 | MFS | 755 | 191 | 144 | 47 | Class A |
| 2 | SMR | 15 | 5 | 4 | 1 | |
| 3 | MATE | 41 | 9 | 7 | 2 | |
| 4 | RND | 202 | 42 | 32 | 10 | Class B |
| 5 | ABC | 1670 | 464 | 348 | 116 | Class C |
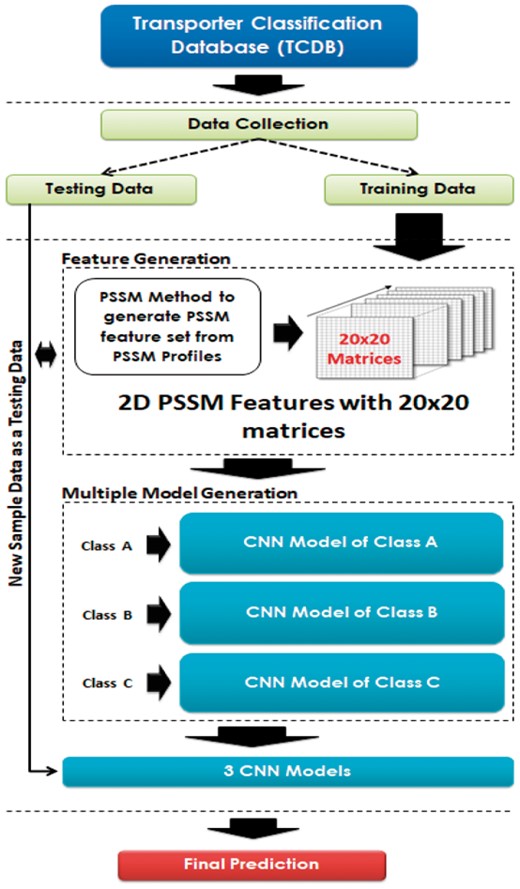
Architecture of DeepEfflux. (Color version of this figure is available at Bioinformatics online.)
2.3 Imbalance data
We found that our data are imbalanced, and this will greatly affect the classification process and thus the performance. Specifically, the dataset for classifying class B against class A and C is the one with a ratio of positive–negative class below 7%. Commonly, there are two approaches for addressing the imbalance of training data. The first one is the data processing approach (resample the training set) and the second one is the algorithmic approach (Wu and Chang, 2003). In this study, we applied the data processing approach by oversampling the minority class in the training data. The oversampling treatments were introduced by previous investigators with the significant improvements (Liu et al., 2015; Xiao et al., 2015; Jia et al., 2016). By choosing oversampling approach over undersampling approach in dealing with imbalance problem, we obtained 2 benefits: having sufficient data for building solid model and avoiding losing valuable information. In light of that, during the experiment, we gradually increased the number of minority class instances and recorded the performance after each step. The final selected model is the one achieving the best performance with concern about the balance between sensitivity and specificity.
2.4 Feature generation
With the explosive growth of biological sequences in the postgenomic age, one of the most important but also most difficult problems in computational biology is how to express a biological sequence with a discrete model or a vector yet still keep considerable sequence order information or key pattern characteristic. This is because all the existing machine learning algorithms can only handle vector but not sequence samples as elucidated in a comprehensive review (Chou, 2015). However, a vector defined in a discrete model may completely lose all the sequence pattern information. To avoid completely losing the sequence pattern information for proteins, the pseudo amino acid composition (PseAAC) (Chou, 2001) was proposed. Ever since the concept of PseAAC was proposed, it has been widely used in nearly all the areas of computational proteomics (see, e.g., Dehzangi et al., 2015; Meher et al., 2017) as well as a long list of references cited in (Chou, 2017)). Because it has been widely and increasingly used, recently three powerful open-access softwares, called ‘PseAAC-Builder,” “propy” and “ PseAAC-General,” were established: The former two are for generating various modes of Chou’s special PseAAC, while the third is for those of Chou’s general PseAAC (Chou 2011), including not only all the special modes of feature vectors for proteins but also the higher level feature vectors such as “Functional Domain” mode (see equations 9 and 10 in Chou, 2011), “Gene Ontology” mode (see equations 11 and 12 of Chou, 2011) and “Sequential Evolution” or “PSSM” mode (see equations 13 and 14 of Chou, 2011). Encouraged by the successes of using PseAAC to deal with protein/peptide sequences, the concept of Pseudo K-tuple Nucleotide Composition (Chen et al., 2014) was developed recently for generating various feature vectors for DNA/RNA sequences and has been found very useful (Chen et al., 2015) as well. Particularly, recently a very powerful web-server called “Pse-in-One” (Liu et al., 2015) and its updated version “Pse-in-One2.0” (Liu et al., 2017) have been established which can be used to generate any desired feature vectors for protein/peptide and DNA/RNA sequences according to the need of users’ studies or their own definitions. In the current study, we are to use the evolutionary features extracted from sequence samples via PSSM to formulate the protein samples for identifying the families of efflux proteins in transporters.
PSSM is a type of scoring matrix for a protein sequence. PSSM scores generally show amino acid substitution scores for each position in a protein multiple sequence alignment. In bioinformatics field, there are many publications that adopted PSSM techniques to solve problems such as protein secondary structure prediction (Jones, 1999), protein disorder prediction (Su et al., 2006) and electron transport protein identification (Le et al., 2017), and their results show significant improvements. Therefore, in this study, the PSI-BLAST (Altschul et al., 1997) and nonredundant protein database were used to generate PSSM profiles from our fasta files of efflux proteins. Supplementary Figure S1 shows the way we generated our dataset using PSSM method.
Generally, a PSSM profile consists of position component (index of each amino acid residues in a sequence after multiple sequence alignment) and profile component (a matrix with 20 columns represent 20 possible mutations of 20 amino acid residues). To discover the molecular function of efflux proteins, we calculated the position components of PSSM profiles representing 400 D input vectors as input features for our DeepEfflux model. All elements with the same amino acid in PSSM profiles were summed up, then divided by the sequence length and finally scaled by sigmoidal or softmax normalization. We conducted experiments on both data versions: with and without feature scaling (normalization). We found out that our dataset without normalization achieved better performance.
2.5 CNN structure
We implemented this study using CNN which is the most important deep neural network. CNN has been applied in many fields and achieved impressive results, especially in computer vision when an input is normally a 2 D matrix of image pixel densities. Encouraged by these results, we took advantage of the 2 D structure of an input image of CNN architecture and conveniently made similar 2 D inputs of PSSM matrixes with the sizes of 20 × 20s. The purpose of using 2 D CNN model is to catch the hidden figures inside PSSM profiles rather than using 1D. Next, PSSM profiles were connected to 2 D CNN design from input layer through several hidden layers to output layer. Supplementary Figure S2 describes the procedure of inputting a PSSM profile into a CNN model, then passing through a series of convolutional, nonlinearity, pooling (down-sampling) and fully connected layers and finally to an output.
Regarding the way we constructed the CNN architecture of DeepEfflux, we generally followed the typical CNN architecture. Our model contains seven hidden layers including one 2 D convolutional layer, two activation functions, one pooling layer, one flattening layer and two fully connected layers. The first layer in a CNN is always a convolutional layer. Particularly, in our CNN, first layer contains PSSM profile on which we applied 2 D convolutional operations with some existing parameters including nxn kernel size, f filters, 1 × 1 strides and 1 × 1 zero-padding. 2 D convolutional operations were used to filter the important motif features. We learned the network by changing the above-mentioned hyper-parameters to find the appropriate ones. We next added a Rectified linear unit (ReLU) activation function for introducing nonlinearity to make the model able to represent our data better. Furthermore, to reduce the size of matrix calculation, remove nonmaximal values and control overfitting, we next added 2 D max-pooling layer with 1 × 1 strides, 8 × 8 filter sizes and 1 × 1 additional padding dimensions. Before we applied two fully connected layers, we added flattening layer to flatten the input. Our first fully connected layer contains 500 hidden nodes. After this step, sigmoid activation function was used to decide whether each neuron can be activated or not. Subsequently, we applied another fully connected layer with two hidden nodes for binary classification of DeepEfflux model. For the output layer, we used softmax function as a simple classifier to classify our class of efflux protein families.
2.6 Assessment of predictive ability
For binary classification problem that classifies class A against classes B and C, we defined class A sequences as positive data, and the class B and class C sequences as negative data. Similar approaches were applied for the other binary classification problems regarding classes B and C. All these proteins were divided into two sets: independent testing dataset and training dataset. We first applied 5-fold cross-validation technique to develop our model and evaluate the training process, and then the independent dataset was used to assess the ability of our model in predicting new data. In order to measure the predictive performance, we considered to adopt Chou’s criterion (Chou, 2001) used in predicting signal peptides. The four metrics used such as sensitivity (Sen), specificity (Spec), precision (Pre), accuracy (Acc) and Matthews’s correlation coefficient (MCC) (see, e.g. Chen et al., 2007; Feng et al., 2013; Liu et al., 2015; Xiao et al., 2015; Jia et al., 2016a; Jia et al., 2016b; Liu et al., 2017) can be formulated as in supplementary file.
3 Results and discussion
In this experiment, n-gram model and word cloud technique were used to perform our motif analysis which aims at showing the important motifs in the dataset. We also used MXNet library (Chen et al., 2015) as a deep learning framework to build the DeepEfflux model. We further compared the proposed method with previous method using QuickRBF Classifier, software available at https://csie.org/∼yien/quickrbf/ (Ou, 2005) (Based on some of our research experiences Ou et al., 2008, Ou and Chen, 2009, Chen et al., 2011, Ou et al., 2013, quickRBF has higher performance compared to well-known LibSVM, Random forest, Naïve Bayes and KNN classifiers). We also examined the effect of using different optimizers including Adam (Kingma and Ba, 2014), Adadelta (Zeiler, 2012), AdaGrad (Duchi et al., 2011), RMSProp (Bengio) and Stochastic Gradient Descent (SGD) (Bottou, 2010) optimizers on our model.
3.1 Analysis of the important sequence motif
In this analysis, we tried to observe the motifs that often appear in protein sequences. Supplementary Table S1 shows the 10 most frequent motifs in class A, B and C of more than one amino acid pair residues with n-gram contiguous sequence. The n-gram model shows that unigram, bigram and trigram of amino acid contain more important motif residues. We performed this analysis on training data. Unigrams show that Leu (L), Ala (A), Gly (G) and Ser (S) amino acids are dominant in classes A, B, and C. Regarding bigrams and trigrams, bigram LL and trigram LLL are more abundant in the protein sequences under study. These residues are hydrophobic and polar in nature. Supplementary Figure S3 shows unigram, bigram, trigram, four-gram and five-gram word cloud (left to right) created from efflux protein motif sequences. From the figure, we can see the n-gram with highest frequencies of each family.
Performance comparison of CNN model with different optimizers on PSSM data
| Class | Optimizer | Sen | Spec | Acc | MCC |
|---|---|---|---|---|---|
| Class A | Adam | 92.00% | 96.83% | 95.45% | 88.83% |
| Adadelta | 75.00% | 96.21% | 90.91% | 74.94% | |
| AdaGrad | 93.55% | 85.96% | 88.64% | 76.94% | |
| RMSProp | 92.45% | 94.31% | 93.75% | 85.45% | |
| SGD | 91.23% | 89.92% | 90.34% | 78.93% | |
| Class B | Adam | 53.85% | 94.48% | 91.48% | 43.97% |
| Adadelta | 54.55% | 96.36% | 93.75% | 48.89% | |
| AdaGrad | 68.75% | 93.13% | 90.91% | 53.79% | |
| RMSProp | 45.45% | 95.76% | 92.61% | 39.58% | |
| SGD | 93.75% | 83.33% | 85.23% | 64.47% | |
| Class C | Adam | 93.22% | 82.76% | 89.77% | 76.68% |
| Adadelta | 94.78% | 40.48% | 81.82% | 43.79% | |
| AdaGrad | 91.94% | 65.38% | 84.09% | 60.40% | |
| RMSProp | 96.09% | 64.58% | 87.50% | 66.99% | |
| SGD | 69.07% | 86.08% | 76.70% | 55.22% |
Notes: By using the phrase “class A”, we mean the attempt to classify class A against class non-A (class B and C). Similar meanings are applied to phrases “class B” and “class C.”
3.2 Different optimizers with PSSM features
Table 2 shows the predictive performance of DeepEfflux with five different optimizers on PSSM dataset. Best optimizer results for each class are highlighted in bold.
Performance comparison of CNN model with different optimizers on PSSM + AAIndex data
| Class | Optimizer | Sen | Spec | Acc | MCC |
|---|---|---|---|---|---|
| Class A | Adam | 89.36% | 98.45% | 96.02% | 89.72% |
| Adadelta | 96.15% | 68.37% | 80.68% | 65.49% | |
| AdaGrad | 88.24% | 94.40% | 92.61% | 82.17% | |
| RMSProp | 90.20% | 95.20% | 93.75% | 84.91% | |
| SGD | 93.65% | 84.96% | 88.07% | 76.08% | |
| Class B | Adam | 76.92% | 96.32% | 94.89% | 66.64% |
| Adadelta | 77.78% | 92.41% | 90.91% | 59.93% | |
| AdaGrad | 81.25% | 94.38% | 93.18% | 65.74% | |
| RMSProp | 69.23% | 95.71% | 93.75% | 59.08% | |
| SGD | 94.44% | 80.00% | 82.95% | 62.86% | |
| Class C | Adam | 95.04% | 80.00% | 90.34% | 77.13% |
| Adadelta | 90.84% | 40.00% | 77.84% | 35.78% | |
| AdaGrad | 94.53% | 60.42% | 85.23% | 60.67% | |
| RMSProp | 95.12% | 75.47% | 89.20% | 73.71% | |
| SGD | 67.71% | 86.25% | 76.14% | 54.24% |
We can see from the table that by using Adam optimizer, class A can achieve best performance at 92.00%, 96.83%, 95.45% and 88.83% for Sen, Spec, Acc, and MCC, respectively. Similarly, when applied Adam optimizer, class C also reaches the best performance at 93.22%, 82.76%, 89.77% and 76.68%. Finally, class B obtains 93.75%, 83.33%, 85.23% and 64.47% with SGD optimizer.
3.3 Different optimizers with PSSM features combined with amino acid index features
We further added 20 topmost amino acid indexes (AAindex, Supplementary Table S2) (Tomii and Kanehisa, 1996) selected using fisher score or F-score (Supplementary Material, Formula S1) and used as an additional feature set in the dataset. We increased the number of feature from 400 to 420 in the dataset. Table 3 shows the predictive performance of DeepEfflux with five different optimizers on PSSM + AAIndex dataset. Similarly, best optimizer results for each class are highlighted in bold.
Performance comparison of our model with QuickRBF classifier
| Method | Data | Sen | Spec | Acc | MCC |
|---|---|---|---|---|---|
| QuickRBF classifier (5-fold cross validation) | |||||
| PSSM | Class A | 95.14% | 96.54% | 95.92% | 91.88% |
| PSSM | Class B | 94.99% | 86.63% | 91.13% | 82.25% |
| PSSM | Class C | 92.96% | 94.27% | 93.68% | 87.40% |
| PSSM+Aaindex | Class A | 97.14% | 95.11% | 96.18% | 92.40% |
| PSSM+Aaindex | Class B | 91.60% | 91.65% | 91.67% | 83.36% |
| PSSM+Aaindex | Class C | 95.04% | 94.77% | 94.95% | 89.92% |
| 2 Dimensions CNN model (5-fold cross validation) | |||||
| PSSM | Class A | 99.48% | 96.44% | 98.03% | 96.10% |
| PSSM | Class B | 100.00% | 91.02% | 97.34% | 93.64% |
| PSSM | Class C | 89.90% | 99.19% | 94.97% | 90.14% |
| PSSM+Aaindex | Class A | 99.48% | 97.57% | 98.55% | 97.13% |
| PSSM+Aaindex | Class B | 100.00% | 95.12% | 98.47% | 96.46% |
| PSSM+Aaindex | Class C | 92.97% | 99.18% | 96.26% | 92.64% |
| QuickRBF classifier (independent testing data) | |||||
| PSSM | Class A | 86.00% | 94.44% | 92.05% | 80.44% |
| PSSM | Class B | 91.18% | 80.99% | 82.95% | 60.61% |
| PSSM | Class C | 92.56% | 74.55% | 86.93% | 68.97% |
| PSSM+Aaindex | Class A | 89.58% | 97.66% | 95.45% | 88.43% |
| PSSM+Aaindex | Class B | 93.10% | 85.71% | 86.93% | 65.65% |
| PSSM+Aaindex | Class C | 95.12% | 75.47% | 89.20% | 73.71% |
| 2 Dimensions CNN model (independent testing data) | |||||
| PSSM | Class A | 92.00% | 96.83% | 95.45% | 88.83% |
| PSSM | Class B | 93.75% | 83.33% | 85.23% | 64.47% |
| PSSM | Class C | 93.22% | 82.76% | 89.77% | 76.68% |
| PSSM+Aaindex | Class A | 89.36% | 98.45% | 96.02% | 89.72% |
| PSSM+Aaindex | Class B | 76.92% | 96.32% | 94.89% | 66.64% |
| PSSM+Aaindex | Class C | 95.04% | 80.00% | 90.34% | 77.13% |
Note: Better model results are highlighted in bold.
According to the results in Table 3, by adding 20 new features, DeepEfflux can obtain higher performance. More specifically, the performance reaches the highest Sen (89.36%), Spec (98.45%), Acc (96.02%), and MCC (89.72%) for class A using Adam Optimizer. Class B achieves Sen (76.92%), Spec (96.32%), Acc (94.89%), and MCC (66.64%) with Adam optimizer, and performance of Sen (95.04%), Spec (80.00%), Acc (90.34%), and MCC (77.13%) are obtained for class C using Adam optimizer. When compared to the previous model (PSSM only), we found that we had increased the accuracy from 95.45% to 96.02% for class A, 85.23% to 94.89% for class B and 89.77% to 90.34% for class C. We also compared the Matthews’s correlation coefficient values for each class. The result shows that we had increased the MCC value from 88.83% to 89.72% for class A, 64.47% to 66.54% for class B and 76.68% to 77.13% for class C.
3.4 N-fold cross validation and independent test
In statistical prediction, the following three cross-validation methods are often used to examine a predictor for its effectiveness in practical application: independent dataset test, subsampling or K-fold cross-validation test and jackknife test (Chou and Zhang, 1995). However, of the three test methods, the jackknife test is deemed the least arbitrary that can always yield a unique result for a given benchmark dataset as elaborated in Chou (2011) and demonstrated by equations.28–30 therein. Accordingly, the jackknife test has been widely recognized and increasingly and used by investigators to examine the quality of various predictors (see, e.g.Chen et al. 2013; Lin et al., 2014; Dehzangi et al., 2015; Khan et al., 2015; Liu et al., 2015; Xiao et al., 2015; Liu et al., 2016; Chen et al., 2016; Jia et al., 2016a; Jia et al., 2016b; Jia et al., 2016c; Liuet al., 2017a; Cheng et al., 2017; Feng et al., 2017; Liu et al., 2017c; Liu et al., 2018). However, to reduce the computational time, we adopted the 5-fold cross validation and independent dataset test in this study as done by many investigators with SVM or Neural Networks as the prediction engine.
Based on the results mentioned in Sections 3.2 and 3.3, Adam optimizer has been chosen as the best optimizer for our model. We used default learning rate (float, default = 0.001 step size) and tried various number of iterations from 100 to 200 during the experiment. Furthermore, using independent testing data, we test how accurate our model can predict new sample data and then compared the results with QuickRBF classifier, as detailed below.
Table 4 shows the performance comparison of DeepEfflux with QuickRBF classifier in 5-fold cross-validation and independent test. We can see from the table that our proposed 2D CNN model can achieve higher results in both 5-fold cross validation approach and independent test approach. In more details, DeepEfflux can obtain accuracy of 98.55%, 98.47% and 96.26% for class A, B and C, respectively. These results are 2.37%, 6.80% and 1.31% higher than those of QuickRBF. Regarding independent test result, DeepEfflux also outperforms QuickRBF with accuracy of 96.02%, 94.89% and 90.34% for class A, B and C, respectively, which are 0.57%, 7.96% and 1.14% higher than the accuracies of QuickRBF. Similarly, we also compared the Matthews’s correlation coefficient values for each class in independent testing data evaluation. We found that MCC results of DeepEfflux (89.72%, 66.64% and 77.13%) were higher compared to QuickRBF (88.43%, 65.65%, and 73.71%) for class A, B and C, respectively.
4 Conclusion
One of efflux superfamily, ABC transporters, can be exploited by resistant cells to eject cytotoxic drugs that usually enter the cell by passive diffusion. On the other hand, MATE family equally functions as drug/sodium or proton antiporters. Prediction of efflux protein families involved in transport process of compounds is critical for understanding family structure, function and energy dependency of efflux family of active transporters. Although many methods have been proposed to classify transporters from membranes, target transport or proteins of compound carriers or even binding sites of proteins transport, pump specifics of efflux protein families, which in fact are similar to those of membrane layer in protecting cells from undesirable compounds or extrusion of foreign chemicals, were not taken into account. Moreover, as we can see from the analysis of significant motifs, efflux protein families have high degree of similarity in structure, and this will affect the classification process. Accordingly, the predictive model must recognize the hidden features to productively classify the efflux protein families, so their structures, functions and energy dependencies can be disclosed.
The 2D CNN is an important type of deep learning model consisting of a convolution kernel and a filter being a set of motif detectors that can learn from the data. By utilizing 2D CNN, we tried to capture meaningful motif features and even hidden features by scanning sequences around the target residue. The result of independent test shows that our prediction model performance exceeds that of traditional machine learning algorithm with accuracy of 96.02%, 94.89% and 90.34% for class A, B and C, respectively. These results were even enhanced by utilizing the combination of PSSM and AAIndex properties. This proves that DeepEfflux can capture important motifs of efflux protein sequences in particular and in other types of protein in general. For this reason, our proposed model can be served as a reliable tool for prediction efflux protein families which helps biologists understand more about their structures as well as their functions. We have developed a web server, which is available at: http://140.138.155.216/deepefflux/ to provide service to the scientific community.
Funding
Publication charges for this article were funded by Ministry of Science and Technology, Taiwan, R.O.C. under Grant no. MOST 106-2221-E-155-068.
Conflict of Interest: none declared.
References

