


Abstract
Recently many studies showed single nucleotide polymorphisms (SNPs) affect gene expression and contribute to development of complex traits/diseases in a tissue context-dependent manner. However, little is known about haplotype’s influence on gene expression and complex traits, which reflects the interaction effect between SNPs.
In the present study, we firstly proposed a regulatory region guided eQTL haplotype association analysis approach, and then systematically investigate the expression quantitative trait loci (eQTL) haplotypes in 20 different tissues by the approach. The approach has a powerful design of reducing computational burden by the utilization of regulatory predictions for candidate SNP selection and multiple testing corrections on non-independent haplotypes. The application results in multiple tissues showed that haplotype-based eQTLs not only increased the number of eQTL genes in a tissue specific manner, but were also enriched in loci that associated with complex traits in a tissue-matched manner. In addition, we found that tag SNPs of eQTL haplotypes from whole blood were selectively enriched in certain combination of regulatory elements (e.g. promoters and enhancers) according to predicted chromatin states. In summary, this eQTL haplotype detection approach, together with the application results, shed insights into synergistic effect of sequence variants on gene expression and their susceptibility to complex diseases.
The executable application ‘eHaplo’ is implemented in Java and is publicly available at http://grass.cgs.hku.hk/limx/ehaplo/.
Supplementary data are available at Bioinformatics online.
1 Introduction
The development of high throughput technologies has stimulated comprehensive surveys on genome-wide gene expression and DNA variation for disentangling the genetic architecture of human diseases. The genetics of transcript abundance has been extensively investigated through genome-wide gene expression studies (Ahuja et al., 2016; Edwards et al., 2013). These studies demonstrated that, for a large fraction of genes, gene expression is influenced by single nucleotide polymorphisms (SNPs) located in the vicinity of the regulated loci, named as expression quantitative trait loci (eQTLs), generally referred as cis eSNPs (Garnier et al., 2013). The importance of cis eSNPs would be enhanced if they were also associated with a disease, as such data would indicate that the associated gene is a candidate for the disease (Nica and Dermitzakis, 2008). Recent eQTL studies have extended the focus from SNPs to other type of variations, including bi-allelic indels, copy number variations (CNVs) and short tandem repeats as determinants of gene expression (Encode Project Consortium, 2012; Grundberg et al., 2012; Gymrek et al., 2016; Lappalainen et al., 2013; Montgomery et al., 2013; Stranger et al., 2007). Meanwhile, many eQTL studies showed significant contribution of tissue specific eQTLs to common disease heritability (GTex Consortium, 2015; Torres et al., 2014). An eQTL study between blood and brain also found some of the tissue specific eQTLs were associated with related traits (Hernandez et al., 2012). These studies showed the promise of tissue specific eQTLs for the characterizing functional sequencing variation and for interpreting statistic associations of genome-wide association studies (GWAS).
Haplotype, which refers to certain combination of multiple SNP alleles, is often used to explore synergistic or non-additive effects among multiple SNPs. Although methods based on individual SNPs have led to many significant findings in GWAS, haplotype-based methods will be an complementary way to explore extra genetic factors contributing to a disease (Liu et al., 2008). Many GWAS and region-specific association studies have shown the power of haplotype by increasing the amount of explained disease risks and identifying additional disease susceptibility genes (Khankhanian et al., 2015; Solovieff et al., 2014). However, few studies have extended the application of haplotype into eQTL analysis. A gene expression study on HapMap data showed that samples with certain haplotypes tagged by four SNPs located in two enhancers had significantly higher gene expression, while this effect was vanished in single SNP analysis (Corradin et al., 2014).
On the other hand, cis-regulatory sequences, such as enhancers and promoters, control development and physiology by regulating gene expression (Wittkopp and Kalay, 2012). Recently, progress has been made on predicting regulatory potential at non-coding sequencing variants in high throughput sequencing studies (Li et al., 2016). Li et al. adopted tissue and cell-type specific epigenomic data to score regulatory variants; and found that the regulatory scores when used as weights substantially improved power of gene-based association analysis (Li et al., 2017). Therefore, prior regulatory predictions may be a valuable resource for effectively selecting functional variants to reduce the computational burden in haplotype analysis.
In this study, we proposed a regulatory region guided approach for detecting eQTL haplotypes on whole genome level. In addition, we utilized this approach to comprehensively explore genome-wide cis-eQTL haplotypes in 20 tissues with the genotype and expression data from Genotype-Tissue Expression Project (GTEx; GTex Consortium, 2015). Furthermore, we also examined their enrichment of regulatory functional elements derived by chromatin states, and investigated their association with complex diseases and traits in a tissue specific manner.
2 Materials and methods
2.1 The proposed regulatory region guided eQTL haplotype analysis method
Here, we propose a regulatory region guided eQTL haplotype analysis method. This approach is made up of three steps. Firstly, the regulatory scores on non-coding variants are utilized to predict regulatory regions. Secondly, common haplotypes formed by SNPs that located in the predicted regulatory regions are explored. Finally, the association of the haplotypes with gene expression is examined and the significance is corrected by an estimation of ‘effective number’ of tests performed in each gene. The public data used and the key steps of the proposed approach are illustrated in Figure 1.
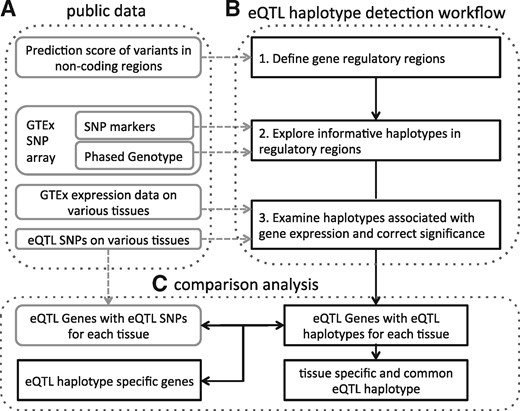
Overview of the proposed eQTL haplotype detection approach. (A) The public data used for the eQTL haplotype detection workflow. (B) The workflow of the proposed approach in Section 2.1. (C) The comparison analysis performed of the eQTL haplotypes as described in Section 2.2
2.1.1 Define gene regulatory regions according to prediction score of variants in non-coding regions
2.1.2 Explore informative haplotypes in regulatory regions
The second step is to explore informative haplotypes in the above regulatory regions. All coding genes in RefGene are selected for analysis. For each gene, a variant is considered as potential tag SNPs for eQTL haplotypes of the gene if it is: (i) located in critical regulatory regions defined above, and (ii) within 1 Mb upstream or downstream from the gene coding regions and (iii) with minor allele frequency higher than 0.05.
When the number of haplotypes in the working group reached the preset threshold (10 000 as default), the haplotype extension step stops and all obtained haplotypes, except the single allele haplotypes (such as a1,A1), are added to an overall haplotype group Hall for further analysis.
The above steps are defined as a single window analysis. The working group is cleared for the next single window analysis. If the number of variants in previous window is n and the index of the last variant is l, the index of the first variant in next window analysis would be .
After all variants were analyzed in window analysis, duplicated haplotypes in Hall will then be removed. Haplotypes are considered as redundant haplotypes if any combination of its tag SNP alleles (defined as sub-haplotype) has r2 (Coefficient of determination) higher than 0.8 between the two haplotypes. To exclude redundant haplotypes, each haplotype in Hall would be checked if any of the sub-haplotype was also in Hall and with r2 higher than 0.8. All the remaining haplotypes with frequency higher than threshold are considered as informative haplotypes and are stored in the overall haplotype group Hall for further analysis.
2.1.3 Examine haplotypes associated with gene expression and correct significance by an estimation of effective number
The testing of a large number of haplotypes needs to be taken into account in the interpretation of statistical significance for each gene, but this is complicated for the non-independence of haplotypes because of linkage disequilibrium. A correction of multiple testing by the number of haplotypes through the Bonferroni approach will produce conservative P-values. Therefore, we adopt an effective number of independent tests estimator (Li et al., 2012b) we proposed previously to adjust the multiple testing issue. The estimator uses genotype correlation to approximate the effective number of independent tests. The effective number of independent test is smaller than the actual number of tests when genotypes are correlated. For each haplotype, genotypes are encoded by the counts of the haplotype at every subject. The genotype correlation matrix of all haplotypes is calculated by Pearson correlation method. The effective number of independent tests (me) is approximated by Li et al. (2012b) with the usage of genotype correlation matrix.
As the haplotype analysis is designed to find synergistic effect, haplotypes with association P-value higher than 0.05*P-value of any of its tag SNPs are removed. The approach has been implemented in the programming language Java. The executable application and example data can be accessed at http://grass.cgs.hku.hk/limx/ehaplo/.
2.2 eQTL haplotype analysis for GTEx data
Fully processed, normalized and filtered gene expression data from 8555 samples across 55 tissues and phased genotype data of the corresponding 450 individuals were obtained from GTEx v6 through dbGap authorized access. Individual genotype and expression data from top 10 sample size tissues, ranging from 241 to 385, together with all 10 brain tissues with sample size ranging from 83 to 113, were used for eQTL haplotype analysis. GTEx eQTL SNPs were collected from GTEx public release (http://www.gtexportal.org/home/datasets) for comparison, which used the FastQTL (http://fastqtl.sourceforge.net/) to handle the multiple testing issues. After the eQTL haplotype analysis, number of genes having eQTL SNPs, eQTL haplotypes and both were counted for all 20 tissues.
For each pair of tissues, their eHap genes were compared and the number of the eHap genes that only showed in one of the tissue pairs was counted as its specific eHap genes. The average number of specific eHap genes for the 19 comparisons of each single tissue was calculated and compared with its number of eHap genes as the average percent of tissue specific genes of each tissue. For instance, all genes with eQTL haplotypes from whole blood were compared with skeletal muscle and the fraction of them that are not in skeletal muscle is therefore calculated. By comparing to other 19 tissues individually, the 19 fractions were calculated and the average number of is named as ‘percentage of tissue specific eQTL genes’ for whole blood.
3 Results
3.1 Systematic eQTL haplotype identification in GTEx data significantly expanded tissue specific eQTL genes in different tissues
We first systematically investigated the existence of the eQTL haplotypes in a series of tissues with a proposed regulatory region guided eQTL haplotype approach (See details in Section 2). GTEx project (GTex Consortium, 2015) provided excellent resources for this purpose, in which there are genotypes and gene expression data of 8555 samples of 450 individuals, crossing 55 tissues. The top 10 sample size tissues and 10 brain tissues were used for tissue specific analysis, which took around 2 h for each tissue on an ordinary workstation (3.2 GHz CPU, 16 GB RAM, Supplementary Result S7). Genes with eQTL SNPs in all these tissues were collected from GTEx public release (v6). The critical regulatory regions were obtained according to integrative regulatory scores compiled from eight different tools in non-coding regulatory variants by a composite model (Li et al., 2016), which consist of 3.8% of the whole genome (see details in Section 2). As a result, 540 455 SNPs located in the critical regulatory regions were selected out of 14 354, 092 SNPs from the GTEx project. After eQTL haplotype detection on the selected SNPs and gene expression of the GTEx samples, the number of genes with eQTL markers (SNPs and haplotypes) increased remarkably. The average number of genes with eQTL haplotypes (eHap genes) in the top 10 tissues was 1799, ranging from 1547 to 2372. Among these genes, on average, 601 genes have no eQTL SNPs at all. The number of eHap genes accounted for 18% of all the genes with eQTL markers (eGenes) on average, including SNPs and haplotypes. In the other hand, the average number of eQTL haplotypes in all 10 brain tissues was 1125, and explained 36% of the eGenes. By pairwise tissue comparison (Section 2), the average fraction of tissue specific eHap genes account for 81% of all eHap genes in each tissue, suggesting the high influence of sequence variation on genes varies from tissue to tissue (Table 1, Fig. 1C).
Summary of (A) GTEx top 10 sample size tissues and (B) Ten brain tissues
| Sample size | eSNP gene | eHap gene | All eGene | eHap gene / all eGene | eHap only gene | Avg.% TS eHap gene* (%) | |
|---|---|---|---|---|---|---|---|
| (A) GTEx top 10 sample size tissues | |||||||
| Muscle skeletal | 361 | 7079 | 1628 | 7670 | 19 | 591 | 80 |
| Whole blood | 338 | 6782 | 2372 | 7517 | 26 | 735 | 85 |
| Skin sun exposed | 302 | 8558 | 2023 | 9288 | 19 | 730 | 82 |
| Adipose subcutaneous | 298 | 8493 | 1648 | 9013 | 16 | 520 | 79 |
| Transformed fibroblasts | 292 | 8751 | 1547 | 9206 | 15 | 455 | 81 |
| Artery tibial | 285 | 8050 | 1881 | 8744 | 19 | 694 | 81 |
| Lung | 278 | 7224 | 1553 | 7869 | 18 | 645 | 79 |
| Thyroid | 278 | 9916 | 1887 | 10 435 | 16 | 519 | 80 |
| Nerve tibial | 256 | 9849 | 1859 | 10 370 | 16 | 521 | 80 |
| Esophagus mucosa | 241 | 7411 | 1588 | 8006 | 18 | 595 | 81 |
| Top 10 tissue average | 293 | 8211 | 1799 | 8812 | 18 | 601 | 81 |
| (B) Ten brain tissues | |||||||
| Brain cerebellum | 103 | 4162 | 1667 | 4728 | 29 | 566 | 81 |
| Brain caudate basal ganglia | 100 | 2446 | 1226 | 3107 | 33 | 661 | 83 |
| Brain cortex | 96 | 2566 | 1360 | 3279 | 35 | 713 | 78 |
| Brain nucleus accumbens basal | 93 | 2017 | 1046 | 2600 | 34 | 583 | 80 |
| Brain_Frontal_Cortex_BA9 | 92 | 2008 | 971 | 2548 | 33 | 540 | 81 |
| Brain cerebellar hemisphere | 89 | 3249 | 1342 | 3823 | 29 | 574 | 79 |
| Brain Putamen basal ganglia | 82 | 1588 | 1033 | 2234 | 39 | 646 | 82 |
| Brain hippocampus | 81 | 1134 | 893 | 1765 | 44 | 631 | 80 |
| Brain hypothalamus | 81 | 1157 | 871 | 1731 | 43 | 574 | 83 |
| Brain anterior cingulate cortex | 72 | 1211 | 837 | 1762 | 41 | 551 | 79 |
| Ten brain tissue average | 89 | 2154 | 1125 | 2758 | 36 | 604 | 81 |
Note: *Average fraction of the tissue specific (TS) genes with eQTL haplotypes. The number is calculated by comparing the eGenes in the tissue with other 19 tissues individually.
To investigate the basic properties of eQTL haplotypes, all eQTL haplotypes identified in whole blood from GTEx data were collected for further detailed analysis. In total 12 954 eQTL haplotypes of 2372 genes were identified. The average number of tag SNPs in these eQTL haplotypes was 4.5, ranging from 2 to 9, while the expanding range of the tag SNPs within the haplotypes (length of the haplotype) was 207 kb by average, ranging from 1.58 Mb to 36 bp. Given so large distance, there were originally many SNPs and many more potential haplotypes tagged by these SNPs. The regulatory region guided approach substantially reduced the number of candidate haplotypes and made the identification of eQTL haplotype with such long length possible. The frequency threshold of the eQTL haplotype identification was set as >0.05 in this analysis, while the median frequency was 0.233. The fraction of eQTL haplotypes with frequency higher than 0.1, 0.2 and 0.3 were 76%, 46% and 25%. The median P-value of the eQTL haplotypes was 3.17 × 10⁻⁷, ranging from 1.73 × 10⁻⁵ to 2.22 × 10⁻¹⁶.
3.2 Exploration on eQTL haplotypes located chromatin states identified interaction enrichment in particular chromatin states pairs
The next interesting question is what types of functional elements support the interaction of variants on the eQTL haplotypes. To answer this question, we utilized a set of fully processed finely-mapped chromatin states obtained from ENCODE, which were learned by integrating ChIP-seq data from nine cell lines using a Hidden Markov Model (ChromHMM; Ernst and Kellis, 2012). All eQTL haplotypes identified in whole blood from GTEx data and eight major chromatin states from human blood cell line (GM12878) were selected for the analysis, including active, weak and inactive promoters, strong and weak enhancers in upstream or downstream of genes and insulators (Supplementary Method S1). Therefore, there are 36 pairwise combinations. For each eQTL haplotype, all SNP located in the eight chromatin-state regions were collected and each SNP pairs were allocated in one of the 36 state combinations. Within all the eQTL haplotypes, 67 270 SNP pairs were identified in all 12 954 whole blood eQTL haplotypes, while majority states of the involved SNPs were annotated as strong (20%), weak promoters (20%) and upstream strong enhancers (26%). By calculating the expected number of all combinations under random distribution, and the actual number of SNP pairs for each state combinations, the enrichments of all pairwise combinations were calculated as the ratio of the observed value and expected value, and the corresponding P-values were calculated by chi-square test, respectively.
The result of this analysis on whole blood eQTL haplotypes and blood cell chromatin states showed that they were not equally distributed. Some state combinations are enriched in haplotype eQTLs more often than expected by random. Specifically, nine combinations of regulatory elements were significantly positively enriched in eQTL haplotypes (ratio > 1.2 and P < 10−5) and two combinations were negatively enriched (ratio < 0.8, and P < 10−5), out of all 36 combinations. Individually, the most significant positively enriched combinations were strong promoter and weak promoter pair, with ratio of 1.91 and P-value of 3.1 x 10⁻¹³, followed by insulator-insulator pair (1.57, 3.1 x 10⁻¹³), upstream with downstream strong enhancer pair (1.54, 3.1 x 10⁻¹³) and upstream weak with downstream strong enhancer pair (1.54, 3.1 x 10⁻¹³; Table 2A). Collectively, 3’ and 5’ strong enhancer participated in five significant combinations, suggesting the strong enhancer may be a dominant player of synergistic effect on eQTL haplotypes. The active promoter participated in three of the nine combinations.
The enrichment of the chromatin states between the tag SNPs in eQTL haplotypes
| Chromatin state | Active promoter | Weak promoter | Inactive promoter | Strong enhancer 5’ | Strong enhancer 3’ | Weak enhancer 5’ | Weak enhancer 3’ | Insulator |
|---|---|---|---|---|---|---|---|---|
| (A) Chrome state enrichment ratio for eQTL haplotypes derived from whole blood. | ||||||||
| ratio(–log(P)) | ||||||||
| Active promoter | 1.02 | |||||||
| Weak promoter | 1.91 (12.47) | 1.21 (12.47) | ||||||
| Inactive promoter | 0.55 (6.09) | 0.61 | 0.68 | |||||
| Strong enhancer 5’ | 1.24 (12.47) | 1.07 | 1.43 (8.72) | 1.22 (12.47) | ||||
| Strong enhancer 3’ | 0.84 | 0.85 | 1.15 | 1.54 (12.47) | 1.27 | |||
| Weak enhancer 5’ | 0.77 (12.47) | 0.79 (11.22) | 1.18 | 0.96 | 1.54 (12.47) | 0.74 (7.19) | ||
| Weak enhancer 3’ | 0.79 (11.65) | 0.58 (12.47) | 1.31 | 1.06 | 0.86 | 1.15 | 1.19 | |
| Insulator | 1.41 (12.47) | 1.18 | 0.71 | 1.09 | 0.77 | 0.98 | 0.64 (9.86) | 1.57 (12.47) |
| (B) Chrome state enrichment ratio for eQTL haplotypes derived from all brain tissues. | ||||||||
| Active promoter | 1.07 | |||||||
| Weak promoter | 1.45 (12.47) | 1.05 | ||||||
| Inactive promoter | 0.77 | 1.18 | 1.32 | |||||
| Strong enhancer 5’ | 1.28 (12.47) | 1.05 | 1.04 | 1.25 (12.47) | ||||
| Strong enhancer 3’ | 1.01 | 1.17 (6.61) | 0.74 | 1.36 (12.47) | 1.13 | |||
| Weak enhancer 5’ | 0.93 | 0.94 | 1.05 | 0.99 | 1.06 | 1 | ||
| Weak enhancer 3’ | 1.04 | 0.83 (10) | 1.19 | 1.02 | 0.85 | 1.14 | 1.12 (10.28) | |
| Insulator | 1.12 | 1.35 (12.47) | 0.94 | 0.98 | 0.61 (11.73) | 0.96 | 0.94 | 1.38 (5.86) |
Note: The chromatin states were annotated by Chrom-HMM based on ChIP-seq data of human blood cell line (GM12878).
Significance of bold: ratio >1.2 and P<10E-5.
To further explore the conservative of these enrichments, we applied the same analysis on eQTL haplotypes from all brain tissues, which are unmatched tissues for the chromatin states from blood cell lines. Only six combinations showed significantly positively enrichment and two were negatively enriched (Table 2B). The numbers were half (8/16) of the ones from eQTL haplotypes from matched tissue (whole blood), while only five of them were occurred in the two analyses. Again the 3’ and 5’ strong enhancers are the most frequent participants in the significant combinations.
By comparing the results from the matched tissue analysis and unmatched, it strongly indicated that segments that harbor the eQTL haplotypes were strongly enriched in certain combination of the regulatory elements annotated by chromatin states, and furthermore, only half of the enrichment were conserved between tissues and the rest half were tissue specific.
4 Discussion
In this study, we proposed a regulatory region guided eQTL haplotype association analysis approach. The essentialness of the three haplotype-number-deduction steps of the approach was confirmed by comprehensive evaluation (Supplementary Results S1). By applying it to the whole-genome gene expression across multiple tissues from the GTEx project, we successfully found a non-trivial fraction of genes having significant eQTL haplotypes. The result suggests that haplotype eQTL, which can be detected by the proposed method, is an important complementary of SNP based eQTL in which the former considers synergistic effect of the later.
Moreover, we also showed that most of the genes with eQTL haplotypes (eHap gene) were tissue specific. After mapped onto regulatory functional elements, the eQTL haplotypes are overwhelmingly covered by a combination of strong enhancer and another element. Further analysis in GWAS data showed that the eQTL haplotypes also tend to have higher significant association with human complex diseases only when the eQTL’s tissues are related to the diseases (Supplementary Method S2 and Result S3).This work highlights a need for conducting haplotype-based cis eQTL analysis for various tissues and the potential of the tissue-matched eQTL haplotypes for prioritizing disease-associated loci.
To further excavate the underlying principle of the eQTL haplotypes detected by the proposed approach on GTEx dataset, we analyzed the combination of different chromatin states of the tag SNPs of the eQTL haplotypes. The expected numbers of all 36 combinations were compared with observed number in all eQTL haplotypes in GTEx whole blood, which was matching the cell type that generating the chromatin states. Interestingly, nine combinations showed significant enrichment in the observed number with large effect size. Interactions between two insulators which locates upstream and downstream of the under regulated enhancer-promoter pair have been mapped in previous studies (Cavalli and Misteli, 2013; Mora et al., 2016). In the other hand, the enrichment of the interaction between weak and strong promoters would also support the observations in previous report, showing that weak promoters conveyed significant enhancer function to their stronger interacting partners (active promoters) to control the gene expression (Li et al., 2012a; Supplementary Result S2).
To further investigate whether these enrichments were tissue specific, we further analyzed the eQTL haplotypes from GTEx brain tissues, with the chromatin states generated from blood cells, as an unmatched tissue analysis. Five out of the nine state pairs in previous matched tissue analysis still showed significant enrichment while the signals in the other four faded out. Probably, the interactions in the former five chromatin-state pairs were relatively conserved in different tissues (Table 2B). A matched analysis of the brain eQTL haplotypes on chromatin state from brain cells would better address this phenomenon but it was not available in public ChIP-seq dataset.
In summary, we proposed a regulatory region guided eQTL haplotype detection approach and successfully identified many eQTL haplotypes and genes in multiple tissues, based on the application on GTEx data. In the proof-of-principle examples, we showed variant synergistic effect on haplotypes may also play an important role in regulation of gene expression. The haplotype eQTLs can substantially extend the number of eQTLs genes. The synergistic effect may be based on a combination of certain functional elements in which the strong enhancers are heavily involved. These explorations improved our standing of the mechanism of the interaction of variants that influence gene expression and then the risk of complex diseases.
Acknowledgement
The authors thank The GTEx Consortium to provide access to both genotype and expression data on thousands of samples from various tissues.
Funding
This work was supported by Natural Science Foundation of China (31771401), Hong Kong Health and Medical Research Fund (02132236), Hong Kong Research Grants Council GRF 17128515, 17124017, 17121414 HKU 776412M and N_HKU736/14; Hong Kong Research Grants Council Theme-Based Research Scheme T12-705/11; and Hong Kong Theme-based Research Scheme T12C-714/14-R.
Conflict of Interest: none declared.
References

