


Abstract
Availability of large-scale genomic, epigenetic and proteomic data in complex diseases makes it possible to objectively and comprehensively identify the therapeutic targets that can lead to new therapies. The Connectivity Map has been widely used to explore novel indications of existing drugs. However, the prediction accuracy of the existing methods, such as Kolmogorov–Smirnov statistic remains low. Here we present a novel high-performance drug repositioning approach that improves over the state-of-the-art methods.
We first designed an expression weighted cosine (EWCos) method to minimize the influence of the uninformative expression changes and then developed an ensemble approach termed ensemble of multiple drug repositioning approaches (EMUDRA) to integrate EWCos and three existing state-of-the-art methods. EMUDRA significantly outperformed individual drug repositioning methods when applied to simulated and independent evaluation datasets. We predicted using EMUDRA and experimentally validated an antibiotic rifabutin as an inhibitor of cell growth in triple negative breast cancer. EMUDRA can identify drugs that more effectively target disease gene signatures and will thus be a useful tool for identifying novel therapies for complex diseases and predicting new indications for existing drugs.
The EMUDRA R package is available at doi: 10.7303/syn11510888.
Supplementary data are available at Bioinformatics online.
1 Introduction
Drug repositioning methods enable the discovery of novel indications for drugs whose safety and tolerability have already been demonstrated, which potentially accelerate development and delivery of new therapies while reducing costs of bringing new therapies into clinical use. Transcriptomic data of drug perturbations, such as the Connectivity Map (CMap), have been widely used to search potential novel indications by matching signatures of diseases and drugs/compounds (hereafter referred as drugs) based on gene expression changes (Hsieh et al., 2016; Lamb et al., 2006; Lee et al., 2016a). Such approaches are based on the assumption that drugs which can reverse gene expression changes in a disease would have a potential therapeutic effect on restoring the disease to a healthy condition. Moreover, in a recent dyslipidemia mouse model study, researchers tried several treatments to restore physiological markers to their baseline levels. They found that the efficacies of treatments were correlated with their reversal of gene expression abnormalities to normal levels (Wagner et al., 2015). This finding indicates that a treatment resulting in opposite transcriptomic effects could potentially reverse the clinical course of a disease.
The CMap approach utilized a nonparametric Kolmogorov–Smirnov (KS) statistic to find connections between diseases and drugs based on rankings of genes in a disease signature within the drug-perturbed expression profiles (Lamb et al., 2006). Later, Zhang et al. developed a weighted signed statistic (WSS) method (Zhang and Gant, 2008), which separated up- and down-regulated genes with opposite directions in disease signature and drug treatment signature, and then calculated the normalized inner product score for rankings of disease and drug signatures. However, rank-based approaches suffer from high false positive rates, as even genes not differentially expressed can be ranked high and contribute to the similarity measurement for drug and disease signatures. Furthermore, KS and WSS approaches would also miss many potential drugs as ranking only captured a small part of information in gene expression profile. Thus, alternative gene expression matching algorithms need be developed to better match drug and disease signatures. Recently, Cheng and Yang (2013) presented four eXtreme methods, which calculated correlation scores between disease signature and top up- and down-regulated genes in drug treatment by utilizing the sum (XSum), cosine similarity (XCos), Pearson correlation (XCor) and Spearman correlation (XSpe) measures. Nevertheless, as a drug can perturb either thousands of genes or only a few genes, the top N genes may cover only a small proportion of drug-perturbed genes or comprise a large part of genes with no change. Furthermore, the above methods may be subject to undue influence of lowly expressed genes, which are more susceptible to detection noise. Therefore, novel methods need be developed to correctly match disease- and drug-signatures.
Another challenge in developing drug repositioning approaches based on gene expression is the lack of gold standard disease and drug signatures for systematically evaluating performance of various approaches. This requires generation of expression data from the experiments using the same cell lines and the same drugs as CMap. Fortunately, the recently released library of integrated network-based cellular signatures (LINCS) (Vempati, et al., 2014) dataset is an excellent independent dataset for testing performance of methods based on the CMap data. On the other hand, drugs sharing chemical characteristics often have the similar mode of action (Iorio et al., 2010; Keiser et al., 2009) and thus have similar effects on gene expression. The fourth level codes of anatomical therapeutic chemical (ATC) classification system divide drugs into different classes according to action as well as therapeutic, pharmacological and chemical properties (Iskar et al., 2010). Therefore, the similarity between drugs sharing ATC fourth level codes can also be used for evaluating the performance of drug repositioning approaches.
A promising drug repositioning approach would provide highly confident drug-indications for experimental validation. Accordingly, the partial area under the receiver operator characteristic (ROC) curve (pAUC) with low false positive rate can be used to measure the performance of those approaches. In this study, we first developed an expression weighted cosine (EWCos) method and then integrate EWCos and three best performed existing approaches using an ensemble framework. The new and existing methods were comprehensively evaluated by several independent datasets. We further employed the best performed ensemble approach to identify the potential novel indications of existing drugs for triple negative breast cancer (TNBC) and validated a predicted drug in vitro.
2 Materials and methods
2.1 Data collection and preprocessing
CMap build 02 raw data were downloaded from the CMap website. CMap is a collection of genome-wide transcriptional expression profiles from cultured human cell lines treated with drugs or dimethyl sulfoxide (DMSO). The current version (build 02) of CMap contains more than 7056 expression profiles, including 6100 instances treated with 1309 compounds and 956 microarrays treated with DMSO. For more details, see the Supplementary Material in the original CMap study (Lamb, 2006).
The microarrays of development batches were discarded and the production batches were grouped by platform. Raw intensities were preprocessed using the robust multi-array average procedure (Irizarry, 2003[Irizarry et al., 2003 has been changed to Lamb 2006 to match the reference list. Please approve.]). Next, probe sets that don’t correspond to any gene or are unique to the HT_HG-U133A or HT_HG-U133A_EA were discarded. Expression levels of multiple probe sets matching to the same gene were averaged as expression level of that gene. Drug-induced expression changes of instances, denoted by log2 of fold changes (logFC), were generated by subtracting the average expression levels of the vehicle controls within a given batch from drug treated profiles within that batch. In total, the 5488 instances of 1191 drugs in production batches were retained for further analysis.
The ATC classification codes were obtained from the pharmaceutical benefits scheme (http://www.pbs.gov.au/browse/downloads). Only the fourth level codes were retained for further analysis. The ATC system classifies drugs into subgroups according to their chemical, therapeutic and pharmacological properties. Drugs in each fouth-level code are a subgroup of substances with similar chemical structure or a single indication.
The LINCS project (Wang et al., 2016) aims to expand the CMap by testing more representative cell lines with more perturbagens, including small-molecules, shRNA and gene overexpression. Perturbagen-induced gene expression changes were measured with the L1000 gene-expression assay that enabled data generation at a million-sample scale. In this study, normalized LINCS level three data were downloaded from the GEO database (GSE70138) (Barrett et al., 2013). The level three dataset includes the directly measured expression levels of 978 landmark genes and inferred expression levels of more than 21 K genes. Those data were then scaled using an 80-gene invariant set followed by quantile normalization.
RNA-seq v2 data of TNBC and adjacent normal were downloaded from The Cancer Genome Atlas (TCGA) data portal (The Cancer Genome Atlas Network, 2012), log2(x + 1) transformed and corrected for age, race, batch.
2.2 The KS, WSS and eXtreme methods
In the WSS method (Zhang and Gant, 2008), each gene in a query signature was weighted by the ranking of its expression change and sign (+ for up-regulation and − for down-regulation) and then WSS connection score was calculated by dot product of reference rankings and query rankings of common genes and normalized by the maximum score. The signed rankings of the production batch instances were extracted from the ssCMap (Zhang and Gant, 2009).
The eXtreme methods, including XSum, XCos, XCor and XSpe, were based on gene expression changes, i.e. logFCs, of the top 500 genes (other genes were set as 0) as suggested in a previous study (Cheng, et al., 2014; Cheng and Yang, 2013). XSum was defined as the sum of the reference FCs of the query signature genes while XCos, XCor and XSpe were computed based on logFCs of a reference profile and those of a query signature using cosine similarity, Pearson correlation and Spearman correlation, respectively.
2.3 The EWCos and EMUDRA
We first developed an EWCos method to reduce the influence of lowly expressed genes (Fig. 1A). A logistic-sigmoid function was employed to smoothly weight the RDIE changes in CMap. Let be the expression value of the gene in an RDIE profile. The weights of the gene were calculated by a logistic-sigmoid function: , where and were parameters that would be optimized and was the mean expression value across all the gene expression profiles in CMap. Weight of a lowly expressed gene was close to 0 while weight of a highly expressed gene approached 1. Next, expression-weighted logFC (EWlogFC) was calculated as: . The ranges of α and k were from 0 to 6 and from 0 to 1.5, respectively.
Workflows of EWCos (A) and EMUDRA (B). (A) To adjust the lowly expressed genes, a logistic function was used to weight drug-induced expression changes. First, weight matrices were calculated for the parameters in the function. Next, for each instance, drug-induced signatures identified from replicates were used to optimize the parameters. Finally, weighted fold changes were used to calculate EWCos scores for a given query signature. (B) Matching scores from EWCos, Cosine, XCor and XSpe were normalized and combined to obtain an ensemble score to rank order drugs. GO enrichment analysis was performed on the signature gene sets reversed by the top drugs
We optimized the parameters of the logistic-sigmoid function for each instance in CMap by utilizing the drug-induced signatures identified from its replicates. Specifically, we first calculated a weighted reference logFC matrix for each α-k combination and then used the drug-induced signatures from the corresponding replicates as query signatures to calculate matching scores. Then, for each instance, we calculated its ranking among all the instances in CMap using the combined signatures identified from its replicate instances for query. Finally, the parameter combination that resulted in the best ranking was defined as the optimal parameters for the instance that were further used for computing the final weights. Final weights of all the references were combined accordingly to the matrix W. EWCos score was cosine similarity between the logFC vector of a query signature and the EWlogFC matrix.
To take the advantage of the multiple complementary drug repositioning methods, we further developed an ensemble approach termed ensemble of multiple drug repositioning approaches (EMUDRA) to combine the matching scores from the best performed approaches including EWCos, Cosine, XSpe and XCor (Fig. 1B). Matching scores from each method were first normalized and then the normalized scores from the four methods for each for each reference instance were combined into a single similarity score. As random signatures were not supposed to be associated with a query signature, matching scores would have approximately normal distribution after excluding outliers (see the Supplementary Material). Let Q1 and Q3 be the lower and upper quartile of a score list l, respectively. The interquartile range (IQR) was defined as (Q3 – Q1). The scores outside the range of were removed to derive a new score list . The normalized scores for the list l were calculated based on the mean µ() and the standard deviation σ(). EMUDRA score was the sum of the four normalized matching scores: , where was a list of matching scores calculated by the method i (i = 1, 2, 3, 4).
2.4 Signature identification
For each instance in CMap, one-sample t-test was used to calculate P-values through the comparison of the expression levels of an RDIE profile with six vehicle controls in the same batch. After correcting P-values for multiple comparisons by the Benjamini–Hochberg (BH) procedure (Benjamini and Hochberg, 1995), a drug-induced signature was identified using the thresholds of multiple testing corrected P-value less than 0.05 and absolute logFC larger than log2(1.2) or smaller than -log2(1.2). For several CMap instances with few or no genes passing the thresholds, the top 100 most significant up-regulated genes and the top 100 down-regulated genes were taken as their signatures.
To test the performance of all the above mentioned methods in an independent dataset, the drug-induced signatures were identified from the LINCS dataset as the positive control of their counterparts in CMap. As each cell line was treated with each drug in six different concentrations in more than a dozen batches, those profiles were treated as replicates and put together to identify one high quality drug-induced signature for each cell-line-drug combination. Welch's t-test was utilized to calculate P-values between drug-induced profiles and vehicle controls from the same batch. P-values were corrected using the BH procedure. Drug-induced signatures were identified using the same thresholds for identifying signatures for each CMap instance. Additionally, the signature of TNBC was identified by the limma R package (Ritchie et al., 2015) through comparing the TNBC samples with the matched adjacent normal samples in TCGA.
2.5 Gene ontology enrichment analysis
To explore biological functions of the genes that were dysregulated in disease and potentially restored by predicted drugs, we performed gene ontology (GO) enrichment analysis (Ashburner et al., 2000) to characterize the biological processes that were targeted by the top ranked drugs. The analysis was based on the Bioconductor packages GO.db and org.Hs.eg.db (Gentleman et al., 2004). Enrichment P-values were calculated by the hypergeometric test and corrected by the Benjamini–Yekutieli procedure as the annotation dependence of the GO database (Benjamini and Yekutieli, 2001).
2.6 Performance evaluation and partial AUC
To systematically evaluate the performance of EWCos and EMUDRA as well as the existing state-of-the-art approaches, we used three simulated datasets, the LINCS dataset and the ATC drug classification system.
The simulated dataset was generated by adding random noise to the original CMap expression data to generate noisy signatures. Let g be the original expression of a given gene. Then, the noised expression level of the gene is: , where τ is a random number generated from an uniform distribution and s is a non-negative constant. A signature was then identified as described in the section of signature identification and used as a query signature to calculate matching scores. Instances treated with the same drug were taken as positive cases to evaluate performance of the drug repositioning methods.
For the ATC drug classification system, a score between a drug pair A and B was calculated as: , where was the mean matching score between A and B for a query signature induced by B and was the mean similarity score between A and B for a query signature induced by A. To calculate (p)AUC for performance evaluation, a pair of drugs sharing at least n (n = 1, 2) ATC code(s) were defined as a positive case while a drug pair sharing less than n (n = 1, 2) ATC code(s) were considered as a negative case.
For the LINCS dataset, the instances treated with the same drug that induced a given signature in CMap were considered as positive cases while the other instances were taken as negative cases. Scores calculated from all the signatures were compiled to obtain a comprehensive pAUC and a whole AUC. ROC curves and (p)AUC were visualized and calculated using the pROC package (Robin et al., 2011). Significance of comparing two (p)AUCs was estimated by bootstrapping with 1000 iterations (Robin et al., 2011).
2.7 In vitro validation
For 3 D cultures, MDA-MB-231 cells were seeded at a density of 3000 cells per well on matrigel-coated chamber slides. Cells were treated every 24–48h, beginning at the time of seeding, with 0.4% DMSO or 1uM, 4.8uM, or 25uM rifabutin (Sigma). For each well, two photographs were taken daily to document cell growth. As cells grew, progressively more area of an image was occupied by cells. To quantify differences in cell growth between DMSO- and rifabutin-treated cells, we used ImageJ version 1.47 with default settings to measure the proportional area of a bright-field 5× field that contained cells. Within each day, proportional cellular area differences between DMSO- and rifabutin-treated conditions, measured with at least four fields each from four independent experiments, were tested for significance using a one-tailed t-test. Cell number was also quantified on Day 7 after treatment with 0.4% DMSO, rifabutin (6uM, 12uM, 25uM or 50uM) or taxol (0.75 nm, 1.5 nm, 3 nM) using CellTiter-Glo 3 D (Promega) according to the manufacturer’s instructions on a SpectraMax M5 plate reader with a 1 s integration time.
3 Results
3.1 Performance assessment by simulation studies
We designed several simulation studies with ground truth to evaluate the performance of EWCos, EMUDRA and the existing seven methods. For each instance in CMap, a drug-induced signature was identified by comparing drug- and vehicle-treated gene expression profiles. Each drug-induced signature was then used as a query set to calculate enrichment/matching scores by each method. For each the query set of a drug, the instances treated with the same drug were taken as positive cases and those from different drugs as negative ones. Finally, the scores from all query sets were used to generate a comprehensive pAUC for each method. As shown in Figure 2A, EMUDRA had the best performance among all the methods. The pAUC of EMUDRA was 0.0054 at a false positive rate (FPR) of 0.01, which was significantly better than the KS (pAUC = 0.0048, P = 4.52 × 10⁻¹⁰) and XCos (pAUC = 0.0039, P = 2.81 × 10⁻²⁸) as well as all the other methods (P < 0.01).
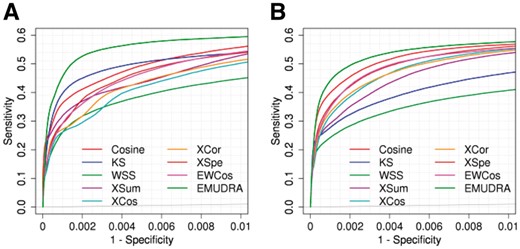
Evaluation of EWCos, EMUDRA and the existing methods based on simulation studies. (A) For each instance, a drug-induced gene signature was identified based on treatment and the corresponding controls, which was used to query the CMap data by each method. Instances treated with the same drug of a query signature were considered as positive cases and other instances were used as negative. Performance was evaluated by ROC curves and pAUC at false positive rate 0.01. (B) Performance for simulated data with random noise from a uniform distribution
We also tested the nine methods in a simulated dataset which was generated by adding random values to the gene expression profiles in CMap (the details are provided in Section 2). EMUDRA with a pAUC of 0.0052 at FPR <0.01 performed significantly better than KS (pAUC = 0.0038, P = 6.67 × 10⁻²⁶), XCos (pAUC = 0.0046, P = 1.31 × 10−09) and other methods (pAUC ≤ 0.0050, P < 0.008) (Fig. 2B).
Notably, EMUDRA was the best approach when evaluated by either the whole AUC or the pAUC at FPR less than 0.1 (Supplementary Figs S1 and S2). For instance, in the simulation study, EMUDRA gave rise to pAUC of 0.0619 at FPR of 0.1 and significantly outperformed KS (pAUC = 0.0560, P = 1.22 × 10−09), XCos (pAUC = 0.0604, p = 0.002) and other methods (P < 0.01) (Supplementary Fig. S2). We further designed two other simulation studies with increased noise. Although the pAUCs of all the approaches decreased as the noise level increased, EMUDRA consistently showed the best performance (Supplementary Fig. S3). In summary, EMUDRA outperformed all the other methods in our comprehensive simulation studies.
3.2 Performance assessment by sharing ATC codes and the LINCS dataset
To further assess the performance of these methods trained by CMap, we tested their capability of predicting the drug pairs sharing ATC fourth level codes and positive control drugs that were also tested in the LINCS dataset. The drugs sharing ATC fourth level codes have similar chemical, therapeutic and pharmacological properties and hence may target common molecular pathways. Therefore, we can identify drugs sharing ATC fourth level codes by matching their gene signatures. In addition, a drug’s signature identified from the LINCS dataset can be used as positive controls for those signatures from the same drug tested in CMap.
In CMap, 1864 drug pairs involving 658 unique drugs shared at least one ATC code. Thus, these pairs were taken as positive cases while all the rest 214 289 drug pairs that did not share any ATC code were taken as negative ones. Then, each of the signatures from the 658 unique drugs was used as a query set to calculate matching scores against all the rest drugs by each method. The positive and negative cases as well as the predicted scores were used to generate ROC curves and calculate pAUC. At FPR of 0.01, the AUC of EMUDRA was 0.00056 (Fig. 3A) significantly higher than XCos (pAUC = 0.00034, p = 1.65 × 10⁻¹⁸) and KS (pAUC = 0.00026, p = 2.56 × 10⁻¹⁶) as well as other methods (pAUC < 0.00036, p < 7.81 × 10⁻¹¹). At FPR of 0.1, EMUDRA also had the best performance (Supplementary Figs S4A and S5A).
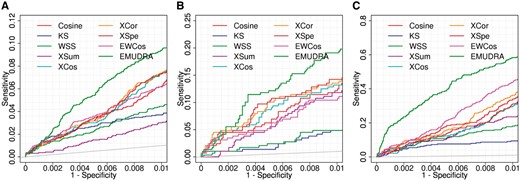
Performance of EMUDRA, EWCos and the existing drug repositioning approaches based on positive controls determined by ATC Codes and the LINCS Dataset. (A) ROC curves and pAUC for the prediction of the 1864 drug pairs sharing at least one ATC codes. These drug pairs were taken as positive cases and the rest drug pairs were set as negative cases. ROC curves and pAUC were generated with FPR <0.01. (B) Performance for predicting the drug pairs sharing at least two ATC codes. (C) Performance for predicting positive control drugs from the LINCS data. 24 cell line specific drug signatures identified from the LINCS data were then used to query the instances in CMap using nineapproaches. The instances in CMap with the same drug and cell line as those in a given LINCS signature were set as positive cases while other instances were taken as negative cases for prediction
We also tested all the nine methods for 288 drug pairs that shared at least two ATC codes. These drug pairs involved 143 unique drugs. The negative cases were the drug pairs between the 143 drugs that shared only one or no ATC code. As shown in Figure 3B, the pAUC (0.00115) of EMUDRA at FPR of 0.01 is 4.2 times larger than that of the KS (p = 8.51 × 10−07) and 42% higher than that of XCos (p = 8.40 × 10−04). Moreover, EMUDRA with the highest whole AUC (0.6827, Supplementary Fig. S4B) and the best pAUC at FPR of 0.1 (0.03052, Supplementary Fig. S5B), significantly outperformed the other methods (P < 0.05).
To more comprehensively evaluate the performance of EMUDRA and EWCos in comparison with the existing drug repositioning methods, we considered the drugs tested in both CMap and LINCS as positive controls. The same 12 drugs were tested in two cell lines including MCF7 and PC3 in CMap and LINCS. We identified 24 cell line specific signatures of the 12 drugs based on the LINCS data. For each drug signature from the LINCS dataset, the corresponding instance(s) (the same cell line treated with the same drug) in CMap was (were) set as positive case(s) while the rest CMap instances corresponding to the remaining 11 signatures were taken as negative cases. At FPR of 0.01, the pAUC (0.0038) of EMUDRA was significantly larger than those of KS (pAUC = 0.0007, P = 3.59 × 10−98) and XCos (pAUC = 0.0013, P = 1.18 × 10⁻²⁷) as well as other methods (pAUC ≤ 0.0021, P < 4.17 × 10⁻¹³) (Fig. 3C). Consistently, the whole AUC (0.90233) of EMUDRA was also significantly larger than those of KS (AUC = 0.68633, P = 1.38 × 10−50) and XCos (AUC = 0.85033, P = 1.53 × 10⁻¹⁵) and so on. Notably, EWCos performed much better than all the other individual methods (Supplementary Figs S4C and S5C). In summary, EMUDRA showed the best performance under all the tested scenarios, whereas EWCos outperforms the individual methods in the LINCS dataset.
We further compared EMUDRA with all the other possible combinations (termed ensemble methods) of the eight non-ensemble methods using the aforementioned datasets. A composite score was used to ranked the 255 methods, where is the discriminant value of a method i in an instance j and is defined as , where, is the rank of a method i for a given instance j based on pAUC (Zhang et al., 2013). Notably, EMUDRA had the largest composite score (Supplementary Table S1), indicating that EMUDRA had the best performance. In addition, we calculated AUC for all the 255 methods for the simulation data. The AUC of the EMUDRA was larger than the AUCs of other ensemble and the non-ensemble methods (Fig. 4A).
The top 20 drugs reversed the TNBC signature
| Drug | EMUDRA score | Known indications and effects | Evidence type | References |
|---|---|---|---|---|
| Colforsin | −14.278 | cAMP elevator may inhibit cell growth | Indirect | Sapio et al. (2017) |
| 5 109 870 | −13.6124 | Iron chelator | Unclear | Fryknas et al. (2016) |
| Etoposide | −12.8953 | Used in TNBC clinical treatment | Direct | Reddy (2011) |
| Resveratrol | −10.4495 | Inhibit growth/migration of TNBC | Direct | Shindikar et al. (2016) |
| Trifluridine | −10.2588 | Improved survival in colorectal patients | Direct | Mayer et al. (2015) |
| Methotrexate | −9.64846 | Used in TNBC clinical treatment | Direct | Colleoni et al. (2002) |
| Quinostatin | −9.36177 | PI3K inhibitor may inhibit tumor growth | Indirect | Yang et al. (2007) |
| Ciclopirox | −9.18798 | Anti-cancer activity in multiple cancers | Direct | Mihailidou et al. (2018) |
| Etacrynic acid | −8.95189 | Induce apoptosis | Indirect | Liu et al. (2013) |
| Calmidazolium | −8.61005 | Inhibit growth of cancer cells | Direct | Lee et al. (2016b) |
| Pyrvinium | −8.59439 | Inhibit tumor cell proliferation | Direct | Momtazi-Borojeni et al. (2018) |
| Monobenzone | −8.41266 | Clinical trial for melanoma | Direct | Teulings et al. (2018) |
| Azacitidine | −8.23745 | Clinical trials for breast cancer | Direct | Connolly et al. (2017) |
| Cytochalasin B | −8.21187 | Induces apoptosis of cancer cells | Indirect | Trendowski (2015) |
| Puromycin | −8.20552 | Protein synthesis inhibitor | Indirect | Lamb et al. (2015) |
| Wortmannin | −8.1305 | Enhances cancer cell apoptosis | Direct | Sato et al. (2017) |
| 0 175 029–0000 | −7.52009 | CDK inhibitor | Indirect | Hsieh et al. (2016) |
| Latamoxef | −7.39494 | Antibiotic | Unclear | None |
| Rifabutin | −7.37229 | Ansamycin antibiotic | Unclear | None |
| Trifluoperazine | −7.21889 | Inhibits tumor growth | Direct | Jiang et al. (2017) |
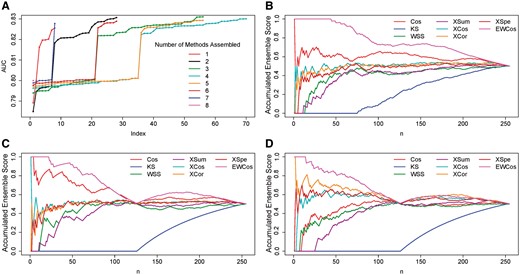
Performance comparison of all possible combinations of the non-ensemble methods. (A) AUCs of the 255 possible combinations of the 8 non-ensemble methods based on the simulation data with noise. The numbers in the legend are number of methods assembled. (B)–(D) The ensemble rate of individual methods in the simulation, ATC and LINCS datasets. All 247 ensemble and 8 non-ensemble methods were rank ordered by AUC
3.3 Application of EMUDRA to TNBC
We applied EMUDRA to a gene signature characterizing TNBC versus adjacent normal breast samples. Based on an FDR cutoff of 0.05 and a fold change threshold of 1.5, we identified the 4776 genes differentially expressed between 11 TNBC samples and matched adjacent normal samples in the TCGA database. The 4776 differentially expressed genes were then used to query CMap by EMUDRA to identify drugs that could reverse these gene expression changes. As shown in Table 1, the top 20 drugs contained many promising drugs including cyclic AMP elevators colforsin and resveratrol; anti-mitotics etoposide, trifluridine, methotrexate, azacitidine and 0 175 029-0000; PI3K inhibitors wortmannin and quinostatin; 5 109 870, an iron chelator; the glutathione S-transferase inhibitor ethacrynic acid; antimicrobials pyrvinium, cytochalasin B, ciclopirox, puromycin, latamoxef and rifabutin; the antipsychotic agents thioridazine and trifluoperazine; and the calcium-calmodulin inhibitor calmidazolium. The genes up-regulated in TNBC but down-regulated by these drugs were particularly enriched for biological processes related to cell cycle and proliferation such as ‘mitotic cell cycle’ (adjusted P = 4.35 × 10−65), ‘nuclear division’ (adjusted p = 8.46 × 10−46) and ‘DNA replication’ (adjusted P-value = 1.47 × 10⁻²¹). On the other hand, the genes down-regulated in TNBC and up-regulated by the drugs were enriched for biological processes associated with development and differentiation such as ‘tissue development’ (adjusted p = 1.94 × 10−05) and ‘cell differentiation’ (adjusted P = 0.0011). These functional enrichment results indicated that the top drugs could suppress cell division and promote cell differentiation, suggesting their potential for treating TNBC.
We then searched the literature to see which drugs had been tested in TNBC or other cancers. As shown in Table 1, several of our top-predicted drugs are currently used for TNBC treatment or have been investigated in pre-clinical or in clinical trials in TNBC. These drugs include etoposide (Lu et al., 2015), methotrexate (Wu et al., 2014) and azacitidine (Connolly et al., 2014). Specifically, etoposide is a topoisomerase II inhibitor that has been clinically used to treat a variety of cancers (Lu et al., 2015). In TNBC, etoposide has shown particular efficacy against cells with BRCA1 mutations (Reddy, 2011) and has been used to treat metastatic breast cancer. For methotrexate, it had been shown that TNBC patients benefited more from the methotrexate combining with cyclophosphamide than other breast cancer subtypes in a clinical trial (Colleoni et al., 2015). Furthermore, several other top drugs had been shown to improve survival of patients with metastatic cancer (Mayer et al., 2015) or antitumor effects in cancer cell lines (Chen et al., 2009; Deng et al., 2013; Kang et al., 2012; Mu et al., 2014), which may be potential therapeutics of TNBC. For instance, in a recent phase III trial, administration of trifluridine significantly improved overall survival of patients with refractory metastatic colorectal cancers in combination with tipiracil (Mayer et al., 2015). In addition to the above mentioned drugs, two other drugs, rifabutin and colforsin, have not been previously investigated in TNBC treatment and are therefore potential novel agents.
3.4 Rifabutin inhibits growth of TNBC cells
We hypothesized that colforsin and rifabutin could potentially reverse the TNBC gene signature and have an anti-proliferative effect on TNBC cells. We selected rifabutin, an antibiotic currently used in the treatment of tuberculosis, for validation due to its more extensive clinical study and use. We grew MDA-MB-231 cells (TNBC cells) in 3 D MatrigelTM and treated them with either DMSO or rifabutin. We dosed rifabutin at the concentration used in CMap, 4.8 μM, as well as one below (1 μM) and one above (25 μM). To quantify differences in cell growth, we took photographs of cells under the above conditions and quantified the proportional area of a field that was occupied by cells (Fig. 5A). One day after beginning treatment, there was no statistically significant difference in cellularity between DMSO- and rifabutin-treated conditions (Fig. 5B). After 7 days of treatment, all concentrations of rifabutin significantly suppressed cell growth (1 μM: 25.9% reduction, P = 1.84e-02; 4.8 μM: 47.4% reduction, P = 1.65e-03; 25 μM: 81. 0% reduction, P = 9.07-04) (Fig. 5B). Similarly, rifabutin treatment significantly impaired viable cell number and had a comparable potency with taxol (Fig. 5C) at a relatively high dosage. This observed inhibition of cell growth is consistent with our prediction that rifabutin is able to reverse the upregulation of pro-proliferative genes in TNBC.
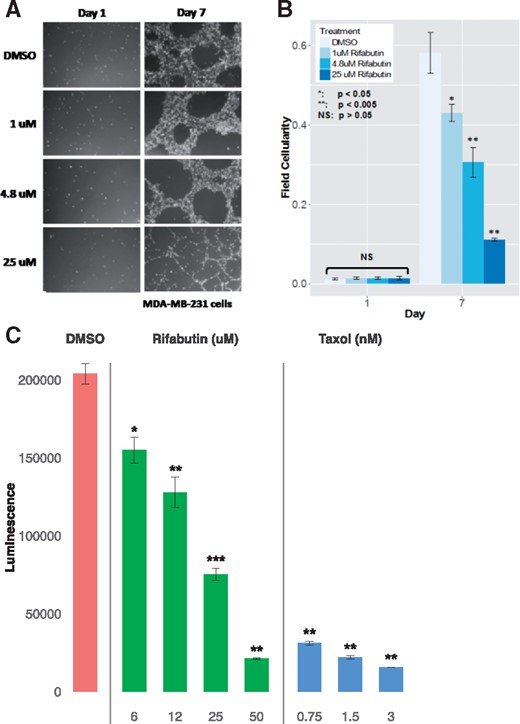
Rifabutin dose-dependently inhibits growth of TNBC cells in 3D culture. (A) MDA-MB-231 cells were grown in 3D MatrigelTM and treated every 24–48 h with DMSO or 1, 4.8 or 25 μM rifabutin. Representative fields (5×) shown. (B). At least four fields each from at least three independent experiments were used for statistical analysis. Error bars represent standard error. Statistical significance of the difference in proportion of a field containing cells (field cellularity) between DMSO- and rifabutin-treated cells was tested using a one-tailed student’s t-test. (C). Viability of rifabutin and taxol-treated MDA-MB-231 cells grown in 3D Matrigel and treated every 48 h with media containing 0.4% DMSO, rifabutin or taxol. Luminescence was assayed using CellTiter-Glo 3D (Promega). Error bars represent standard error of the mean (SEM) from three independent experiments. One-sided student’s t-test comparing treatment to DMSO: *P < 0.05; **P < 0.005; ***P < 0.0005
4 Discussion
A primary assumption under the CMap project is that a drug inducing gene expression changes opposite to the changes caused by a disease can potentially have a therapeutic effect on the disease. The original CMap study utilized the KS statistic to measure the association between a disease signature and drug perturbed gene expression profiles (Lamb et al., 2006). In this study, we developed a non-ensemble method EWCos and an ensemble approach EMUDRA that integrated results from EWCos and three state-of-the-art methods including Cosine, XCor and XSpe. Because neither reliable disease signatures nor gold standard drug-indication set was available for assessing performance of drug repositioning methods, we developed three independent positive control sets (i.e. three simulation datasets with random noise, the drug pairs sharing ATC codes and the cell line-drug pairs shared by CMap and LINCS) to systematically and comprehensively evaluate those methods. EMUDRA consistently out-performed all the other methods, while the KS and WSS methods had the worst performance and the eXtreme methods had relatively good performance.
As CMap measured the drug-perturbed profiles in only three cancer cell lines, the drug signatures cannot perfectly match those from human disease tissues, especially in noncancerous diseases. Even so, CMap has been proved useful for searching potential therapeutic indications for experimental validation. Several studies have used CMap to computationally predict and experimentally validate novel drugs for refractory diseases (Chen et al., 2011; Dudley et al., 2011; Iskar et al., 2015; Kunkel et al., 2011; van Noort et al., 2014). For example, using genes dysregulated by both spinal cord injury and fasting in muscle tissue, Kunkel et al. predicted ursolic acid as a candidate for treating muscle atrophy (Kunkel et al., 2011). This prediction was experimentally validated in a mouse model by showing that the administration of ursolic acid significantly reduced muscle atrophy and stimulated muscle growth. As an another example, topiramate was repurposed to inflammatory bowel disease, which was validated through a trinitrobenzenesulfonic-acid-induced colitis mouse model (Dudley et al., 2011). Nevertheless, the limited number of cell lines and drugs profiled in the CMap restricted its application. Furthermore, narrow spectrum of drug dosages and limited treatment time might not reach the minimum criteria that can cause a measurable gene expression changes. Therefore, although EMUDRA has a very good performance, a larger drug set in a wider dosage spectrum and more cell lines need to be tested to generate more reliable hypotheses. As the LINCS project is continuously producing more drug perturbed gene expression profiles, integration of the LINCS data into EMUDRA will be a next step.
Through querying the signature identified from the matched TNBC and adjacent normal with EMUDRA, we predicted rifabutin and colforsin as two novel indications that could be potential therapeutics for TNBC. We further experimentally validated rifabutin as an inhibitor of TNBC cell proliferation. Our findings suggest that rifabutin and other EMUDRA-predicted drugs may be promising drugs for treating TNBC.
In summary, we developed two novel and effective drug repositioning methods EWCos and EMUDRA. EWCos was designed to reduce the impact of lowly expressed genes on matching score between drug and disease gene signatures while EMUDRA employed an ensemble framework to integrate EWCos and three existing best performed methods. EMUDRA significantly outperformed the state-of-the-art drug repositioning methods. EMUDRA can identify drugs that more effectively target disease gene signatures and will thus be a useful tool for identifying novel therapies for complex diseases and predicting new indications for existing drugs.
Acknowledgements
We would like to thank the CMap and LINCS projects for providing the drug-induced gene expression profiles.
Funding
This work was supported in part by the grants from National Institutes of Health [R01AG046170, RF1AG054014, U01AG052411, RF1AG057440, R01AG057907, U01AG052411, R01CA163772 and U01AI111598]. The opinions and assertions reported here are the responsibility of the authors, and do not necessarily represent the official views of the National Institutes of Health.
Conflict of Interest: none declared.
References

